User's Guide
User's Guide
User's Guide

Create successful ePaper yourself
Turn your PDF publications into a flip-book with our unique Google optimized e-Paper software.
Ch 4. Toolbars, Menus, Dialog boxes & Screen Information<br />
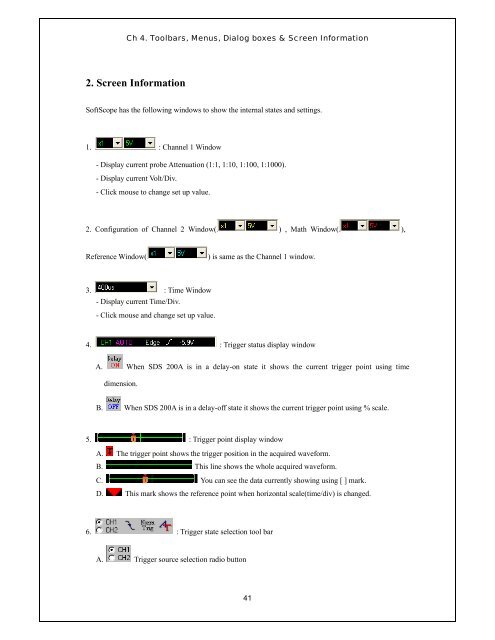
2. Screen Information<br />
SoftScope has the following windows to show the internal states and settings.<br />
1. : Channel 1 Window<br />
- Display current probe Attenuation (1:1, 1:10, 1:100, 1:1000).<br />
- Display current Volt/Div.<br />
- Click mouse to change set up value.<br />
2. Configuration of Channel 2 Window( ) , Math Window( ),<br />
Reference Window(<br />
) is same as the Channel 1 window.<br />
3. : Time Window<br />
- Display current Time/Div.<br />
- Click mouse and change set up value.<br />
4. : Trigger status display window<br />
A. When SDS 200A is in a delay-on state it shows the current trigger point using time<br />
dimension.<br />
B. When SDS 200A is in a delay-off state it shows the current trigger point using % scale.<br />
5. : Trigger point display window<br />
A. The trigger point shows the trigger position in the acquired waveform.<br />
B. This line shows the whole acquired waveform.<br />
C. You can see the data currently showing using [ ] mark.<br />
D. This mark shows the reference point when horizontal scale(time/div) is changed.<br />
6. : Trigger state selection tool bar<br />
A. Trigger source selection radio button<br />
41