National Geoscience Conference 2011 - Department Of Geology ...
National Geoscience Conference 2011 - Department Of Geology ...
National Geoscience Conference 2011 - Department Of Geology ...

You also want an ePaper? Increase the reach of your titles
YUMPU automatically turns print PDFs into web optimized ePapers that Google loves.
NATIONAL GEOSCIENCE CONFERENCE <strong>2011</strong><br />
11 – 12 June <strong>2011</strong> • The Puteri Pacific Johor Bahru, Johor, Malaysia<br />
Paper B6<br />
Application of electrical resistivity method in road subsurface profiling<br />
Azmila Mohd Kamil*, Haryati Awang & Fredrickson Anthony Idi<br />
Institute for Infrastrure Engineering and Sustainable Management<br />
Faculty of Civil Engineering, Universiti Teknologi MARA, Shah Alam, Malaysia<br />
*Email address: azmilakamil@gmail.com<br />
In highway engineering projects such as design, rehabilitation and maintenance of existing pavement, a<br />
geotechnical assessment at the proposed site is required. Recently, the most commonly method to obtain subsurface<br />
profile is by using borehole drilling, which takes a long period to complete and costly. Even though borehole drilling<br />
provides the subsurface depth, but it is only at the sampling location. The data in between the boreholes need to<br />
be interpolated and the result was in an assumption data. In road engineering study, the conventional approach<br />
to evaluate the properties of asphalts and subgrade soils involves a core sampling procedure and a complicated<br />
laboratory testing such as resilient modulus, Marshall Test and Dynamic Cone Penetration test (Livneh et al., 1994).<br />
In order to improve the method of road subsurface profiling, the use of electrical resistivity as an alternative method<br />
was proposed. This paper presents the findings of a study on the application of electrical resistivity method in road<br />
subsurface profiling. The purpose of this study is to obtain the road subsurface profile including the thickness of<br />
the sub layers. In this study two field tests were carried out, electrical resistivity and Dynamic Cone Penetration<br />
test (DCP). The electrical resistivity measurement was conducted at the parking vicinity using ABEM Terrameter<br />
SAS4000 LUND Imaging System. Direct current was applied into the ground through two current electrodes and<br />
measuring the resulting voltage differences at two potential electrodes. A multi-electrode resistivity data acquisition<br />
system proposed by Dahlin (1996) was used. Forty-one electrodes were connected with two multi-cored cables<br />
along 20 m road within 0.5 m spacing. By using a computer program RES2DINV, a 2-D image of road subsurface<br />
was produced. By inversion analysis, the appropriate resistivity value was determined. The DCP test was conducted<br />
to determine the thickness of the surface course, base course, sub-base course and the sub-grade course. Surface<br />
course is the upper layer of the pavement while base course is the main pavement structural layer. The sub-base<br />
course is the secondary load spreading layer underlying the base meanwhile subgrade course is an embankment on<br />
natural earth. The pavement was cored to measure the actual thickness of the structural layer. Then, the DCP test was<br />
carried out by dropped the hammer and the data which is the number of blow was recorded. The tip on cone was laid<br />
to the testing surface as the first step in DCP test. The lower shaft containing the cone moves independently from<br />
the reading rod sitting on the testing surface throughout the test. This process is continued until a desired penetration<br />
depth is reached. The resistivity result is produced in the image form. From the resistivity image, the thickness of<br />
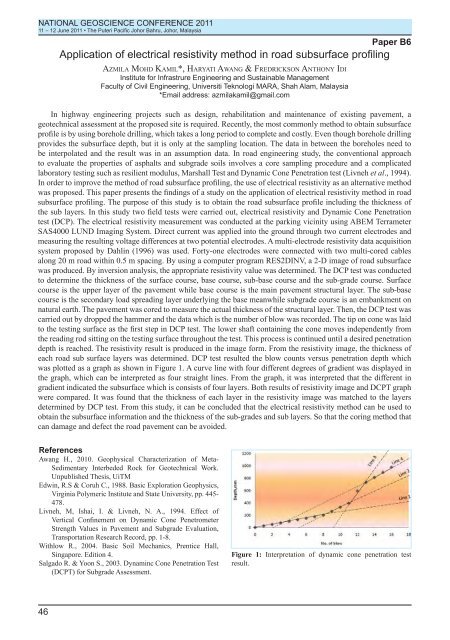
each road sub surface layers was determined. DCP test resulted the blow counts versus penetration depth which<br />
was plotted as a graph as shown in Figure 1. A curve line with four different degrees of gradient was displayed in<br />
the graph, which can be interpreted as four straight lines. From the graph, it was interpreted that the different in<br />
gradient indicated the subsurface which is consists of four layers. Both results of resistivity image and DCPT graph<br />
were compared. It was found that the thickness of each layer in the resistivity image was matched to the layers<br />
determined by DCP test. From this study, it can be concluded that the electrical resistivity method can be used to<br />
obtain the subsurface information and the thickness of the sub-grades and sub layers. So that the coring method that<br />
can damage and defect the road pavement can be avoided.<br />
References<br />
Awang H., 2010. Geophysical Characterization of Meta-<br />
Sedimentary Interbeded Rock for Geotechnical Work.<br />
Unpublished Thesis, UiTM<br />
Edwin, R.S & Coruh C., 1988. Basic Exploration Geophysics,<br />
Virginia Polymeric Institute and State University, pp. 445-<br />
478.<br />
Livneh, M, Ishai, I. & Livneh, N. A., 1994. Effect of<br />
Vertical Confinement on Dynamic Cone Penetrometer<br />
Strength Values in Pavement and Subgrade Evaluation,<br />
Transportation Research Record, pp. 1-8.<br />
Withlow R., 2004. Basic Soil Mechanics, Prentice Hall,<br />
Singapore. Edition 4.<br />
Salgado R. & Yoon S., 2003. Dynaminc Cone Penetration Test<br />
(DCPT) for Subgrade Assessment.<br />
Figure 1: Interpretation of dynamic cone penetration test<br />
result.<br />
46