Cummins Inc. Equity Valuation and Analysis
Cummins Inc. Equity Valuation and Analysis
Cummins Inc. Equity Valuation and Analysis

Create successful ePaper yourself
Turn your PDF publications into a flip-book with our unique Google optimized e-Paper software.
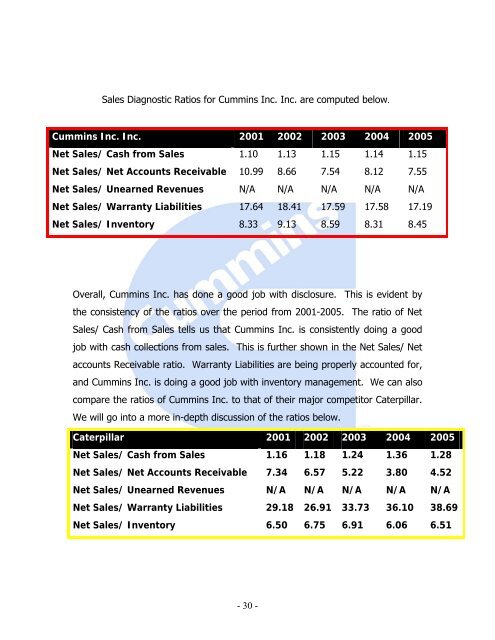
Sales Diagnostic Ratios for <strong>Cummins</strong> <strong>Inc</strong>. <strong>Inc</strong>. are computed below.<br />
<strong>Cummins</strong> <strong>Inc</strong>. <strong>Inc</strong>. 2001 2002 2003 2004 2005<br />
Net Sales/ Cash from Sales 1.10 1.13 1.15 1.14 1.15<br />
Net Sales/ Net Accounts Receivable 10.99 8.66 7.54 8.12 7.55<br />
Net Sales/ Unearned Revenues N/A N/A N/A N/A N/A<br />
Net Sales/ Warranty Liabilities 17.64 18.41 17.59 17.58 17.19<br />
Net Sales/ Inventory 8.33 9.13 8.59 8.31 8.45<br />
Overall, <strong>Cummins</strong> <strong>Inc</strong>. has done a good job with disclosure. This is evident by<br />
the consistency of the ratios over the period from 2001-2005. The ratio of Net<br />
Sales/ Cash from Sales tells us that <strong>Cummins</strong> <strong>Inc</strong>. is consistently doing a good<br />
job with cash collections from sales. This is further shown in the Net Sales/ Net<br />
accounts Receivable ratio. Warranty Liabilities are being properly accounted for,<br />
<strong>and</strong> <strong>Cummins</strong> <strong>Inc</strong>. is doing a good job with inventory management. We can also<br />
compare the ratios of <strong>Cummins</strong> <strong>Inc</strong>. to that of their major competitor Caterpillar.<br />
We will go into a more in-depth discussion of the ratios below.<br />
Caterpillar 2001 2002 2003 2004 2005<br />
Net Sales/ Cash from Sales 1.16 1.18 1.24 1.36 1.28<br />
Net Sales/ Net Accounts Receivable 7.34 6.57 5.22 3.80 4.52<br />
Net Sales/ Unearned Revenues N/A N/A N/A N/A N/A<br />
Net Sales/ Warranty Liabilities 29.18 26.91 33.73 36.10 38.69<br />
Net Sales/ Inventory 6.50 6.75 6.91 6.06 6.51<br />
- 30 -