Cummins Inc. Equity Valuation and Analysis
Cummins Inc. Equity Valuation and Analysis
Cummins Inc. Equity Valuation and Analysis

Create successful ePaper yourself
Turn your PDF publications into a flip-book with our unique Google optimized e-Paper software.
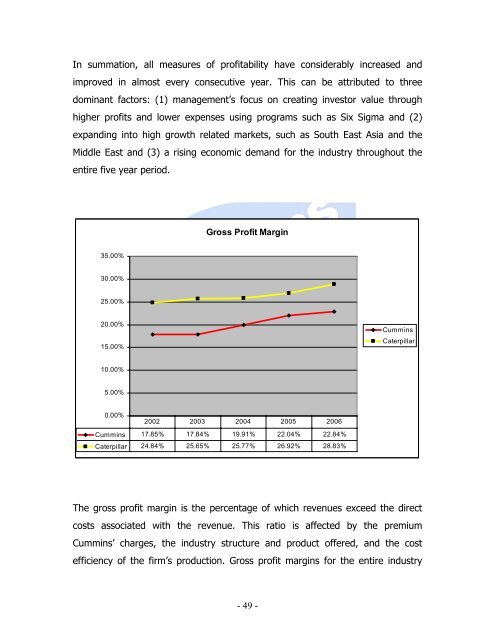
In summation, all measures of profitability have considerably increased <strong>and</strong><br />
improved in almost every consecutive year. This can be attributed to three<br />
dominant factors: (1) management’s focus on creating investor value through<br />
higher profits <strong>and</strong> lower expenses using programs such as Six Sigma <strong>and</strong> (2)<br />
exp<strong>and</strong>ing into high growth related markets, such as South East Asia <strong>and</strong> the<br />
Middle East <strong>and</strong> (3) a rising economic dem<strong>and</strong> for the industry throughout the<br />
entire five year period.<br />
Gross Profit Margin<br />
35.00%<br />
30.00%<br />
25.00%<br />
20.00%<br />
15.00%<br />
<strong>Cummins</strong><br />
Caterpillar<br />
10.00%<br />
5.00%<br />
0.00%<br />
2002 2003 2004 2005 2006<br />
<strong>Cummins</strong> 17.85% 17.84% 19.91% 22.04% 22.84%<br />
Caterpillar 24.84% 25.65% 25.77% 26.92% 28.83%<br />
The gross profit margin is the percentage of which revenues exceed the direct<br />
costs associated with the revenue. This ratio is affected by the premium<br />
<strong>Cummins</strong>’ charges, the industry structure <strong>and</strong> product offered, <strong>and</strong> the cost<br />
efficiency of the firm’s production. Gross profit margins for the entire industry<br />
- 49 -