Cummins Inc. Equity Valuation and Analysis
Cummins Inc. Equity Valuation and Analysis
Cummins Inc. Equity Valuation and Analysis

Create successful ePaper yourself
Turn your PDF publications into a flip-book with our unique Google optimized e-Paper software.
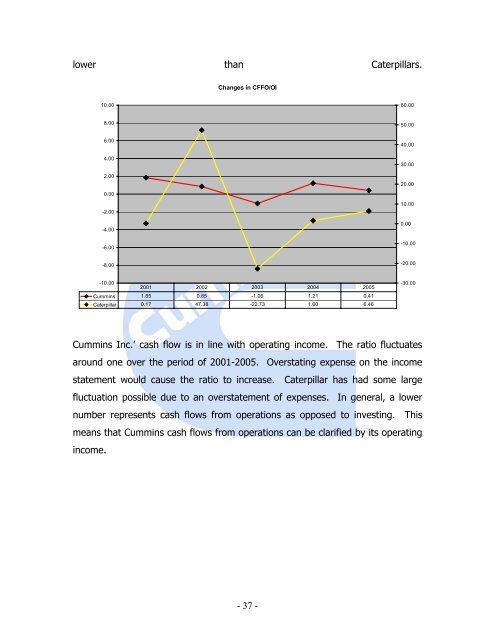
lower than Caterpillars.<br />
Changes in CFFO/OI<br />
10.00<br />
60.00<br />
8.00<br />
50.00<br />
6.00<br />
4.00<br />
2.00<br />
40.00<br />
30.00<br />
20.00<br />
0.00<br />
-2.00<br />
-4.00<br />
-6.00<br />
10.00<br />
0.00<br />
-10.00<br />
-8.00<br />
-20.00<br />
-10.00<br />
2001 2002 2003 2004 2005<br />
<strong>Cummins</strong> 1.85 0.85 -1.06 1.21 0.41<br />
Caterpillar 0.17 47.38 -22.73 1.60 6.46<br />
-30.00<br />
<strong>Cummins</strong> <strong>Inc</strong>.’ cash flow is in line with operating income. The ratio fluctuates<br />
around one over the period of 2001-2005. Overstating expense on the income<br />
statement would cause the ratio to increase. Caterpillar has had some large<br />
fluctuation possible due to an overstatement of expenses. In general, a lower<br />
number represents cash flows from operations as opposed to investing. This<br />
means that <strong>Cummins</strong> cash flows from operations can be clarified by its operating<br />
income.<br />
- 37 -