HW 4 Solutions (PDF)
HW 4 Solutions (PDF)
HW 4 Solutions (PDF)

Create successful ePaper yourself
Turn your PDF publications into a flip-book with our unique Google optimized e-Paper software.
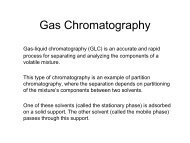
CHEM 155 Instrumental Analysis Prof. Terrill DH-007 924-4970 rterrill@jupiter.sjsu.edu Page 1 of 4<br />
Homework Assignments for the Semester<br />
Homework Assignments for the Semester<br />
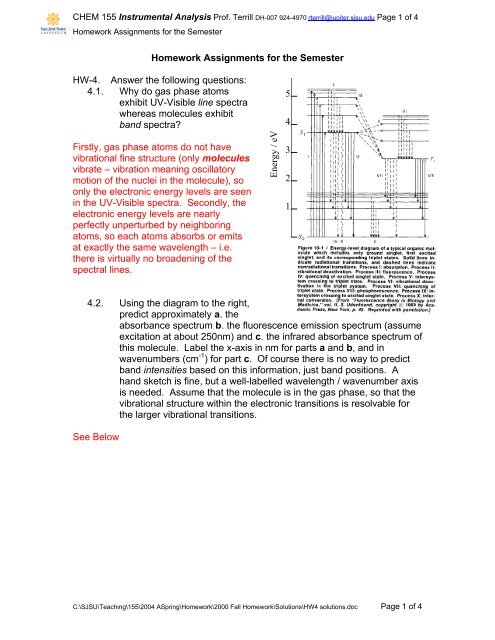
<strong>HW</strong>-4. Answer the following questions:<br />
4.1. Why do gas phase atoms<br />
exhibit UV-Visible line spectra<br />
whereas molecules exhibit<br />
band spectra<br />
Firstly, gas phase atoms do not have<br />
vibrational fine structure (only molecules<br />
vibrate – vibration meaning oscillatory<br />
motion of the nuclei in the molecule), so<br />
only the electronic energy levels are seen<br />
in the UV-Visible spectra. Secondly, the<br />
electronic energy levels are nearly<br />
perfectly unperturbed by neighboring<br />
atoms, so each atoms absorbs or emits<br />
at exactly the same wavelength – i.e.<br />
there is virtually no broadening of the<br />
spectral lines.<br />
Energy / eV<br />
5<br />
4<br />
3<br />
2<br />
1<br />
4.2. Using the diagram to the right,<br />
predict approximately a. the<br />
absorbance spectrum b. the fluorescence emission spectrum (assume<br />
excitation at about 250nm) and c. the infrared absorbance spectrum of<br />
this molecule. Label the x-axis in nm for parts a and b, and in<br />
wavenumbers (cm -1 ) for part c. Of course there is no way to predict<br />
band intensities based on this information, just band positions. A<br />
hand sketch is fine, but a well-labelled wavelength / wavenumber axis<br />
is needed. Assume that the molecule is in the gas phase, so that the<br />
vibrational structure within the electronic transitions is resolvable for<br />
the larger vibrational transitions.<br />
See Below<br />
C:\SJSU\Teaching\155\2004 ASpring\Homework\2000 Fall Homework\<strong>Solutions</strong>\<strong>HW</strong>4 solutions.doc Page 1 of 4
CHEM 155 Instrumental Analysis Prof. Terrill DH-007 924-4970 rterrill@jupiter.sjsu.edu Page 2 of 4<br />
Homework Assignments for the Semester<br />
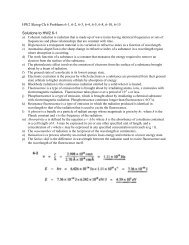
This one required a little bit of graph reading. I measured the energy levels in<br />
mm, and then converted to eV using 5.0 eV = 61 mm.<br />
Next I just did straightforward energy calculations: ν = E/h, then λ = c/ν, then ν-<br />
bar = 1/λ(cm). This was convenient using Excel – but wouldn’t take much longer<br />
using a calculator!<br />
The absorbance spectrum appears between S 0 0 and S n 1 where n is the<br />
vibrational sublevel and varies between 0 and 6.<br />
The fluorescence spectrum has two branches: one from S 0 1 - S n o and one from<br />
T 0 1 - S n o .<br />
The infrared spectrum appears between S 0 0 and S n 0 .<br />
Number of mm that I measured…<br />
n<br />
n S o<br />
n n<br />
S 1 T o<br />
_______________________<br />
0 0 45 34<br />
1 8 53<br />
2 12 57<br />
3 15 60<br />
4 17 61<br />
5 18 62<br />
6 19 63<br />
Number of millimeters of energy level on graph:<br />
n<br />
n<br />
n<br />
n S o S 1 T o<br />
0 0 45 34<br />
1 8 53 -<br />
2 12 57 -<br />
3 15 60 -<br />
4 17 61 -<br />
5 18 62 -<br />
6 19 63 -<br />
Energy in electron volts = #mm * 5.0/6.1<br />
n<br />
n<br />
S o<br />
n<br />
S 1 n<br />
T 1 S 0 n<br />
1 - S o T 0 n<br />
1 - S o<br />
0 0.00 3.69 2.79 3.69 2.79<br />
1 0.66 4.34 - 3.03 2.13<br />
2 0.98 4.67 - 2.70 1.80<br />
3 1.23 4.92 - 2.46 1.56<br />
4 1.39 5.00 - 2.30 1.39<br />
5 1.48 5.08 - 2.21 1.31<br />
6 1.56 5.16 - 2.13 1.23<br />
C:\SJSU\Teaching\155\2004 ASpring\Homework\2000 Fall Homework\<strong>Solutions</strong>\<strong>HW</strong>4 solutions.doc Page 2 of 4
CHEM 155 Instrumental Analysis Prof. Terrill DH-007 924-4970 rterrill@jupiter.sjsu.edu Page 3 of 4<br />
Homework Assignments for the Semester<br />
Frequency in Hz v = E/h<br />
n<br />
n<br />
S o<br />
n<br />
S 1 n<br />
T 1 S 0 n<br />
1 - S o T 0 n<br />
1 - S o<br />
0 0.00E+00 8.92E+14 6.74E+14 8.92E+14 6.74E+14<br />
1 1.59E+14 1.05E+15 - 7.33E+14 5.15E+14<br />
2 2.38E+14 1.13E+15 - 6.54E+14 4.36E+14<br />
3 2.97E+14 1.19E+15 - 5.95E+14 3.77E+14<br />
4 3.37E+14 1.21E+15 - 5.55E+14 3.37E+14<br />
5 3.57E+14 1.23E+15 - 5.35E+14 3.17E+14<br />
6 3.77E+14 1.25E+15 - 5.15E+14 2.97E+14<br />
Wavelength in nm = L = c/v<br />
n<br />
S o<br />
n<br />
S 1<br />
n<br />
n<br />
T 1 S 0 n<br />
1 - S o T 0 n<br />
1 - S o<br />
0 - 336 445 336 445<br />
1 1892 286 - 409 582<br />
2 1262 266 - 459 688<br />
3 1009 252 - 505 797<br />
4 890 248 - 541 890<br />
5 841 244 - 561 946<br />
6 797 240 - 582 1009<br />
Wavenumber in cm-1 = 1E7/ L<br />
n<br />
n<br />
S o<br />
n<br />
S 1 n<br />
T 1<br />
0 - 29726 22460<br />
1 5285 35011 - 1<br />
2 7927 37653 - 1<br />
3 9909 39635 - 1<br />
4 11230 40296 - 1<br />
5 11891 40956 - 1<br />
6 12551 41617 - 1<br />
C:\SJSU\Teaching\155\2004 ASpring\Homework\2000 Fall Homework\<strong>Solutions</strong>\<strong>HW</strong>4 solutions.doc Page 3 of 4
CHEM 155 Instrumental Analysis Prof. Terrill DH-007 924-4970 rterrill@jupiter.sjsu.edu Page 4 of 4<br />
Homework Assignments for the Semester<br />
Absorbance and Fluorescence Lines<br />
0.9<br />
0.8<br />
0.7<br />
Intensity / Arbitrary Units<br />
0.6<br />
0.5<br />
0.4<br />
0.3<br />
0.2<br />
S1-S0 Fluroescence vs Lambda<br />
/ nm<br />
T10-S0n Phosphorescence<br />
Absorbance lines S0-S1n<br />
0.1<br />
0<br />
200 400 600 800 1000<br />
Lambda / nm<br />
Infrared Absorbance - S00-S0n<br />
1.2<br />
Absorbance / arbitrary units<br />
1<br />
0.8<br />
0.6<br />
0.4<br />
0.2<br />
0<br />
4000 6000 8000 10000 12000 14000<br />
Wavenumber / cm-1<br />
C:\SJSU\Teaching\155\2004 ASpring\Homework\2000 Fall Homework\<strong>Solutions</strong>\<strong>HW</strong>4 solutions.doc Page 4 of 4