Full Version Guinness Anchor Berhad Annual Report 2009 - Gab
Full Version Guinness Anchor Berhad Annual Report 2009 - Gab
Full Version Guinness Anchor Berhad Annual Report 2009 - Gab

You also want an ePaper? Increase the reach of your titles
YUMPU automatically turns print PDFs into web optimized ePapers that Google loves.
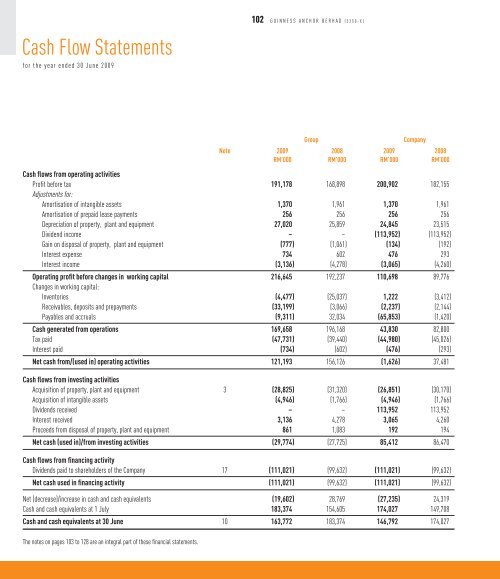
102 GUINNESS ANCHOR BERHAD (5350-X)<br />
Cash Flow Statements<br />
for the year ended 30 June <strong>2009</strong><br />
Group<br />
Company<br />
Note <strong>2009</strong> 2008 <strong>2009</strong> 2008<br />
RM’000 RM’000 RM’000 RM’000<br />
Cash flows from operating activities<br />
Profit before tax 191,178 168,898 200,902 182,155<br />
Adjustments for:<br />
Amortisation of intangible assets 1,370 1,961 1,370 1,961<br />
Amortisation of prepaid lease payments 256 256 256 256<br />
Depreciation of property, plant and equipment 27,020 25,859 24,845 23,515<br />
Dividend income – – (113,952) (113,952)<br />
Gain on disposal of property, plant and equipment (777) (1,061) (134) (192)<br />
Interest expense 734 602 476 293<br />
Interest income (3,136) (4,278) (3,065) (4,260)<br />
Operating profit before changes in working capital 216,645 192,237 110,698 89,776<br />
Changes in working capital:<br />
Inventories (4,477) (25,037) 1,222 (3,412)<br />
Receivables, deposits and prepayments (33,199) (3,066) (2,237) (2,144)<br />
Payables and accruals (9,311) 32,034 (65,853) (1,420)<br />
Cash generated from operations 169,658 196,168 43,830 82,800<br />
Tax paid (47,731) (39,440) (44,980) (45,026)<br />
Interest paid (734) (602) (476) (293)<br />
Net cash from/(used in) operating activities 121,193 156,126 (1,626) 37,481<br />
Cash flows from investing activities<br />
Acquisition of property, plant and equipment 3 (28,825) (31,320) (26,851) (30,170)<br />
Acquisition of intangible assets (4,946) (1,766) (4,946) (1,766)<br />
Dividends received – – 113,952 113,952<br />
Interest received 3,136 4,278 3,065 4,260<br />
Proceeds from disposal of property, plant and equipment 861 1,083 192 194<br />
Net cash (used in)/from investing activities (29,774) (27,725) 85,412 86,470<br />
Cash flows from financing activity<br />
Dividends paid to shareholders of the Company 17 (111,021) (99,632) (111,021) (99,632)<br />
Net cash used in financing activity (111,021) (99,632) (111,021) (99,632)<br />
Net (decrease)/increase in cash and cash equivalents (19,602) 28,769 (27,235) 24,319<br />
Cash and cash equivalents at 1 July 183,374 154,605 174,027 149,708<br />
Cash and cash equivalents at 30 June 10 163,772 183,374 146,792 174,027<br />
The notes on pages 103 to 128 are an integral part of these financial statements.