Metropolitan Melbourne Investigation Discussion Paper - Victorian ...
Metropolitan Melbourne Investigation Discussion Paper - Victorian ...
Metropolitan Melbourne Investigation Discussion Paper - Victorian ...

You also want an ePaper? Increase the reach of your titles
YUMPU automatically turns print PDFs into web optimized ePapers that Google loves.
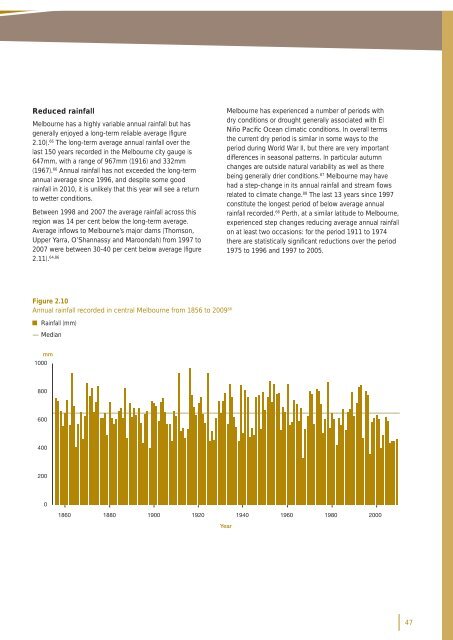
Reduced rainfall<br />
<strong>Melbourne</strong> has a highly variable annual rainfall but has<br />
generally enjoyed a long-term reliable average (fi gure<br />
2.10). 66 The long-term average annual rainfall over the<br />
last 150 years recorded in the <strong>Melbourne</strong> city gauge is<br />
647mm, with a range of 967mm (1916) and 332mm<br />
(1967). 66 Annual rainfall has not exceeded the long-term<br />
annual average since 1996, and despite some good<br />
rainfall in 2010, it is unlikely that this year will see a return<br />
to wetter conditions.<br />
Between 1998 and 2007 the average rainfall across this<br />
region was 14 per cent below the long-term average.<br />
Average infl ows to <strong>Melbourne</strong>’s major dams (Thomson,<br />
Upper Yarra, O’Shannassy and Maroondah) from 1997 to<br />
2007 were between 30-40 per cent below average (fi gure<br />
2.11). 64,86<br />
<strong>Melbourne</strong> has experienced a number of periods with<br />
dry conditions or drought generally associated with El<br />
Niño Pacifi c Ocean climatic conditions. In overall terms<br />
the current dry period is similar in some ways to the<br />
period during World War II, but there are very important<br />
differences in seasonal patterns. In particular autumn<br />
changes are outside natural variability as well as there<br />
being generally drier conditions. 87 <strong>Melbourne</strong> may have<br />
had a step-change in its annual rainfall and stream fl ows<br />
related to climate change. 88 The last 13 years since 1997<br />
constitute the longest period of below average annual<br />
rainfall recorded. 66 Perth, at a similar latitude to <strong>Melbourne</strong>,<br />
experienced step changes reducing average annual rainfall<br />
on at least two occasions: for the period 1911 to 1974<br />
there are statistically signifi cant reductions over the period<br />
1975 to 1996 and 1997 to 2005.<br />
Figure 2.10<br />
Annual rainfall recorded in central <strong>Melbourne</strong> from 1856 to 2009 66<br />
Rainfall (mm)<br />
— Median<br />
1000<br />
mm<br />
800<br />
600<br />
400<br />
200<br />
0<br />
1860 1880 1900 1920 1940 1960 1980 2000<br />
Year<br />
47