Table Of Contents - Chicago Transit Authority
Table Of Contents - Chicago Transit Authority
Table Of Contents - Chicago Transit Authority

You also want an ePaper? Increase the reach of your titles
YUMPU automatically turns print PDFs into web optimized ePapers that Google loves.
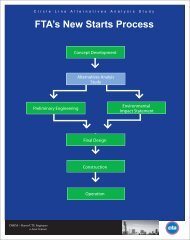
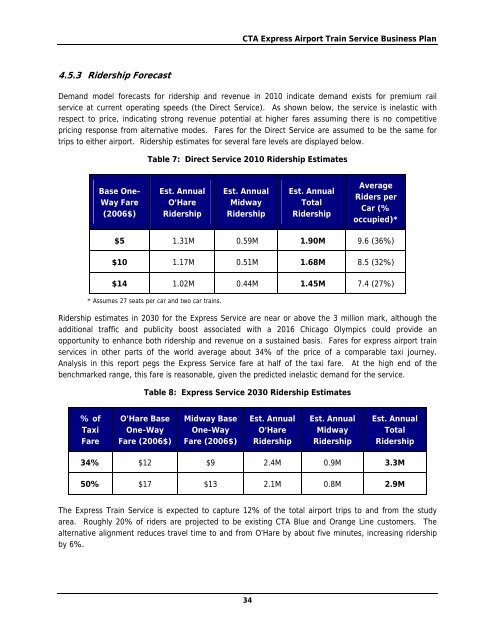
4.5.3 Ridership Forecast<br />
CTA Express Airport Train Service Business Plan<br />
Demand model forecasts for ridership and revenue in 2010 indicate demand exists for premium rail<br />
service at current operating speeds (the Direct Service). As shown below, the service is inelastic with<br />
respect to price, indicating strong revenue potential at higher fares assuming there is no competitive<br />
pricing response from alternative modes. Fares for the Direct Service are assumed to be the same for<br />
trips to either airport. Ridership estimates for several fare levels are displayed below.<br />
Base One-<br />
Way Fare<br />
(2006$)<br />
<strong>Table</strong> 7: Direct Service 2010 Ridership Estimates<br />
Est. Annual<br />
O’Hare<br />
Ridership<br />
Est. Annual<br />
Midway<br />
Ridership<br />
Est. Annual<br />
Total<br />
Ridership<br />
Average<br />
Riders per<br />
Car (%<br />
occupied)*<br />
$5 1.31M 0.59M 1.90M 9.6 (36%)<br />
$10 1.17M 0.51M 1.68M 8.5 (32%)<br />
$14 1.02M 0.44M 1.45M 7.4 (27%)<br />
* Assumes 27 seats per car and two car trains.<br />
Ridership estimates in 2030 for the Express Service are near or above the 3 million mark, although the<br />
additional traffic and publicity boost associated with a 2016 <strong>Chicago</strong> Olympics could provide an<br />
opportunity to enhance both ridership and revenue on a sustained basis. Fares for express airport train<br />
services in other parts of the world average about 34% of the price of a comparable taxi journey.<br />
Analysis in this report pegs the Express Service fare at half of the taxi fare. At the high end of the<br />
benchmarked range, this fare is reasonable, given the predicted inelastic demand for the service.<br />
% of<br />
Taxi<br />
Fare<br />
<strong>Table</strong> 8: Express Service 2030 Ridership Estimates<br />
O’Hare Base<br />
One-Way<br />
Fare (2006$)<br />
Midway Base<br />
One-Way<br />
Fare (2006$)<br />
Est. Annual<br />
O’Hare<br />
Ridership<br />
Est. Annual<br />
Midway<br />
Ridership<br />
Est. Annual<br />
Total<br />
Ridership<br />
34% $12 $9 2.4M 0.9M 3.3M<br />
50% $17 $13 2.1M 0.8M 2.9M<br />
The Express Train Service is expected to capture 12% of the total airport trips to and from the study<br />
area. Roughly 20% of riders are projected to be existing CTA Blue and Orange Line customers. The<br />
alternative alignment reduces travel time to and from O’Hare by about five minutes, increasing ridership<br />
by 6%.<br />
34