Table Of Contents - Chicago Transit Authority
Table Of Contents - Chicago Transit Authority
Table Of Contents - Chicago Transit Authority

Create successful ePaper yourself
Turn your PDF publications into a flip-book with our unique Google optimized e-Paper software.
4.5.5 Factors Affecting Demand<br />
Certain factors could impact ridership and revenues:<br />
CTA Express Airport Train Service Business Plan<br />
• Competitive alternatives for airport access – As discussed, several viable alternatives exist for air<br />
passengers to utilize when traveling to and from <strong>Chicago</strong>’s airports.<br />
• Continued strength of the Loop – Based on the station location at 108 N. State Street, downtown<br />
<strong>Chicago</strong> must sustain its position as a reliable trip generator.<br />
• Complete dependence on air travel demand – Business and leisure air travel must continue to<br />
increase for long-term ridership forecasts to materialize.<br />
• Ability of O’Hare to match capacity with demand – It is necessary for O’Hare Airport to expand<br />
operations appropriately in order to meet growing passenger demand.<br />
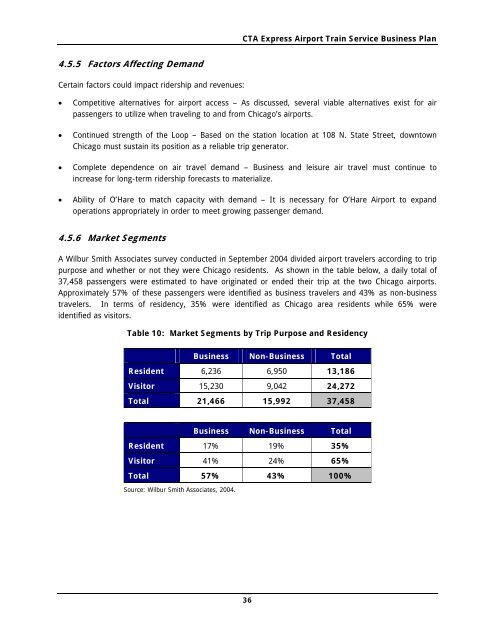
4.5.6 Market Segments<br />
A Wilbur Smith Associates survey conducted in September 2004 divided airport travelers according to trip<br />
purpose and whether or not they were <strong>Chicago</strong> residents. As shown in the table below, a daily total of<br />
37,458 passengers were estimated to have originated or ended their trip at the two <strong>Chicago</strong> airports.<br />
Approximately 57% of these passengers were identified as business travelers and 43% as non-business<br />
travelers. In terms of residency, 35% were identified as <strong>Chicago</strong> area residents while 65% were<br />
identified as visitors.<br />
<strong>Table</strong> 10: Market Segments by Trip Purpose and Residency<br />
Business Non-Business Total<br />
Resident 6,236 6,950 13,186<br />
Visitor 15,230 9,042 24,272<br />
Total 21,466 15,992 37,458<br />
Business Non-Business Total<br />
Resident 17% 19% 35%<br />
Visitor 41% 24% 65%<br />
Total 57% 43% 100%<br />
Source: Wilbur Smith Associates, 2004.<br />
36