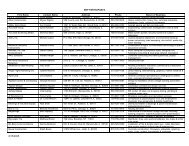
Table Of Contents - Chicago Transit Authority
Table Of Contents - Chicago Transit Authority
Table Of Contents - Chicago Transit Authority

Create successful ePaper yourself
Turn your PDF publications into a flip-book with our unique Google optimized e-Paper software.
4.5.4 Key Demand Drivers<br />
CTA Express Airport Train Service Business Plan<br />
Naturally, demand for airport access is driven by underlying airline passenger travel. Choice of access<br />
mode, in turn, is driven by factors such as trip origin, mode availability, travel time, travel time reliability,<br />
and costs.<br />
4.5.4.1 Airline Passengers<br />
O’Hare is one of the busiest airports in the world. According to the Wilbur Smith study, there were 34.8<br />
million enplanements at O’Hare in 2003. <strong>Of</strong> this total, 15.6 million originated at O’Hare, the remainder<br />
being transfers. The study also reported that there were 9.2 million enplanements at Midway in 2003, of<br />
which 6.4 million originated at Midway.<br />
Forecasts predict annual enplanements at O’Hare will grow at a compound annual growth rate (CAGR) of<br />
2.5% through 2020. Midway enplanements are forecast to grow at a CAGR of 2.1% over that same<br />
period, with an increasing proportion of originating passengers.<br />
4.5.4.2 Time Savings and Reliability of Travel Time<br />
Total travel time and travel time reliability affect customer mode choices. As roadway congestion<br />
increases, options that involve roadway travel will experience greater delays and time variation. As<br />
shown in the table below, developed with data from the Wilbur Smith study, travel time for car options<br />
are projected to increase by between 10% and 11% from 2009 to 2020. With increasing travel time and<br />
greater unreliability, auto options will become less attractive. The demand model takes this trend into<br />
account in determining the shifts in mode share over time.<br />
<strong>Table</strong> 9: Sample Travel Time to O’Hare for Auto Options (Drop-off)<br />
Origin<br />
Travel Time<br />
(minutes)<br />
2009<br />
Travel Time<br />
(minutes)<br />
2020<br />
Sears Tower 56 62<br />
Michigan Avenue (& Superior) 55 61<br />
West Loop (Madison & Clinton) 51 56<br />
Source: Wilbur Smith Associates, 2004.<br />
4.5.4.3 Travel Cost<br />
Another important driver of mode choice is cost. Depending on the mode, different kinds and levels of<br />
costs are incurred. Travelers who drive and park will incur airport parking fees, fuel costs, as well as<br />
costs related to car ownership and maintenance. Travelers renting cars may also incur parking fees in<br />
addition to rental fees. Travelers taking taxis, bus shuttle, or train service pay a single fare.<br />
Information on the costs associated with each mode choice was factored into the demand model for<br />
mode share forecasts.<br />
35