Geriatric Medicine Training and Practice in the United States at the ...
Geriatric Medicine Training and Practice in the United States at the ...
Geriatric Medicine Training and Practice in the United States at the ...

You also want an ePaper? Increase the reach of your titles
YUMPU automatically turns print PDFs into web optimized ePapers that Google loves.
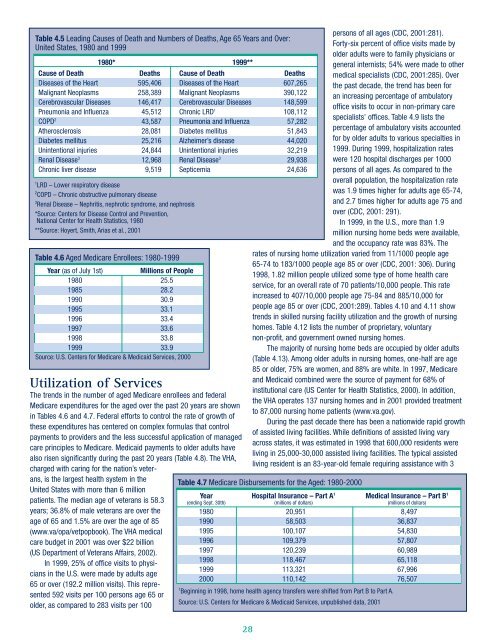
Table 4.5 Lead<strong>in</strong>g Causes of De<strong>at</strong>h <strong>and</strong> Numbers of De<strong>at</strong>hs, Age 65 Years <strong>and</strong> Over:<br />
<strong>United</strong> <strong>St<strong>at</strong>es</strong>, 1980 <strong>and</strong> 1999<br />
1 LRD – Lower respir<strong>at</strong>ory disease<br />
2 COPD – Chronic obstructive pulmonary disease<br />
3 Renal Disease – Nephritis, nephrotic syndrome, <strong>and</strong> nephrosis<br />
*Source: Centers for Disease Control <strong>and</strong> Prevention,<br />
N<strong>at</strong>ional Center for Health St<strong>at</strong>istics, 1980<br />
**Source: Hoyert, Smith, Arias et al., 2001<br />
Utiliz<strong>at</strong>ion of Services<br />
The trends <strong>in</strong> <strong>the</strong> number of aged Medicare enrollees <strong>and</strong> federal<br />
Medicare expenditures for <strong>the</strong> aged over <strong>the</strong> past 20 years are shown<br />
<strong>in</strong> Tables 4.6 <strong>and</strong> 4.7. Federal efforts to control <strong>the</strong> r<strong>at</strong>e of growth of<br />
<strong>the</strong>se expenditures has centered on complex formulas th<strong>at</strong> control<br />
payments to providers <strong>and</strong> <strong>the</strong> less successful applic<strong>at</strong>ion of managed<br />
care pr<strong>in</strong>ciples to Medicare. Medicaid payments to older adults have<br />
also risen significantly dur<strong>in</strong>g <strong>the</strong> past 20 years (Table 4.8). The VHA,<br />
charged with car<strong>in</strong>g for <strong>the</strong> n<strong>at</strong>ion’s veterans,<br />
is <strong>the</strong> largest health system <strong>in</strong> <strong>the</strong><br />
<strong>United</strong> <strong>St<strong>at</strong>es</strong> with more than 6 million<br />
p<strong>at</strong>ients. The median age of veterans is 58.3<br />
years; 36.8% of male veterans are over <strong>the</strong><br />
age of 65 <strong>and</strong> 1.5% are over <strong>the</strong> age of 85<br />
(www.va/opa/vetpopbook). The VHA medical<br />
care budget <strong>in</strong> 2001 was over $22 billion<br />
(US Department of Veterans Affairs, 2002).<br />
In 1999, 25% of office visits to physicians<br />
<strong>in</strong> <strong>the</strong> U.S. were made by adults age<br />
65 or over (192.2 million visits). This represented<br />
592 visits per 100 persons age 65 or<br />
older, as compared to 283 visits per 100<br />
1980* 1999**<br />
Cause of De<strong>at</strong>h De<strong>at</strong>hs Cause of De<strong>at</strong>h De<strong>at</strong>hs<br />
Diseases of <strong>the</strong> Heart 595,406 Diseases of <strong>the</strong> Heart 607,265<br />
Malignant Neoplasms 258,389 Malignant Neoplasms 390,122<br />
Cerebrovascular Diseases 146,417 Cerebrovascular Diseases 148,599<br />
Pneumonia <strong>and</strong> Influenza 45,512 Chronic LRD 1 108,112<br />
COPD 2 43,587 Pneumonia <strong>and</strong> Influenza 57,282<br />
A<strong>the</strong>rosclerosis 28,081 Diabetes mellitus 51,843<br />
Diabetes mellitus 25,216 Alzheimer’s disease 44,020<br />
Un<strong>in</strong>tentional <strong>in</strong>juries 24,844 Un<strong>in</strong>tentional <strong>in</strong>juries 32,219<br />
Renal Disease 3 12,968 Renal Disease 3 29,938<br />
Chronic liver disease 9,519 Septicemia 24,636<br />
Table 4.6 Aged Medicare Enrollees: 1980-1999<br />
Year (as of July 1st)<br />
Millions of People<br />
1980 25.5<br />
1985 28.2<br />
1990 30.9<br />
1995 33.1<br />
1996 33.4<br />
1997 33.6<br />
1998 33.8<br />
1999 33.9<br />
Source: U.S. Centers for Medicare & Medicaid Services, 2000<br />
persons of all ages (CDC, 2001:281).<br />
Forty-six percent of office visits made by<br />
older adults were to family physicians or<br />
general <strong>in</strong>ternists; 54% were made to o<strong>the</strong>r<br />
medical specialists (CDC, 2001:285). Over<br />
<strong>the</strong> past decade, <strong>the</strong> trend has been for<br />
an <strong>in</strong>creas<strong>in</strong>g percentage of ambul<strong>at</strong>ory<br />
office visits to occur <strong>in</strong> non-primary care<br />
specialists’ offices. Table 4.9 lists <strong>the</strong><br />
percentage of ambul<strong>at</strong>ory visits accounted<br />
for by older adults to various specialties <strong>in</strong><br />
1999. Dur<strong>in</strong>g 1999, hospitaliz<strong>at</strong>ion r<strong>at</strong>es<br />
were 120 hospital discharges per 1000<br />
persons of all ages. As compared to <strong>the</strong><br />
overall popul<strong>at</strong>ion, <strong>the</strong> hospitaliz<strong>at</strong>ion r<strong>at</strong>e<br />
was 1.9 times higher for adults age 65-74,<br />
<strong>and</strong> 2.7 times higher for adults age 75 <strong>and</strong><br />
over (CDC, 2001: 291).<br />
In 1999, <strong>in</strong> <strong>the</strong> U.S., more than 1.9<br />
million nurs<strong>in</strong>g home beds were available,<br />
<strong>and</strong> <strong>the</strong> occupancy r<strong>at</strong>e was 83%. The<br />
r<strong>at</strong>es of nurs<strong>in</strong>g home utiliz<strong>at</strong>ion varied from 11/1000 people age<br />
65-74 to 183/1000 people age 85 or over (CDC, 2001: 306). Dur<strong>in</strong>g<br />
1998, 1.82 million people utilized some type of home health care<br />
service, for an overall r<strong>at</strong>e of 70 p<strong>at</strong>ients/10,000 people. This r<strong>at</strong>e<br />
<strong>in</strong>creased to 407/10,000 people age 75-84 <strong>and</strong> 885/10,000 for<br />
people age 85 or over (CDC, 2001:289). Tables 4.10 <strong>and</strong> 4.11 show<br />
trends <strong>in</strong> skilled nurs<strong>in</strong>g facility utiliz<strong>at</strong>ion <strong>and</strong> <strong>the</strong> growth of nurs<strong>in</strong>g<br />
homes. Table 4.12 lists <strong>the</strong> number of proprietary, voluntary<br />
non-profit, <strong>and</strong> government owned nurs<strong>in</strong>g homes.<br />
The majority of nurs<strong>in</strong>g home beds are occupied by older adults<br />
(Table 4.13). Among older adults <strong>in</strong> nurs<strong>in</strong>g homes, one-half are age<br />
85 or older, 75% are women, <strong>and</strong> 88% are white. In 1997, Medicare<br />
<strong>and</strong> Medicaid comb<strong>in</strong>ed were <strong>the</strong> source of payment for 68% of<br />
<strong>in</strong>stitutional care (US Center for Health St<strong>at</strong>istics, 2000). In addition,<br />
<strong>the</strong> VHA oper<strong>at</strong>es 137 nurs<strong>in</strong>g homes <strong>and</strong> <strong>in</strong> 2001 provided tre<strong>at</strong>ment<br />
to 87,000 nurs<strong>in</strong>g home p<strong>at</strong>ients (www.va.gov).<br />
Dur<strong>in</strong>g <strong>the</strong> past decade <strong>the</strong>re has been a n<strong>at</strong>ionwide rapid growth<br />
of assisted liv<strong>in</strong>g facilities. While def<strong>in</strong>itions of assisted liv<strong>in</strong>g vary<br />
across st<strong>at</strong>es, it was estim<strong>at</strong>ed <strong>in</strong> 1998 th<strong>at</strong> 600,000 residents were<br />
liv<strong>in</strong>g <strong>in</strong> 25,000-30,000 assisted liv<strong>in</strong>g facilities. The typical assisted<br />
liv<strong>in</strong>g resident is an 83-year-old female requir<strong>in</strong>g assistance with 3<br />
Table 4.7 Medicare Disbursements for <strong>the</strong> Aged: 1980-2000<br />
Year Hospital Insurance – Part A 1 Medical Insurance – Part B 1<br />
(end<strong>in</strong>g Sept. 30th) (millions of dollars) (millions of dollars)<br />
1980 20,951 8,497<br />
1990 58,503 36,837<br />
1995 100,107 54,830<br />
1996 109,379 57,807<br />
1997 120,239 60,989<br />
1998 118,467 65,118<br />
1999 113,321 67,996<br />
2000 110,142 76,507<br />
1 Beg<strong>in</strong>n<strong>in</strong>g <strong>in</strong> 1998, home health agency transfers were shifted from Part B to Part A.<br />
Source: U.S. Centers for Medicare & Medicaid Services, unpublished d<strong>at</strong>a, 2001<br />
28