The Carbon Price and the Cost of Living - The Climate Institute
The Carbon Price and the Cost of Living - The Climate Institute
The Carbon Price and the Cost of Living - The Climate Institute

You also want an ePaper? Increase the reach of your titles
YUMPU automatically turns print PDFs into web optimized ePapers that Google loves.
AECOM<br />
<strong>The</strong> <strong>Carbon</strong> <strong>Price</strong> <strong>and</strong> <strong>the</strong> <strong>Cost</strong> <strong>of</strong> <strong>Living</strong><br />
9 November 2011<br />
iv<br />
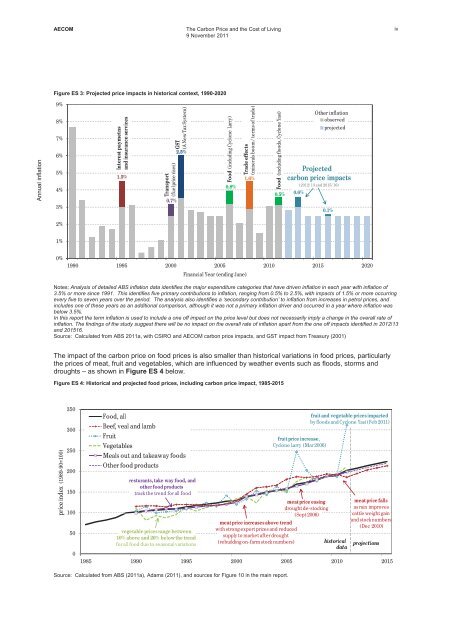
Figure ES 3: Projected price impacts in historical context, 1990-2020<br />
Annual inflation<br />
9%<br />
8%<br />
7%<br />
6%<br />
5%<br />
4%<br />
3%<br />
Interestpaymetns<br />
<strong>and</strong>insuranceservices<br />
1.5%<br />
Transport<br />
(fuelpricerises)<br />
0.7%<br />
GST<br />
(ANewTaxSystem)<br />
2.5%<br />
Food (includingCycloneLarry)<br />
0.8%<br />
Trade effects<br />
(mineralsboom/terms<strong>of</strong>trade)<br />
1.6%<br />
Food (includingfloods,CycloneYasi)<br />
0.5%<br />
0.6%<br />
O<strong>the</strong>rinflation<br />
observed<br />
projected<br />
Projected<br />
carbon priceimpacts<br />
(2012/13<strong>and</strong>2015/16)<br />
0.1%<br />
2%<br />
1%<br />
0%<br />
1990 1995 2000 2005 2010 2015 2020<br />
Financial Year(endingJune)<br />
Notes: Analysis <strong>of</strong> detailed ABS inflation data identifies <strong>the</strong> major expenditure categories that have driven inflation in each year with inflation <strong>of</strong><br />
3.5% or more since 1991. This identifies five primary contributions to inflation, ranging from 0.5% to 2.5%, with impacts <strong>of</strong> 1.5% or more occurring<br />
every five to seven years over <strong>the</strong> period. <strong>The</strong> analysis also identifies a ‘secondary contribution’ to inflation from increases in petrol prices, <strong>and</strong><br />
includes one <strong>of</strong> <strong>the</strong>se years as an additional comparison, although it was not a primary inflation driver <strong>and</strong> occurred in a year where inflation was<br />
below 3.5%.<br />
In this report <strong>the</strong> term inflation is used to include a one <strong>of</strong>f impact on <strong>the</strong> price level but does not necessarily imply a change in <strong>the</strong> overall rate <strong>of</strong><br />
inflation. <strong>The</strong> findings <strong>of</strong> <strong>the</strong> study suggest <strong>the</strong>re will be no impact on <strong>the</strong> overall rate <strong>of</strong> inflation apart from <strong>the</strong> one <strong>of</strong>f impacts identified in 2012/13<br />
<strong>and</strong> 201516.<br />
Source: Calculated from ABS 2011a, with CSIRO <strong>and</strong> AECOM carbon price impacts, <strong>and</strong> GST impact from Treasury (2001)<br />
<strong>The</strong> impact <strong>of</strong> <strong>the</strong> carbon price on food prices is also smaller than historical variations in food prices, particularly<br />
<strong>the</strong> prices <strong>of</strong> meat, fruit <strong>and</strong> vegetables, which are influenced by wea<strong>the</strong>r events such as floods, storms <strong>and</strong><br />
droughts – as shown in Figure ES 4 below.<br />
Figure ES 4: Historical <strong>and</strong> projected food prices, including carbon price impact, 1985-2015<br />
priceindex (198990=100)<br />
350<br />
300<br />
250<br />
200<br />
150<br />
100<br />
50<br />
0<br />
Food,all<br />
Beef,veal<strong>and</strong>lamb<br />
Fruit<br />
Vegetables<br />
Mealsout<strong>and</strong>takeawayfoods<br />
O<strong>the</strong>rfoodproducts<br />
resturants,take wayfood,<strong>and</strong><br />
o<strong>the</strong>rfoodproducts<br />
track<strong>the</strong>trendforallfood<br />
vegetablepricesrangebetween<br />
10%above<strong>and</strong>20%below<strong>the</strong>trend<br />
forallfoodduetoseasonalvariations<br />
fruitpriceincrease,<br />
CycloneLarry (Mar2006)<br />
meatpriceincreases abovetrend<br />
withstrongexportprices<strong>and</strong>reduced<br />
supplytomarketafterdrought<br />
(rebuildingonfarmstocknumbers)<br />
meatpriceeasing<br />
droughtdestocking<br />
(Sept2006)<br />
fruit<strong>and</strong>vegetable pricesimpacted<br />
byfloods<strong>and</strong>CycloneYasi (Feb2011)<br />
historical<br />
data<br />
meatpricefalls<br />
asrainimproves<br />
cattleweightgain<br />
<strong>and</strong>stocknumbers<br />
(Dec2010)<br />
projections<br />
1985 1990 1995 2000 2005 2010 2015<br />
Source: Calculated from ABS (2011a), Adams (2011), <strong>and</strong> sources for Figure 10 in <strong>the</strong> main report.