The Carbon Price and the Cost of Living - The Climate Institute
The Carbon Price and the Cost of Living - The Climate Institute
The Carbon Price and the Cost of Living - The Climate Institute

Create successful ePaper yourself
Turn your PDF publications into a flip-book with our unique Google optimized e-Paper software.
AECOM<br />
<strong>The</strong> <strong>Carbon</strong> <strong>Price</strong> <strong>and</strong> <strong>the</strong> <strong>Cost</strong> <strong>of</strong> <strong>Living</strong><br />
9 November 2011<br />
11<br />
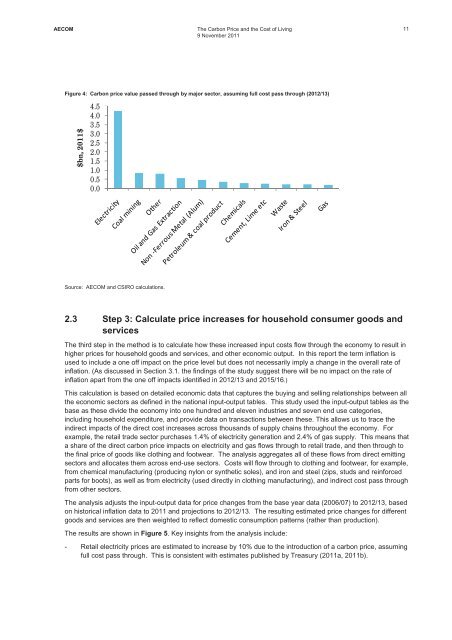
Figure 4: <strong>Carbon</strong> price value passed through by major sector, assuming full cost pass through (2012/13)<br />
$bn,2011$<br />
4.5<br />
4.0<br />
3.5<br />
3.0<br />
2.5<br />
2.0<br />
1.5<br />
1.0<br />
0.5<br />
0.0<br />
Source: AECOM <strong>and</strong> CSIRO calculations.<br />
2.3 Step 3: Calculate price increases for household consumer goods <strong>and</strong><br />
services<br />
<strong>The</strong> third step in <strong>the</strong> method is to calculate how <strong>the</strong>se increased input costs flow through <strong>the</strong> economy to result in<br />
higher prices for household goods <strong>and</strong> services, <strong>and</strong> o<strong>the</strong>r economic output. In this report <strong>the</strong> term inflation is<br />
used to include a one <strong>of</strong>f impact on <strong>the</strong> price level but does not necessarily imply a change in <strong>the</strong> overall rate <strong>of</strong><br />
inflation. (As discussed in Section 3.1. <strong>the</strong> findings <strong>of</strong> <strong>the</strong> study suggest <strong>the</strong>re will be no impact on <strong>the</strong> rate <strong>of</strong><br />
inflation apart from <strong>the</strong> one <strong>of</strong>f impacts identified in 2012/13 <strong>and</strong> 2015/16.)<br />
This calculation is based on detailed economic data that captures <strong>the</strong> buying <strong>and</strong> selling relationships between all<br />
<strong>the</strong> economic sectors as defined in <strong>the</strong> national input-output tables. This study used <strong>the</strong> input-output tables as <strong>the</strong><br />
base as <strong>the</strong>se divide <strong>the</strong> economy into one hundred <strong>and</strong> eleven industries <strong>and</strong> seven end use categories,<br />
including household expenditure, <strong>and</strong> provide data on transactions between <strong>the</strong>se. This allows us to trace <strong>the</strong><br />
indirect impacts <strong>of</strong> <strong>the</strong> direct cost increases across thous<strong>and</strong>s <strong>of</strong> supply chains throughout <strong>the</strong> economy. For<br />
example, <strong>the</strong> retail trade sector purchases 1.4% <strong>of</strong> electricity generation <strong>and</strong> 2.4% <strong>of</strong> gas supply. This means that<br />
a share <strong>of</strong> <strong>the</strong> direct carbon price impacts on electricity <strong>and</strong> gas flows through to retail trade, <strong>and</strong> <strong>the</strong>n through to<br />
<strong>the</strong> final price <strong>of</strong> goods like clothing <strong>and</strong> footwear. <strong>The</strong> analysis aggregates all <strong>of</strong> <strong>the</strong>se flows from direct emitting<br />
sectors <strong>and</strong> allocates <strong>the</strong>m across end-use sectors. <strong>Cost</strong>s will flow through to clothing <strong>and</strong> footwear, for example,<br />
from chemical manufacturing (producing nylon or syn<strong>the</strong>tic soles), <strong>and</strong> iron <strong>and</strong> steel (zips, studs <strong>and</strong> reinforced<br />
parts for boots), as well as from electricity (used directly in clothing manufacturing), <strong>and</strong> indirect cost pass through<br />
from o<strong>the</strong>r sectors.<br />
<strong>The</strong> analysis adjusts <strong>the</strong> input-output data for price changes from <strong>the</strong> base year data (2006/07) to 2012/13, based<br />
on historical inflation data to 2011 <strong>and</strong> projections to 2012/13. <strong>The</strong> resulting estimated price changes for different<br />
goods <strong>and</strong> services are <strong>the</strong>n weighted to reflect domestic consumption patterns (ra<strong>the</strong>r than production).<br />
<strong>The</strong> results are shown in Figure 5. Key insights from <strong>the</strong> analysis include:<br />
- Retail electricity prices are estimated to increase by 10% due to <strong>the</strong> introduction <strong>of</strong> a carbon price, assuming<br />
full cost pass through. This is consistent with estimates published by Treasury (2011a, 2011b).