The Carbon Price and the Cost of Living - The Climate Institute
The Carbon Price and the Cost of Living - The Climate Institute
The Carbon Price and the Cost of Living - The Climate Institute

Create successful ePaper yourself
Turn your PDF publications into a flip-book with our unique Google optimized e-Paper software.
AECOM<br />
<strong>The</strong> <strong>Carbon</strong> <strong>Price</strong> <strong>and</strong> <strong>the</strong> <strong>Cost</strong> <strong>of</strong> <strong>Living</strong><br />
9 November 2011<br />
29<br />
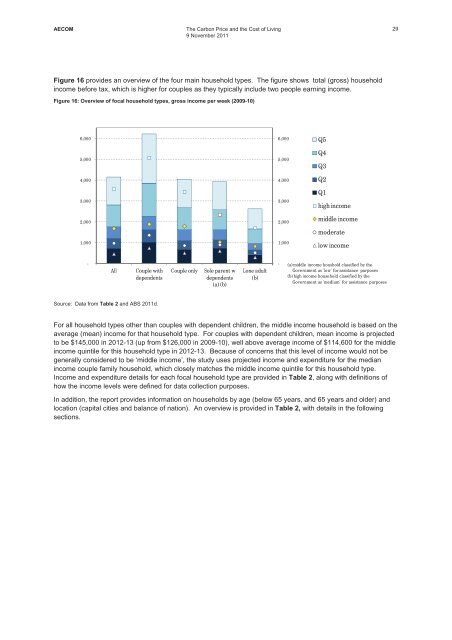
Figure 16 provides an overview <strong>of</strong> <strong>the</strong> four main household types. <strong>The</strong> figure shows total (gross) household<br />
income before tax, which is higher for couples as <strong>the</strong>y typically include two people earning income.<br />
Figure 16: Overview <strong>of</strong> focal household types, gross income per week (2009-10)<br />
6,000<br />
5,000<br />
4,000<br />
3,000<br />
2,000<br />
1,000<br />
6,000<br />
5,000<br />
4,000<br />
3,000<br />
2,000<br />
1,000<br />
Q5<br />
Q4<br />
Q3<br />
Q2<br />
Q1<br />
highincome<br />
middleincome<br />
moderate<br />
lowincome<br />
<br />
All<br />
Couplewith<br />
dependents<br />
Coupleonly<br />
Soleparentw Loneadult<br />
dependents (b)<br />
(a)(b)<br />
<br />
(a)middleincomehousholdclassifiedby<strong>the</strong><br />
Governmentas 'low' forassistance purposes<br />
(b)highincomehouseholdclassifiedby<strong>the</strong><br />
Governmentas'medium'forassistancepurposes<br />
Source: Data from Table 2 <strong>and</strong> ABS 2011d.<br />
For all household types o<strong>the</strong>r than couples with dependent children, <strong>the</strong> middle income household is based on <strong>the</strong><br />
average (mean) income for that household type. For couples with dependent children, mean income is projected<br />
to be $145,000 in 2012-13 (up from $126,000 in 2009-10), well above average income <strong>of</strong> $114,600 for <strong>the</strong> middle<br />
income quintile for this household type in 2012-13. Because <strong>of</strong> concerns that this level <strong>of</strong> income would not be<br />
generally considered to be ‘middle income’, <strong>the</strong> study uses projected income <strong>and</strong> expenditure for <strong>the</strong> median<br />
income couple family household, which closely matches <strong>the</strong> middle income quintile for this household type.<br />
Income <strong>and</strong> expenditure details for each focal household type are provided in Table 2, along with definitions <strong>of</strong><br />
how <strong>the</strong> income levels were defined for data collection purposes.<br />
In addition, <strong>the</strong> report provides information on households by age (below 65 years, <strong>and</strong> 65 years <strong>and</strong> older) <strong>and</strong><br />
location (capital cities <strong>and</strong> balance <strong>of</strong> nation). An overview is provided in Table 2, with details in <strong>the</strong> following<br />
sections.