The Carbon Price and the Cost of Living - The Climate Institute
The Carbon Price and the Cost of Living - The Climate Institute
The Carbon Price and the Cost of Living - The Climate Institute

Create successful ePaper yourself
Turn your PDF publications into a flip-book with our unique Google optimized e-Paper software.
AECOM<br />
<strong>The</strong> <strong>Carbon</strong> <strong>Price</strong> <strong>and</strong> <strong>the</strong> <strong>Cost</strong> <strong>of</strong> <strong>Living</strong><br />
9 November 2011<br />
25<br />
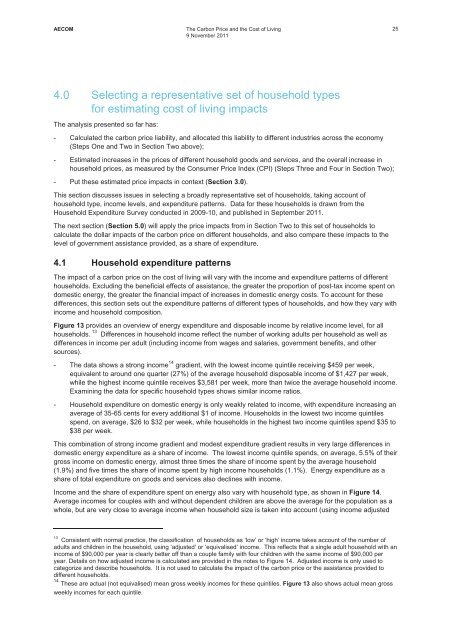
4.0 Selecting a representative set <strong>of</strong> household types<br />
for estimating cost <strong>of</strong> living impacts<br />
<strong>The</strong> analysis presented so far has:<br />
- Calculated <strong>the</strong> carbon price liability, <strong>and</strong> allocated this liability to different industries across <strong>the</strong> economy<br />
(Steps One <strong>and</strong> Two in Section Two above);<br />
- Estimated increases in <strong>the</strong> prices <strong>of</strong> different household goods <strong>and</strong> services, <strong>and</strong> <strong>the</strong> overall increase in<br />
household prices, as measured by <strong>the</strong> Consumer <strong>Price</strong> Index (CPI) (Steps Three <strong>and</strong> Four in Section Two);<br />
- Put <strong>the</strong>se estimated price impacts in context (Section 3.0).<br />
This section discusses issues in selecting a broadly representative set <strong>of</strong> households, taking account <strong>of</strong><br />
household type, income levels, <strong>and</strong> expenditure patterns. Data for <strong>the</strong>se households is drawn from <strong>the</strong><br />
Household Expenditure Survey conducted in 2009-10, <strong>and</strong> published in September 2011.<br />
<strong>The</strong> next section (Section 5.0) will apply <strong>the</strong> price impacts from in Section Two to this set <strong>of</strong> households to<br />
calculate <strong>the</strong> dollar impacts <strong>of</strong> <strong>the</strong> carbon price on different households, <strong>and</strong> also compare <strong>the</strong>se impacts to <strong>the</strong><br />
level <strong>of</strong> government assistance provided, as a share <strong>of</strong> expenditure.<br />
4.1 Household expenditure patterns<br />
<strong>The</strong> impact <strong>of</strong> a carbon price on <strong>the</strong> cost <strong>of</strong> living will vary with <strong>the</strong> income <strong>and</strong> expenditure patterns <strong>of</strong> different<br />
households. Excluding <strong>the</strong> beneficial effects <strong>of</strong> assistance, <strong>the</strong> greater <strong>the</strong> proportion <strong>of</strong> post-tax income spent on<br />
domestic energy, <strong>the</strong> greater <strong>the</strong> financial impact <strong>of</strong> increases in domestic energy costs. To account for <strong>the</strong>se<br />
differences, this section sets out <strong>the</strong> expenditure patterns <strong>of</strong> different types <strong>of</strong> households, <strong>and</strong> how <strong>the</strong>y vary with<br />
income <strong>and</strong> household composition.<br />
Figure 13 provides an overview <strong>of</strong> energy expenditure <strong>and</strong> disposable income by relative income level, for all<br />
households. 13 Differences in household income reflect <strong>the</strong> number <strong>of</strong> working adults per household as well as<br />
differences in income per adult (including income from wages <strong>and</strong> salaries, government benefits, <strong>and</strong> o<strong>the</strong>r<br />
sources).<br />
- <strong>The</strong> data shows a strong income 14 gradient, with <strong>the</strong> lowest income quintile receiving $459 per week,<br />
equivalent to around one quarter (27%) <strong>of</strong> <strong>the</strong> average household disposable income <strong>of</strong> $1,427 per week,<br />
while <strong>the</strong> highest income quintile receives $3,581 per week, more than twice <strong>the</strong> average household income.<br />
Examining <strong>the</strong> data for specific household types shows similar income ratios.<br />
- Household expenditure on domestic energy is only weakly related to income, with expenditure increasing an<br />
average <strong>of</strong> 35-65 cents for every additional $1 <strong>of</strong> income. Households in <strong>the</strong> lowest two income quintiles<br />
spend, on average, $26 to $32 per week, while households in <strong>the</strong> highest two income quintiles spend $35 to<br />
$38 per week.<br />
This combination <strong>of</strong> strong income gradient <strong>and</strong> modest expenditure gradient results in very large differences in<br />
domestic energy expenditure as a share <strong>of</strong> income. <strong>The</strong> lowest income quintile spends, on average, 5.5% <strong>of</strong> <strong>the</strong>ir<br />
gross income on domestic energy, almost three times <strong>the</strong> share <strong>of</strong> income spent by <strong>the</strong> average household<br />
(1.9%) <strong>and</strong> five times <strong>the</strong> share <strong>of</strong> income spent by high income households (1.1%). Energy expenditure as a<br />
share <strong>of</strong> total expenditure on goods <strong>and</strong> services also declines with income.<br />
Income <strong>and</strong> <strong>the</strong> share <strong>of</strong> expenditure spent on energy also vary with household type, as shown in Figure 14.<br />
Average incomes for couples with <strong>and</strong> without dependent children are above <strong>the</strong> average for <strong>the</strong> population as a<br />
whole, but are very close to average income when household size is taken into account (using income adjusted<br />
13<br />
Consistent with normal practice, <strong>the</strong> classification <strong>of</strong> households as ‘low’ or ‘high’ income takes account <strong>of</strong> <strong>the</strong> number <strong>of</strong><br />
adults <strong>and</strong> children in <strong>the</strong> household, using ‘adjusted’ or ‘equivalised’ income. This reflects that a single adult household with an<br />
income <strong>of</strong> $90,000 per year is clearly better <strong>of</strong>f than a couple family with four children with <strong>the</strong> same income <strong>of</strong> $90,000 per<br />
year. Details on how adjusted income is calculated are provided in <strong>the</strong> notes to Figure 14. Adjusted income is only used to<br />
categorize <strong>and</strong> describe households. It is not used to calculate <strong>the</strong> impact <strong>of</strong> <strong>the</strong> carbon price or <strong>the</strong> assistance provided to<br />
different households.<br />
14 <strong>The</strong>se are actual (not equivalised) mean gross weekly incomes for <strong>the</strong>se quintiles. Figure 13 also shows actual mean gross<br />
weekly incomes for each quintile.