The Carbon Price and the Cost of Living - The Climate Institute
The Carbon Price and the Cost of Living - The Climate Institute
The Carbon Price and the Cost of Living - The Climate Institute

Create successful ePaper yourself
Turn your PDF publications into a flip-book with our unique Google optimized e-Paper software.
AECOM<br />
<strong>The</strong> <strong>Carbon</strong> <strong>Price</strong> <strong>and</strong> <strong>the</strong> <strong>Cost</strong> <strong>of</strong> <strong>Living</strong><br />
9 November 2011<br />
17<br />
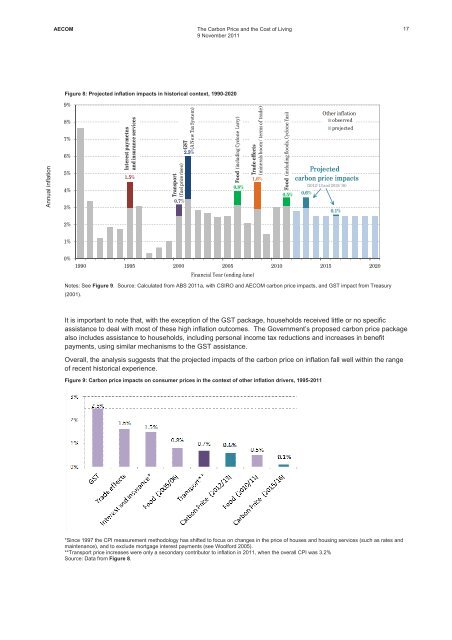
Figure 8: Projected inflation impacts in historical context, 1990-2020<br />
Annual inflation<br />
9%<br />
8%<br />
7%<br />
6%<br />
5%<br />
4%<br />
3%<br />
Interestpaymetns<br />
<strong>and</strong>insuranceservices<br />
1.5%<br />
Transport<br />
(fuelpricerises)<br />
0.7%<br />
GST<br />
(ANewTaxSystem)<br />
2.5%<br />
Food (includingCycloneLarry)<br />
0.8%<br />
Trade effects<br />
(mineralsboom/terms<strong>of</strong>trade)<br />
1.6%<br />
Food (includingfloods,CycloneYasi)<br />
0.5%<br />
0.6%<br />
O<strong>the</strong>rinflation<br />
observed<br />
projected<br />
Projected<br />
carbon priceimpacts<br />
(2012/13<strong>and</strong>2015/16)<br />
0.1%<br />
2%<br />
1%<br />
0%<br />
1990 1995 2000 2005 2010 2015 2020<br />
Financial Year(endingJune)<br />
Notes: See Figure 9. Source: Calculated from ABS 2011a, with CSIRO <strong>and</strong> AECOM carbon price impacts, <strong>and</strong> GST impact from Treasury<br />
(2001).<br />
It is important to note that, with <strong>the</strong> exception <strong>of</strong> <strong>the</strong> GST package, households received little or no specific<br />
assistance to deal with most <strong>of</strong> <strong>the</strong>se high inflation outcomes. <strong>The</strong> Government’s proposed carbon price package<br />
also includes assistance to households, including personal income tax reductions <strong>and</strong> increases in benefit<br />
payments, using similar mechanisms to <strong>the</strong> GST assistance.<br />
Overall, <strong>the</strong> analysis suggests that <strong>the</strong> projected impacts <strong>of</strong> <strong>the</strong> carbon price on inflation fall well within <strong>the</strong> range<br />
<strong>of</strong> recent historical experience.<br />
Figure 9: <strong>Carbon</strong> price impacts on consumer prices in <strong>the</strong> context <strong>of</strong> o<strong>the</strong>r inflation drivers, 1995-2011<br />
*Since 1997 <strong>the</strong> CPI measurement methodology has shifted to focus on changes in <strong>the</strong> price <strong>of</strong> houses <strong>and</strong> housing services (such as rates <strong>and</strong><br />
maintenance), <strong>and</strong> to exclude mortgage interest payments (see Woolford 2005).<br />
**Transport price increases were only a secondary contributor to inflation in 2011, when <strong>the</strong> overall CPI was 3.2%<br />
Source: Data from Figure 8.