The Carbon Price and the Cost of Living - The Climate Institute
The Carbon Price and the Cost of Living - The Climate Institute
The Carbon Price and the Cost of Living - The Climate Institute

You also want an ePaper? Increase the reach of your titles
YUMPU automatically turns print PDFs into web optimized ePapers that Google loves.
AECOM<br />
<strong>The</strong> <strong>Carbon</strong> <strong>Price</strong> <strong>and</strong> <strong>the</strong> <strong>Cost</strong> <strong>of</strong> <strong>Living</strong><br />
9 November 2011<br />
19<br />
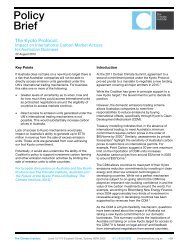
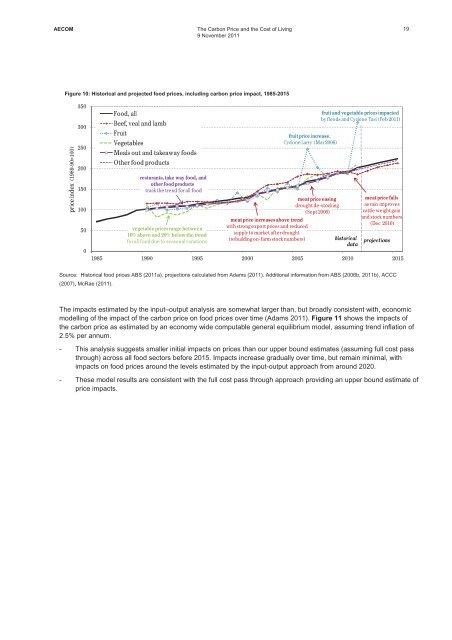
Figure 10: Historical <strong>and</strong> projected food prices, including carbon price impact, 1985-2015<br />
priceindex (198990=100)<br />
350<br />
300<br />
250<br />
200<br />
150<br />
100<br />
50<br />
0<br />
Food,all<br />
Beef,veal<strong>and</strong>lamb<br />
Fruit<br />
Vegetables<br />
Mealsout<strong>and</strong>takeawayfoods<br />
O<strong>the</strong>rfoodproducts<br />
resturants,take wayfood,<strong>and</strong><br />
o<strong>the</strong>rfoodproducts<br />
track<strong>the</strong>trendforallfood<br />
vegetablepricesrangebetween<br />
10%above<strong>and</strong>20%below<strong>the</strong>trend<br />
forallfoodduetoseasonalvariations<br />
fruitpriceincrease,<br />
CycloneLarry (Mar2006)<br />
meatpriceincreasesabovetrend<br />
withstrongexportprices<strong>and</strong>reduced<br />
supplytomarketafterdrought<br />
(rebuilding onfarmstocknumbers)<br />
meatpriceeasing<br />
droughtdestocking<br />
(Sept2006)<br />
fruit<strong>and</strong>vegetable pricesimpacted<br />
byfloods<strong>and</strong>CycloneYasi (Feb2011)<br />
historical<br />
data<br />
meatpricefalls<br />
asrainimproves<br />
cattleweightgain<br />
<strong>and</strong>stocknumbers<br />
(Dec2010)<br />
projections<br />
1985 1990 1995 2000 2005 2010 2015<br />
Source: Historical food prices ABS (2011a), projections calculated from Adams (2011). Additional information from ABS (2006b, 2011b), ACCC<br />
(2007), McRae (2011).<br />
<strong>The</strong> impacts estimated by <strong>the</strong> input–output analysis are somewhat larger than, but broadly consistent with, economic<br />
modelling <strong>of</strong> <strong>the</strong> impact <strong>of</strong> <strong>the</strong> carbon price on food prices over time (Adams 2011). Figure 11 shows <strong>the</strong> impacts <strong>of</strong><br />
<strong>the</strong> carbon price as estimated by an economy wide computable general equilibrium model, assuming trend inflation <strong>of</strong><br />
2.5% per annum.<br />
- This analysis suggests smaller initial impacts on prices than our upper bound estimates (assuming full cost pass<br />
through) across all food sectors before 2015. Impacts increase gradually over time, but remain minimal, with<br />
impacts on food prices around <strong>the</strong> levels estimated by <strong>the</strong> input-output approach from around 2020.<br />
- <strong>The</strong>se model results are consistent with <strong>the</strong> full cost pass through approach providing an upper bound estimate <strong>of</strong><br />
price impacts.