The Carbon Price and the Cost of Living - The Climate Institute
The Carbon Price and the Cost of Living - The Climate Institute
The Carbon Price and the Cost of Living - The Climate Institute

You also want an ePaper? Increase the reach of your titles
YUMPU automatically turns print PDFs into web optimized ePapers that Google loves.
AECOM<br />
<strong>The</strong> <strong>Carbon</strong> <strong>Price</strong> <strong>and</strong> <strong>the</strong> <strong>Cost</strong> <strong>of</strong> <strong>Living</strong><br />
9 November 2011<br />
21<br />
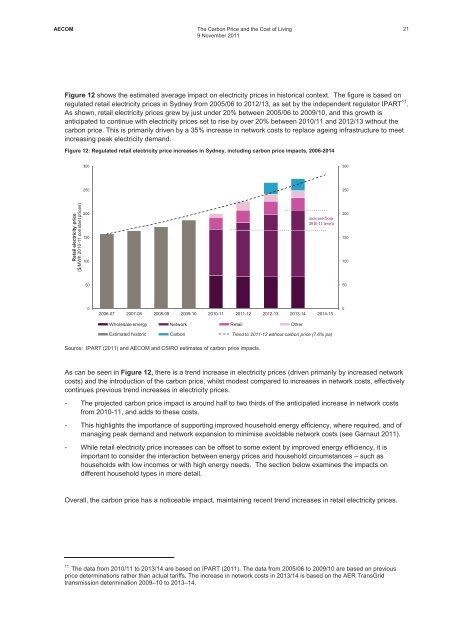
Figure 12 shows <strong>the</strong> estimated average impact on electricity prices in historical context. <strong>The</strong> figure is based on<br />
regulated retail electricity prices in Sydney from 2005/06 to 2012/13, as set by <strong>the</strong> independent regulator IPART 11 .<br />
As shown, retail electricity prices grew by just under 20% between 2005/06 to 2009/10, <strong>and</strong> this growth is<br />
anticipated to continue with electricity prices set to rise by over 20% between 2010/11 <strong>and</strong> 2012/13 without <strong>the</strong><br />
carbon price. This is primarily driven by a 35% increase in network costs to replace ageing infrastructure to meet<br />
increasing peak electricity dem<strong>and</strong>.<br />
Figure 12: Regulated retail electricity price increases in Sydney, including carbon price impacts, 2006-2014<br />
300<br />
300<br />
250<br />
250<br />
Retail electricity price<br />
($/MWh 2010-11 constant prices)<br />
200<br />
150<br />
100<br />
increasefrom<br />
201011levels<br />
200<br />
150<br />
100<br />
50<br />
50<br />
0<br />
2006-07 2007-08 2008-09 2009-10 2010-11 2011-12 2012-13 2013-14 2014-15<br />
0<br />
Wholesale energy Network Retail O<strong>the</strong>r<br />
Estimated historic <strong>Carbon</strong> Trend to2014-15<br />
2011-12 without carbon price (7.6% pa)<br />
Source: IPART (2011) <strong>and</strong> AECOM <strong>and</strong> CSIRO estimates <strong>of</strong> carbon price impacts.<br />
As can be seen in Figure 12, <strong>the</strong>re is a trend increase in electricity prices (driven primarily by increased network<br />
costs) <strong>and</strong> <strong>the</strong> introduction <strong>of</strong> <strong>the</strong> carbon price, whilst modest compared to increases in network costs, effectively<br />
continues previous trend increases in electricity prices.<br />
- <strong>The</strong> projected carbon price impact is around half to two thirds <strong>of</strong> <strong>the</strong> anticipated increase in network costs<br />
from 2010-11, <strong>and</strong> adds to <strong>the</strong>se costs.<br />
- This highlights <strong>the</strong> importance <strong>of</strong> supporting improved household energy efficiency, where required, <strong>and</strong> <strong>of</strong><br />
managing peak dem<strong>and</strong> <strong>and</strong> network expansion to minimise avoidable network costs (see Garnaut 2011).<br />
- While retail electricity price increases can be <strong>of</strong>fset to some extent by improved energy efficiency, it is<br />
important to consider <strong>the</strong> interaction between energy prices <strong>and</strong> household circumstances – such as<br />
households with low incomes or with high energy needs. <strong>The</strong> section below examines <strong>the</strong> impacts on<br />
different household types in more detail.<br />
Overall, <strong>the</strong> carbon price has a noticeable impact, maintaining recent trend increases in retail electricity prices.<br />
11<br />
<strong>The</strong> data from 2010/11 to 2013/14 are based on IPART (2011). <strong>The</strong> data from 2005/06 to 2009/10 are based on previous<br />
price determinations ra<strong>the</strong>r than actual tariffs. <strong>The</strong> increase in network costs in 2013/14 is based on <strong>the</strong> AER TransGrid<br />
transmission determination 2009–10 to 2013–14.