The Carbon Price and the Cost of Living - The Climate Institute
The Carbon Price and the Cost of Living - The Climate Institute
The Carbon Price and the Cost of Living - The Climate Institute

You also want an ePaper? Increase the reach of your titles
YUMPU automatically turns print PDFs into web optimized ePapers that Google loves.
AECOM<br />
<strong>The</strong> <strong>Carbon</strong> <strong>Price</strong> <strong>and</strong> <strong>the</strong> <strong>Cost</strong> <strong>of</strong> <strong>Living</strong><br />
9 November 2011<br />
27<br />
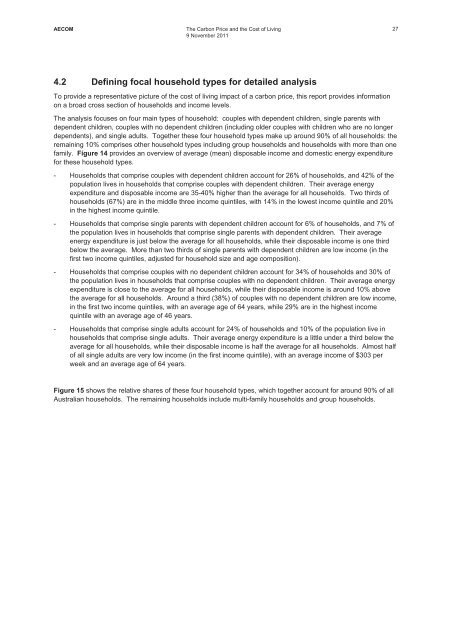
4.2 Defining focal household types for detailed analysis<br />
To provide a representative picture <strong>of</strong> <strong>the</strong> cost <strong>of</strong> living impact <strong>of</strong> a carbon price, this report provides information<br />
on a broad cross section <strong>of</strong> households <strong>and</strong> income levels.<br />
<strong>The</strong> analysis focuses on four main types <strong>of</strong> household: couples with dependent children, single parents with<br />
dependent children, couples with no dependent children (including older couples with children who are no longer<br />
dependents), <strong>and</strong> single adults. Toge<strong>the</strong>r <strong>the</strong>se four household types make up around 90% <strong>of</strong> all households: <strong>the</strong><br />
remaining 10% comprises o<strong>the</strong>r household types including group households <strong>and</strong> households with more than one<br />
family. Figure 14 provides an overview <strong>of</strong> average (mean) disposable income <strong>and</strong> domestic energy expenditure<br />
for <strong>the</strong>se household types.<br />
- Households that comprise couples with dependent children account for 26% <strong>of</strong> households, <strong>and</strong> 42% <strong>of</strong> <strong>the</strong><br />
population lives in households that comprise couples with dependent children. <strong>The</strong>ir average energy<br />
expenditure <strong>and</strong> disposable income are 35-40% higher than <strong>the</strong> average for all households. Two thirds <strong>of</strong><br />
households (67%) are in <strong>the</strong> middle three income quintiles, with 14% in <strong>the</strong> lowest income quintile <strong>and</strong> 20%<br />
in <strong>the</strong> highest income quintile.<br />
- Households that comprise single parents with dependent children account for 6% <strong>of</strong> households, <strong>and</strong> 7% <strong>of</strong><br />
<strong>the</strong> population lives in households that comprise single parents with dependent children. <strong>The</strong>ir average<br />
energy expenditure is just below <strong>the</strong> average for all households, while <strong>the</strong>ir disposable income is one third<br />
below <strong>the</strong> average. More than two thirds <strong>of</strong> single parents with dependent children are low income (in <strong>the</strong><br />
first two income quintiles, adjusted for household size <strong>and</strong> age composition).<br />
- Households that comprise couples with no dependent children account for 34% <strong>of</strong> households <strong>and</strong> 30% <strong>of</strong><br />
<strong>the</strong> population lives in households that comprise couples with no dependent children. <strong>The</strong>ir average energy<br />
expenditure is close to <strong>the</strong> average for all households, while <strong>the</strong>ir disposable income is around 10% above<br />
<strong>the</strong> average for all households. Around a third (38%) <strong>of</strong> couples with no dependent children are low income,<br />
in <strong>the</strong> first two income quintiles, with an average age <strong>of</strong> 64 years, while 29% are in <strong>the</strong> highest income<br />
quintile with an average age <strong>of</strong> 46 years.<br />
- Households that comprise single adults account for 24% <strong>of</strong> households <strong>and</strong> 10% <strong>of</strong> <strong>the</strong> population live in<br />
households that comprise single adults. <strong>The</strong>ir average energy expenditure is a little under a third below <strong>the</strong><br />
average for all households, while <strong>the</strong>ir disposable income is half <strong>the</strong> average for all households. Almost half<br />
<strong>of</strong> all single adults are very low income (in <strong>the</strong> first income quintile), with an average income <strong>of</strong> $303 per<br />
week <strong>and</strong> an average age <strong>of</strong> 64 years.<br />
Figure 15 shows <strong>the</strong> relative shares <strong>of</strong> <strong>the</strong>se four household types, which toge<strong>the</strong>r account for around 90% <strong>of</strong> all<br />
Australian households. <strong>The</strong> remaining households include multi-family households <strong>and</strong> group households.