Gender Statistcics - Government of Himachal Pradesh
Gender Statistcics - Government of Himachal Pradesh
Gender Statistcics - Government of Himachal Pradesh

Create successful ePaper yourself
Turn your PDF publications into a flip-book with our unique Google optimized e-Paper software.
<strong>Gender</strong> Statistics 102<br />
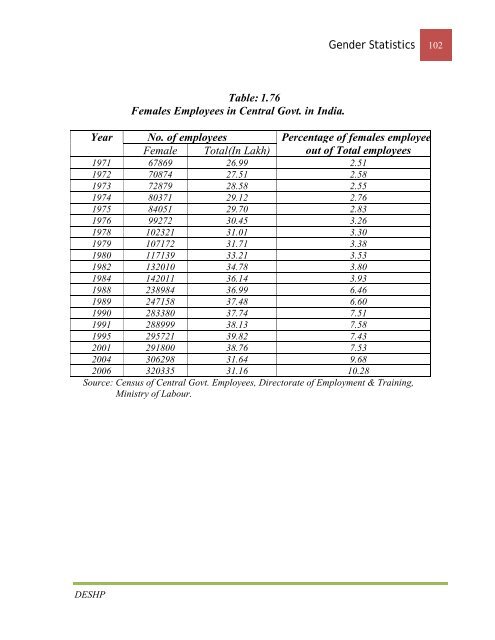
Table: 1.76<br />
Females Employees in Central Govt. in India.<br />
Year No. <strong>of</strong> employees Percentage <strong>of</strong> females employee<br />
Female Total(In Lakh) out <strong>of</strong> Total employees<br />
1971 67869 26.99 2.51<br />
1972 70874 27.51 2.58<br />
1973 72879 28.58 2.55<br />
1974 80371 29.12 2.76<br />
1975 84051 29.70 2.83<br />
1976 99272 30.45 3.26<br />
1978 102321 31.01 3.30<br />
1979 107172 31.71 3.38<br />
1980 117139 33.21 3.53<br />
1982 132010 34.78 3.80<br />
1984 142011 36.14 3.93<br />
1988 238984 36.99 6.46<br />
1989 247158 37.48 6.60<br />
1990 283380 37.74 7.51<br />
1991 288999 38.13 7.58<br />
1995 295721 39.82 7.43<br />
2001 291800 38.76 7.53<br />
2004 306298 31.64 9.68<br />
2006 320335 31.16 10.28<br />
Source: Census <strong>of</strong> Central Govt. Employees, Directorate <strong>of</strong> Employment & Training,<br />
Ministry <strong>of</strong> Labour.<br />
DESHP