Gender Statistcics - Government of Himachal Pradesh
Gender Statistcics - Government of Himachal Pradesh
Gender Statistcics - Government of Himachal Pradesh

You also want an ePaper? Increase the reach of your titles
YUMPU automatically turns print PDFs into web optimized ePapers that Google loves.
<strong>Gender</strong> Statistics 82<br />
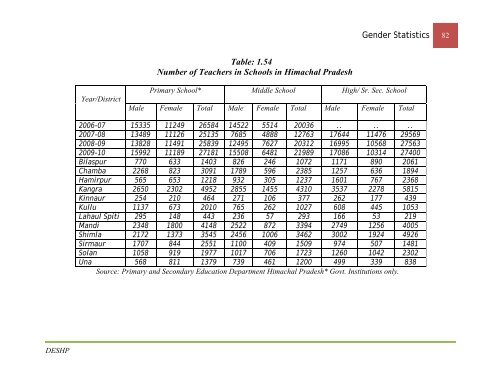
Table: 1.54<br />
Number <strong>of</strong> Teachers in Schools in <strong>Himachal</strong> <strong>Pradesh</strong><br />
Year/District<br />
Primary School* Middle School High/ Sr. Sec. School<br />
Male Female Total Male Female Total Male Female Total<br />
2006-07 15335 11249 26584 14522 5514 20036 .. .. ..<br />
2007-08 13489 11126 25135 7685 4888 12763 17644 11476 29569<br />
2008-09 13828 11491 25839 12495 7627 20312 16995 10568 27563<br />
2009-10 15992 11189 27181 15508 6481 21989 17086 10314 27400<br />
Bilaspur 770 633 1403 826 246 1072 1171 890 2061<br />
Chamba 2268 823 3091 1789 596 2385 1257 636 1894<br />
Hamirpur 565 653 1218 932 305 1237 1601 767 2368<br />
Kangra 2650 2302 4952 2855 1455 4310 3537 2278 5815<br />
Kinnaur 254 210 464 271 106 377 262 177 439<br />
Kullu 1137 673 2010 765 262 1027 608 445 1053<br />
Lahaul Spiti 295 148 443 236 57 293 166 53 219<br />
Mandi 2348 1800 4148 2522 872 3394 2749 1256 4005<br />
Shimla 2172 1373 3545 2456 1006 3462 3002 1924 4926<br />
Sirmaur 1707 844 2551 1100 409 1509 974 507 1481<br />
Solan 1058 919 1977 1017 706 1723 1260 1042 2302<br />
Una 568 811 1379 739 461 1200 499 339 838<br />
Source: Primary and Secondary Education Department <strong>Himachal</strong> <strong>Pradesh</strong>* Govt. Institutions only.<br />
DESHP