Gender Statistcics - Government of Himachal Pradesh
Gender Statistcics - Government of Himachal Pradesh
Gender Statistcics - Government of Himachal Pradesh

You also want an ePaper? Increase the reach of your titles
YUMPU automatically turns print PDFs into web optimized ePapers that Google loves.
<strong>Gender</strong> Statistics 55<br />
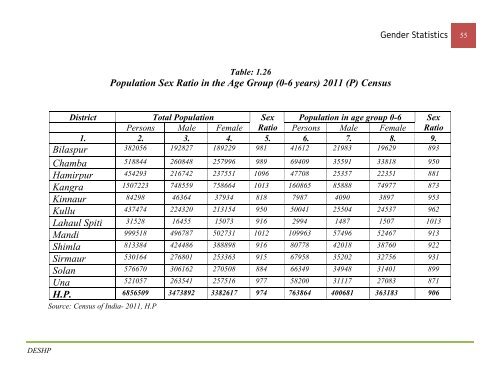
Table: 1.26<br />
Population Sex Ratio in the Age Group (0-6 years) 2011 (P) Census<br />
District Total Population Sex Population in age group 0-6<br />
Persons Male Female Ratio Persons Male Female<br />
H.P. 6856509 3473892 3382617 974 763864 400681 363183 906<br />
Source: Census <strong>of</strong> India- 2011, H.P<br />
Sex<br />
Ratio<br />
1. 2. 3. 4. 5. 6. 7. 8. 9.<br />
Bilaspur 382056 192827 189229 981 41612 21983 19629 893<br />
Chamba 518844 260848 257996 989 69409 35591 33818 950<br />
Hamirpur 454293 216742 237551 1096 47708 25357 22351 881<br />
Kangra 1507223 748559 758664 1013 160865 85888 74977 873<br />
Kinnaur 84298 46364 37934 818 7987 4090 3897 953<br />
Kullu 437474 224320 213154 950 50041 25504 24537 962<br />
Lahaul Spiti 31528 16455 15073 916 2994 1487 1507 1013<br />
Mandi 999518 496787 502731 1012 109963 57496 52467 913<br />
Shimla 813384 424486 388898 916 80778 42018 38760 922<br />
Sirmaur 530164 276801 253363 915 67958 35202 32756 931<br />
Solan 576670 306162 270508 884 66349 34948 31401 899<br />
Una 521057 263541 257516 977 58200 31117 27083 871<br />
DESHP