Gender Statistcics - Government of Himachal Pradesh
Gender Statistcics - Government of Himachal Pradesh
Gender Statistcics - Government of Himachal Pradesh

You also want an ePaper? Increase the reach of your titles
YUMPU automatically turns print PDFs into web optimized ePapers that Google loves.
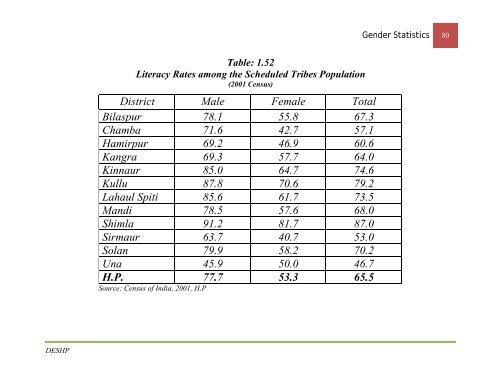
<strong>Gender</strong> Statistics 80<br />
Table: 1.52<br />
Literacy Rates among the Scheduled Tribes Population<br />
(2001 Census)<br />
District Male Female Total<br />
Bilaspur 78.1 55.8 67.3<br />
Chamba 71.6 42.7 57.1<br />
Hamirpur 69.2 46.9 60.6<br />
Kangra 69.3 57.7 64.0<br />
Kinnaur 85.0 64.7 74.6<br />
Kullu 87.8 70.6 79.2<br />
Lahaul Spiti 85.6 61.7 73.5<br />
Mandi 78.5 57.6 68.0<br />
Shimla 91.2 81.7 87.0<br />
Sirmaur 63.7 40.7 53.0<br />
Solan 79.9 58.2 70.2<br />
Una 45.9 50.0 46.7<br />
H.P. 77.7 53.3 65.5<br />
Source: Census <strong>of</strong> India, 2001, H.P<br />
DESHP