Gender Statistcics - Government of Himachal Pradesh
Gender Statistcics - Government of Himachal Pradesh
Gender Statistcics - Government of Himachal Pradesh

You also want an ePaper? Increase the reach of your titles
YUMPU automatically turns print PDFs into web optimized ePapers that Google loves.
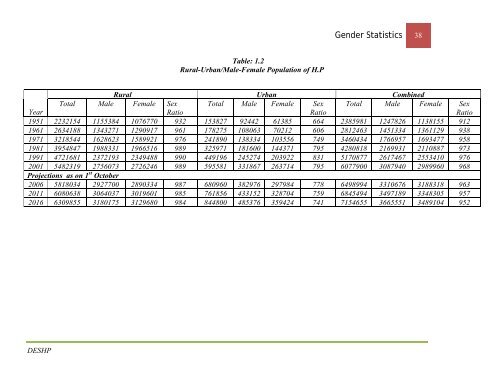
<strong>Gender</strong> Statistics 38<br />
Table: 1.2<br />
Rural-Urban/Male-Female Population <strong>of</strong> H.P<br />
Rural Urban Combined<br />
Total Male Female Sex Total Male Female Sex Total Male Female Sex<br />
Year<br />
Ratio<br />
Ratio<br />
Ratio<br />
1951 2232154 1155384 1076770 932 153827 92442 61385 664 2385981 1247826 1138155 912<br />
1961 2634188 1343271 1290917 961 178275 108063 70212 606 2812463 1451334 1361129 938<br />
1971 3218544 1628623 1589921 976 241890 138334 103556 749 3460434 1766957 1693477 958<br />
1981 3954847 1988331 1966516 989 325971 181600 144371 795 4280818 2169931 2110887 973<br />
1991 4721681 2372193 2349488 990 449196 245274 203922 831 5170877 2617467 2553410 976<br />
2001 5482319 2756073 2726246 989 595581 331867 263714 795 6077900 3087940 2989960 968<br />
Projections as on 1 st October<br />
2006 5818034 2927700 2890334 987 680960 382976 297984 778 6498994 3310676 3188318 963<br />
2011 6080638 3064037 3019601 985 761856 433152 328704 759 6845494 3497189 3348305 957<br />
2016 6309855 3180175 3129680 984 844800 485376 359424 741 7154655 3665551 3489104 952<br />
DESHP