Gender Statistcics - Government of Himachal Pradesh
Gender Statistcics - Government of Himachal Pradesh
Gender Statistcics - Government of Himachal Pradesh

Create successful ePaper yourself
Turn your PDF publications into a flip-book with our unique Google optimized e-Paper software.
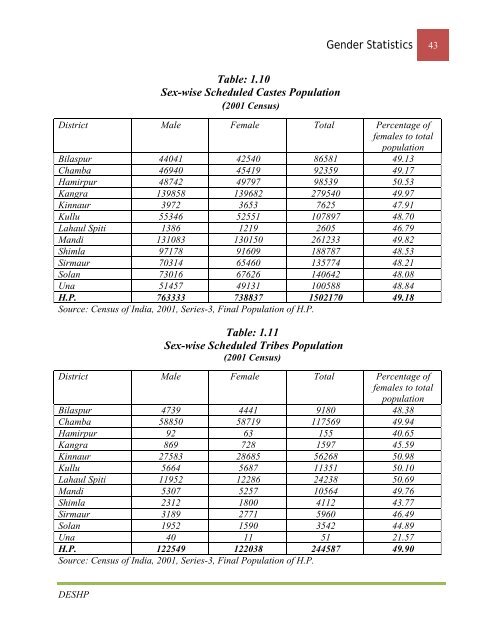
<strong>Gender</strong> Statistics 43<br />
Table: 1.10<br />
Sex-wise Scheduled Castes Population<br />
(2001 Census)<br />
District Male Female Total Percentage <strong>of</strong><br />
females to total<br />
population<br />
Bilaspur 44041 42540 86581 49.13<br />
Chamba 46940 45419 92359 49.17<br />
Hamirpur 48742 49797 98539 50.53<br />
Kangra 139858 139682 279540 49.97<br />
Kinnaur 3972 3653 7625 47.91<br />
Kullu 55346 52551 107897 48.70<br />
Lahaul Spiti 1386 1219 2605 46.79<br />
Mandi 131083 130150 261233 49.82<br />
Shimla 97178 91609 188787 48.53<br />
Sirmaur 70314 65460 135774 48.21<br />
Solan 73016 67626 140642 48.08<br />
Una 51457 49131 100588 48.84<br />
H.P. 763333 738837 1502170 49.18<br />
Source: Census <strong>of</strong> India, 2001, Series-3, Final Population <strong>of</strong> H.P.<br />
Table: 1.11<br />
Sex-wise Scheduled Tribes Population<br />
(2001 Census)<br />
District Male Female Total Percentage <strong>of</strong><br />
females to total<br />
population<br />
Bilaspur 4739 4441 9180 48.38<br />
Chamba 58850 58719 117569 49.94<br />
Hamirpur 92 63 155 40.65<br />
Kangra 869 728 1597 45.59<br />
Kinnaur 27583 28685 56268 50.98<br />
Kullu 5664 5687 11351 50.10<br />
Lahaul Spiti 11952 12286 24238 50.69<br />
Mandi 5307 5257 10564 49.76<br />
Shimla 2312 1800 4112 43.77<br />
Sirmaur 3189 2771 5960 46.49<br />
Solan 1952 1590 3542 44.89<br />
Una 40 11 51 21.57<br />
H.P. 122549 122038 244587 49.90<br />
Source: Census <strong>of</strong> India, 2001, Series-3, Final Population <strong>of</strong> H.P.<br />
DESHP