A study of Patent Thickets (1.31Mb) - UK Intellectual Property Office
A study of Patent Thickets (1.31Mb) - UK Intellectual Property Office
A study of Patent Thickets (1.31Mb) - UK Intellectual Property Office

You also want an ePaper? Increase the reach of your titles
YUMPU automatically turns print PDFs into web optimized ePapers that Google loves.
A Study <strong>of</strong> <strong>Patent</strong> <strong>Thickets</strong> 47<br />
4.2 Exposure <strong>of</strong> <strong>UK</strong> SMEs to patent thickets at<br />
the EPO<br />
In this section we set out a descriptive analysis <strong>of</strong> the technology areas and industry sectors that<br />
<strong>UK</strong> firms are active in. The graphs set out below show that <strong>UK</strong> firms tend not to enter those<br />
technology areas that are most heavily affected by patent thickets.<br />
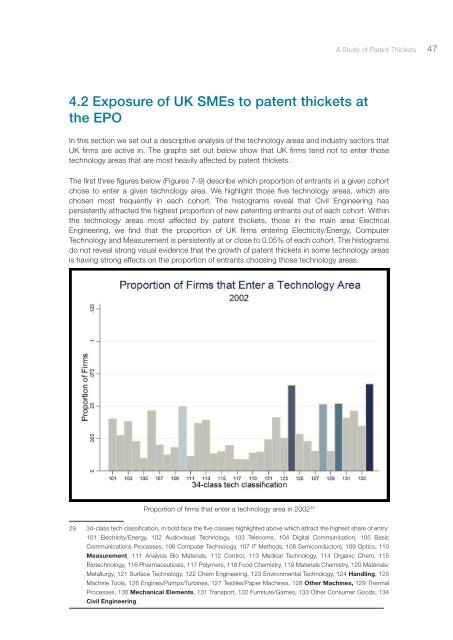
The first three figures below (Figures 7-9) describe which proportion <strong>of</strong> entrants in a given cohort<br />
chose to enter a given technology area. We highlight those five technology areas, which are<br />
chosen most frequently in each cohort. The histograms reveal that Civil Engineering has<br />
persistently attracted the highest proportion <strong>of</strong> new patenting entrants out <strong>of</strong> each cohort. Within<br />
the technology areas most affected by patent thickets, those in the main area Electrical<br />
Engineering, we find that the proportion <strong>of</strong> <strong>UK</strong> firms entering Electricity/Energy, Computer<br />
Technology and Measurement is persistently at or close to 0.05% <strong>of</strong> each cohort. The histograms<br />
do not reveal strong visual evidence that the growth <strong>of</strong> patent thickets in some technology areas<br />
is having strong effects on the proportion <strong>of</strong> entrants choosing those technology areas.<br />
Proportion <strong>of</strong> firms that enter a technology area in 2002 29<br />
29 34-class tech classification, in bold face the five classes highlighted above which attract the highest share <strong>of</strong> entry:<br />
101 Electricity/Energy, 102 Audiovisual Technology, 103 Telecoms, 104 Digital Communication, 105 Basic<br />
Communications Processes, 106 Computer Technology, 107 IT Methods, 108 Semiconductors, 109 Optics, 110<br />
Measurement, 111 Analysis Bio Materials, 112 Control, 113 Medical Technology, 114 Organic Chem, 115<br />
Biotechnology, 116 Pharmaceuticals, 117 Polymers, 118 Food Chemistry, 119 Materials Chemistry, 120 Materials/<br />
Metallurgy, 121 Surface Technology, 122 Chem Engineering, 123 Environmental Technology, 124 Handling, 125<br />
Machine Tools, 126 Engines/Pumps/Turbines, 127 Textiles/Paper Machines, 128 Other Machines, 129 Thermal<br />
Processes, 130 Mechanical Elements, 131 Transport, 132 Furniture/Games, 133 Other Consumer Goods, 134<br />
Civil Engineering.