A natron source at Pikrolimni Lake in Greece? Geochemical evidence
A natron source at Pikrolimni Lake in Greece? Geochemical evidence
A natron source at Pikrolimni Lake in Greece? Geochemical evidence

Create successful ePaper yourself
Turn your PDF publications into a flip-book with our unique Google optimized e-Paper software.
E. Dotsika et al. / Journal of <strong>Geochemical</strong> Explor<strong>at</strong>ion 103 (2009) 133–143<br />
139<br />
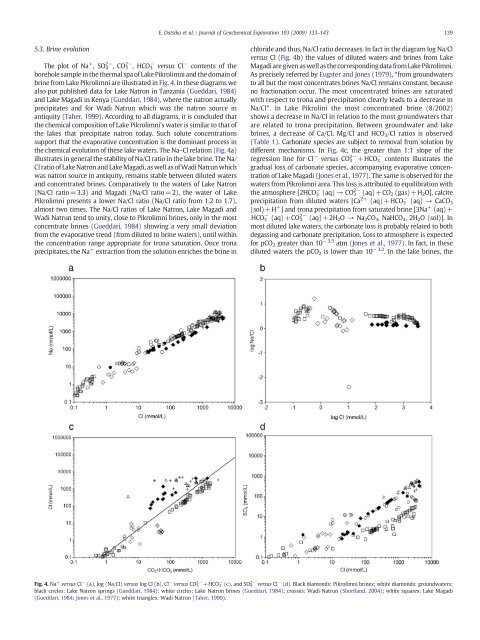
5.3. Br<strong>in</strong>e evolution<br />
The plot of Na + ,SO 4 2− ,CO 3 2− ,HCO 3 − versus Cl − contents of the<br />
borehole sample <strong>in</strong> the thermal spa of <strong>Lake</strong> <strong>Pikrolimni</strong> and the doma<strong>in</strong> of<br />
br<strong>in</strong>e from <strong>Lake</strong> <strong>Pikrolimni</strong> are illustr<strong>at</strong>ed <strong>in</strong> Fig. 4. In these diagrams we<br />
also put published d<strong>at</strong>a for <strong>Lake</strong> N<strong>at</strong>ron <strong>in</strong> Tanzania (Gueddari, 1984)<br />
and <strong>Lake</strong> Magadi <strong>in</strong> Kenya (Gueddari, 1984), where the <strong>n<strong>at</strong>ron</strong> actually<br />
precipit<strong>at</strong>es and for Wadi N<strong>at</strong>run which was the <strong>n<strong>at</strong>ron</strong> <strong>source</strong> <strong>in</strong><br />
antiquity (Taher, 1999). Accord<strong>in</strong>g to all diagrams, it is concluded th<strong>at</strong><br />
the chemical composition of <strong>Lake</strong> <strong>Pikrolimni</strong>'s w<strong>at</strong>er is similar to th<strong>at</strong> of<br />
the lakes th<strong>at</strong> precipit<strong>at</strong>e <strong>n<strong>at</strong>ron</strong> today. Such solute concentr<strong>at</strong>ions<br />
support th<strong>at</strong> the evapor<strong>at</strong>ive concentr<strong>at</strong>ion is the dom<strong>in</strong>ant process <strong>in</strong><br />
the chemical evolution of these lake w<strong>at</strong>ers. The Na–Cl rel<strong>at</strong>ion (Fig. 4a)<br />
illustr<strong>at</strong>es <strong>in</strong> general the stability of Na/Cl r<strong>at</strong>io <strong>in</strong> the lake br<strong>in</strong>e. The Na/<br />
Cl r<strong>at</strong>io of <strong>Lake</strong> N<strong>at</strong>ron and <strong>Lake</strong> Magadi, as well as of Wadi N<strong>at</strong>run which<br />
was <strong>n<strong>at</strong>ron</strong> <strong>source</strong> <strong>in</strong> antiquity, rema<strong>in</strong>s stable between diluted w<strong>at</strong>ers<br />
and concentr<strong>at</strong>ed br<strong>in</strong>es. Compar<strong>at</strong>ively to the w<strong>at</strong>ers of <strong>Lake</strong> N<strong>at</strong>ron<br />
(Na/Cl r<strong>at</strong>io=3.3) and Magadi (Na/Cl r<strong>at</strong>io=2), the w<strong>at</strong>er of <strong>Lake</strong><br />
<strong>Pikrolimni</strong> presents a lower Na/Cl r<strong>at</strong>io (Na/Cl r<strong>at</strong>io from 1.2 to 1.7),<br />
almost two times. The Na/Cl r<strong>at</strong>ios of <strong>Lake</strong> N<strong>at</strong>ron, <strong>Lake</strong> Magadi and<br />
Wadi N<strong>at</strong>run tend to unity, close to <strong>Pikrolimni</strong> br<strong>in</strong>es, only <strong>in</strong> the most<br />
concentr<strong>at</strong>e br<strong>in</strong>es (Gueddari, 1984) show<strong>in</strong>g a very small devi<strong>at</strong>ion<br />
from the evapor<strong>at</strong>ive trend (from diluted to br<strong>in</strong>e w<strong>at</strong>ers), until with<strong>in</strong><br />
the concentr<strong>at</strong>ion range appropri<strong>at</strong>e for trona s<strong>at</strong>ur<strong>at</strong>ion. Once trona<br />
precipit<strong>at</strong>es, the Na + extraction from the solution enriches the br<strong>in</strong>e <strong>in</strong><br />
chloride and thus, Na/Cl r<strong>at</strong>io decreases. In fact <strong>in</strong> the diagram log Na/Cl<br />
versus Cl (Fig. 4b) the values of diluted w<strong>at</strong>ers and br<strong>in</strong>es from <strong>Lake</strong><br />
Magadi are given as well as the correspond<strong>in</strong>g d<strong>at</strong>a from <strong>Lake</strong> <strong>Pikrolimni</strong>.<br />
As precisely referred by Eugster and Jones (1979), “from groundw<strong>at</strong>ers<br />
to all but the most concentr<strong>at</strong>es br<strong>in</strong>es Na/Cl rema<strong>in</strong>s constant, because<br />
no fraction<strong>at</strong>ion occur. The most concentr<strong>at</strong>ed br<strong>in</strong>es are s<strong>at</strong>ur<strong>at</strong>ed<br />
with respect to trona and precipit<strong>at</strong>ion clearly leads to a decrease <strong>in</strong><br />
Na/Cl”. In <strong>Lake</strong> Pikrol<strong>in</strong>i the most concentr<strong>at</strong>ed br<strong>in</strong>e (8/2002)<br />
shows a decrease <strong>in</strong> Na/Cl <strong>in</strong> rel<strong>at</strong>ion to the most groundw<strong>at</strong>ers th<strong>at</strong><br />
are rel<strong>at</strong>ed to trona precipit<strong>at</strong>ion. Between groundw<strong>at</strong>er and lake<br />
br<strong>in</strong>es, a decrease of Ca/Cl, Mg/Cl and HCO 3 /Cl r<strong>at</strong>ios is observed<br />
(Table 1). Carbon<strong>at</strong>e species are subject to removal from solution by<br />
different mechanisms. In Fig. 4c, the gre<strong>at</strong>er than 1:1 slope of the<br />
regression l<strong>in</strong>e for Cl − versus CO 3 2− +HCO 3 − contents illustr<strong>at</strong>es the<br />
gradual loss of carbon<strong>at</strong>e species, accompany<strong>in</strong>g evapor<strong>at</strong>ive concentr<strong>at</strong>ion<br />
of <strong>Lake</strong> Magadi (Jones et al., 1977). The same is observed for the<br />
w<strong>at</strong>ers from <strong>Pikrolimni</strong> area. This loss is <strong>at</strong>tributed to equilibr<strong>at</strong>ion with<br />
the <strong>at</strong>mosphere [2HCO 3 − (aq) → CO 3 2− (aq)+CO 2 (gas)+H 2 O], calcite<br />
precipit<strong>at</strong>ion from diluted w<strong>at</strong>ers [Ca 2+ (aq)+HCO 3 − (aq) → CaCO 3<br />
(sol)+H + ] and trona precipit<strong>at</strong>ion from s<strong>at</strong>ur<strong>at</strong>ed br<strong>in</strong>e [3Na + (aq)+<br />
HCO 3 − (aq)+CO 3 2− (aq)+2H 2 O → Na 2 CO 3 ,NaHCO 3 ,2H 2 O (sol)]. In<br />
most diluted lake w<strong>at</strong>ers, the carbon<strong>at</strong>e loss is probably rel<strong>at</strong>ed to both<br />
degass<strong>in</strong>g and carbon<strong>at</strong>e precipit<strong>at</strong>ion. Loss to <strong>at</strong>mosphere is expected<br />
for pCO 2 gre<strong>at</strong>er than 10 −3.5 <strong>at</strong>m (Jones et al., 1977). In fact, <strong>in</strong> these<br />
diluted w<strong>at</strong>ers the pCO 2 is lower than 10 −3.2 . In the lake br<strong>in</strong>es, the<br />
Fig. 4. Na + versus Cl − (a), log (Na/Cl) versus log Cl (b), Cl − versus CO 3 2− +HCO 3 − (c), and SO 4 2− versus Cl − (d). Black diamonds: <strong>Pikrolimni</strong> br<strong>in</strong>es; white diamonds: groundw<strong>at</strong>ers;<br />
black circles: <strong>Lake</strong> N<strong>at</strong>ron spr<strong>in</strong>gs (Gueddari, 1984); white circles: <strong>Lake</strong> N<strong>at</strong>ron br<strong>in</strong>es (Gueddari, 1984); crosses: Wadi N<strong>at</strong>run (Shortland, 2004); white squares: <strong>Lake</strong> Magadi<br />
(Gueddari, 1984; Jones et al., 1977); white triangles: Wadi N<strong>at</strong>run (Taher, 1999).