here - Atomic Energy Regulatory Board
here - Atomic Energy Regulatory Board
here - Atomic Energy Regulatory Board

You also want an ePaper? Increase the reach of your titles
YUMPU automatically turns print PDFs into web optimized ePapers that Google loves.
water bodies was lost due to human activities during this<br />
period. The specific impacts on water bodies are provided<br />
below:<br />
Due to additional natural vegetation cover<br />
3.09 sq.km (1.33%)<br />
Due to developmental activities 0.68 sq.km<br />
(0.29%)<br />
Due to additional farming 2.95 sq.km<br />
(1.26%)<br />
Due to aquaculture farms 28.56 sq.km<br />
(12.24%)<br />
From the above study it was deduced that t<strong>here</strong> is<br />
no major change in the area under water bodies due to<br />
the commissioning of the MAPS or other developmental<br />
activities in the area since 1972.<br />
9.4.1.2 Development of Decision Making Tools in<br />
GIS Environment for Emergency Response<br />
System for NPPs<br />
A work on decision-making tools for emergency<br />
response system for NPPs was taken up. Under this, a<br />
user-friendly query was built on plume dispersion pattern<br />
using AML (Arc Macro Language) program in GIS<br />
platform.<br />
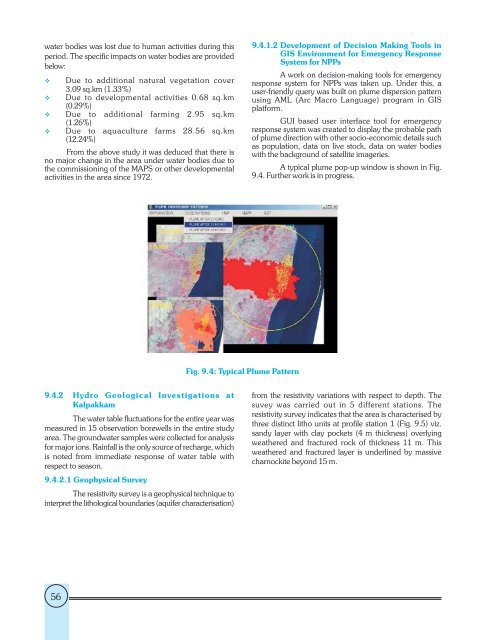
GUI based user interface tool for emergency<br />
response system was created to display the probable path<br />
of plume direction with other socio-economic details such<br />
as population, data on live stock, data on water bodies<br />
with the background of satellite imageries.<br />
A typical plume pop-up window is shown in Fig.<br />
9.4. Further work is in progress.<br />
Fig. 9.4: Typical Plume Pattern<br />
9.4.2 Hydro Geological Investigations at<br />
Kalpakkam<br />
The water table fluctuations for the entire year was<br />
measured in 15 observation borewells in the entire study<br />
area. The groundwater samples were collected for analysis<br />
for major ions. Rainfall is the only source of recharge, which<br />
is noted from immediate response of water table with<br />
respect to season.<br />
9.4.2.1 Geophysical Survey<br />
The resistivity survey is a geophysical technique to<br />
interpret the lithological boundaries (aquifer characterisation)<br />
from the resistivity variations with respect to depth. The<br />
suvey was carried out in 5 different stations. The<br />
resistivity survey indicates that the area is characterised by<br />
three distinct litho units at profile station 1 (Fig. 9.5) viz.<br />
sandy layer with clay pockets (4 m thickness) overlying<br />
weat<strong>here</strong>d and fractured rock of thickness 11 m. This<br />
weat<strong>here</strong>d and fractured layer is underlined by massive<br />
charnockite beyond 15 m.<br />
56