grdc growers' report - Grains Research & Development Corporation
grdc growers' report - Grains Research & Development Corporation
grdc growers' report - Grains Research & Development Corporation

You also want an ePaper? Increase the reach of your titles
YUMPU automatically turns print PDFs into web optimized ePapers that Google loves.
eport from the chair and managing director<br />
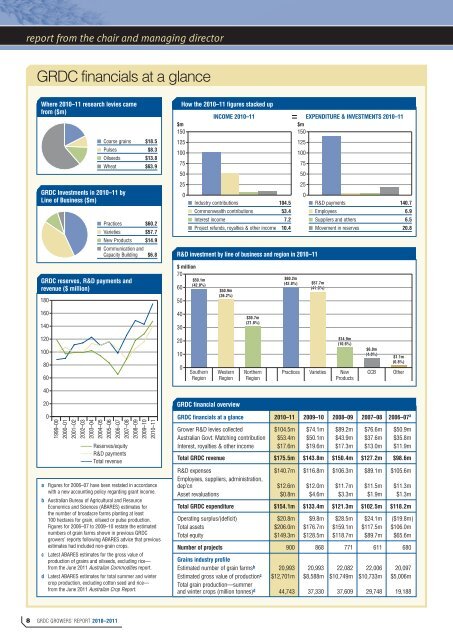
GRDC financials at a glance<br />
Where 2010–11 research levies came<br />
from ($m)<br />
GRDC Investments in 2010–11 by<br />
Line of Business ($m)<br />
■ Coarse grains $18.5<br />
■ Pulses $8.3<br />
■ Oilseeds $13.8<br />
■ Wheat $63.9<br />
■ Practices $60.2<br />
■ Varieties $57.7<br />
■ New Products $14.9<br />
■ Communication and<br />
Capacity Building $6.8<br />
How the 2010–11 figures stacked up<br />
INCOME 2010–11 EXPENDITURE & INVESTMENTS 2010–11<br />
$m $m<br />
150<br />
150<br />
=<br />
125<br />
125<br />
100<br />
100<br />
75<br />
75<br />
50<br />
50<br />
25<br />
25<br />
0<br />
0<br />
■ Industry contributions 104.5 ■ R&D payments 140.7<br />
■ Commonwealth contributions 53.4 ■ Employees 6.9<br />
■ Interest income 7.2 ■ Suppliers and others 6.5<br />
■ Project refunds, royalties & other income 10.4 ■ Movement in reserves 20.8<br />
R&D investment by line of business and region in 2010–11<br />
GRDC reserves, R&D payments and<br />
revenue ($ million)<br />
180<br />
$ million<br />
70<br />
$59.1m<br />
(42.0%)<br />
60<br />
50<br />
$50.9m<br />
(36.2%)<br />
$60.2m<br />
(42.8%) $57.7m<br />
(41.0%)<br />
160<br />
140<br />
40<br />
30<br />
$30.7m<br />
(21.8%)<br />
120<br />
100<br />
80<br />
60<br />
20<br />
10<br />
0<br />
Southern<br />
Region<br />
Western<br />
Region<br />
Northern<br />
Region<br />
$14.9m<br />
(10.6%)<br />
Practices Varieties New<br />
Products<br />
$6.8m<br />
(4.8%)<br />
CCB<br />
$1.1m<br />
(0.8%)<br />
Other<br />
40<br />
20<br />
0<br />
1999–00<br />
2000–01<br />
2001–02<br />
2002–03<br />
2003–04<br />
2004–05<br />
2005–06<br />
2006–07<br />
2007–08<br />
2008–09<br />
2009–10<br />
2010–11<br />
—— Reserves/equity<br />
—— R&D payments<br />
—— Total revenue<br />
a Figures for 2006–07 have been restated in accordance<br />
with a new accounting policy regarding grant income.<br />
b Australian Bureau of Agricultural and Resource<br />
Economics and Sciences (ABARES) estimates for<br />
the number of broadacre farms planting at least<br />
100 hectares for grain, oilseed or pulse production.<br />
Figures for 2006–07 to 2009–10 restate the estimated<br />
numbers of grain farms shown in previous GRDC<br />
growers’ <strong>report</strong>s following ABARES advice that previous<br />
estimates had included non-grain crops.<br />
c Latest ABARES estimates for the gross value of<br />
production of grains and oilseeds, excluding rice—<br />
from the June 2011 Australian Commodities <strong>report</strong>.<br />
d Latest ABARES estimates for total summer and winter<br />
crop production, excluding cotton seed and rice—<br />
from the June 2011 Australian Crop Report.<br />
GRDC financial overview<br />
GRDC financials at a glance 2010–11 2009–10 2008–09 2007–08 2006–07 a<br />
Grower R&D levies collected $104.5m $74.1m $89.2m $76.6m $50.9m<br />
Australian Govt. Matching contribution $53.4m $50.1m $43.9m $37.6m $35.8m<br />
Interest, royalties & other income $17.6m $19.6m $17.3m $13.0m $11.9m<br />
Total GRDC revenue $175.5m $143.8m $150.4m $127.2m $98.6m<br />
R&D expenses $140.7m $116.8m $106.3m $89.1m $105.6m<br />
Employees, suppliers, administration,<br />
dep’cn $12.6m $12.0m $11.7m $11.5m $11.3m<br />
Asset revaluations $0.8m $4.6m $3.3m $1.9m $1.3m<br />
Total GRDC expenditure $154.1m $133.4m $121.3m $102.5m $118.2m<br />
Operating surplus/(deficit) $20.8m $9.8m $28.5m $24.1m ($19.8m)<br />
Total assets $206.0m $176.7m $159.1m $117.5m $106.0m<br />
Total equity $149.3m $128.5m $118.7m $89.7m $65.6m<br />
Number of projects 900 868 771 611 680<br />
<strong>Grains</strong> industry profile<br />
Estimated number of grain farms b 20,993 20,993 22,082 22,006 20,097<br />
Estimated gross value of production c $12,701m $8,588m $10,749m $10,733m $5,006m<br />
Total grain production—summer<br />
and winter crops (million tonnes) d 44,743 37,330 37,609 29,748 19,188<br />
8 GRDC GROWERS’ REPORT 2010–2011