Annual Reports 2011 V ontob el Group - Vontobel Holding AG
Annual Reports 2011 V ontob el Group - Vontobel Holding AG
Annual Reports 2011 V ontob el Group - Vontobel Holding AG

Create successful ePaper yourself
Turn your PDF publications into a flip-book with our unique Google optimized e-Paper software.
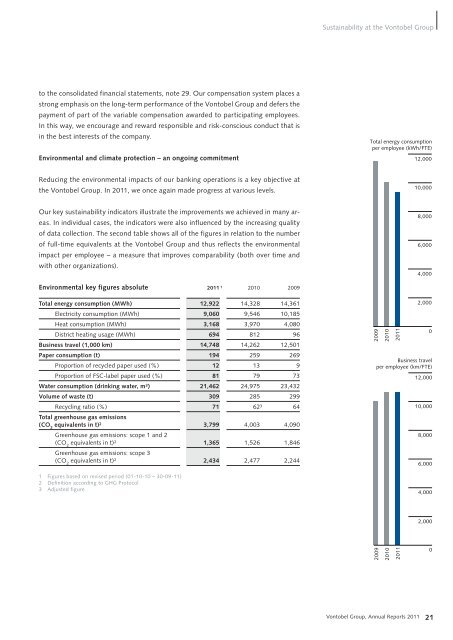
to the consolidated financial statements, note 29. Our compensation system places a<br />
strong emphasis on the long-term performance of the V<strong>ontob</strong><strong>el</strong> <strong>Group</strong> and defers the<br />
payment of part of the variable compensation awarded to participating employees.<br />
In this way, we encourage and reward responsible and risk-conscious conduct that is<br />
in the best interests of the company.<br />
Environmental and climate protection – an ongoing commitment<br />
Reducing the environmental impacts of our banking operations is a key objective at<br />
the V<strong>ontob</strong><strong>el</strong> <strong>Group</strong>. In <strong>2011</strong>, we once again made progress at various lev<strong>el</strong>s.<br />
Our key sustainability indicators illustrate the improvements we achieved in many areas.<br />
In individual cases, the indicators were also influenced by the increasing quality<br />
of data collection. The second table shows all of the figures in r<strong>el</strong>ation to the number<br />
of full-time equivalents at the V<strong>ontob</strong><strong>el</strong> <strong>Group</strong> and thus reflects the environmental<br />
impact per employee – a measure that improves comparability (both over time and<br />
with other organizations).<br />
Environmental key figures absolute <strong>2011</strong> 1 2010 2009<br />
Total energy consumption (MWh) 12,922 14,328 14,361<br />
Electricity consumption (MWh) 9,060 9,546 10,185<br />
Heat consumption (MWh) 3,168 3,970 4,080<br />
District heating usage (MWh) 694 812 96<br />
Business trav<strong>el</strong> (1,000 km) 14,748 14,262 12,501<br />
Paper consumption (t) 194 259 269<br />
Proportion of recycled paper used (%) 12 13 9<br />
Proportion of FSC-lab<strong>el</strong> paper used (%) 81 79 73<br />
Water consumption (drinking water, m3 ) 21,462 24,975 23,432<br />
Volume of waste (t) 309 285 299<br />
Recycling ratio (%) 71 623 Total greenhouse gas emissions<br />
64<br />
(CO2 equivalents in t) 2 Greenhouse gas emissions: scope 1 and 2<br />
3,799 4,003 4,090<br />
(CO2 equivalents in t) 2 Greenhouse gas emissions: scope 3<br />
1,365 1,526 1,846<br />
(CO2 equivalents in t) 2 2,434 2,477 2,244<br />
1 Figures based on revised period (01-10-10 – 30-09-11)<br />
2 Definition according to GHG Protocol<br />
3 Adjusted figure<br />
Sustainability at the V<strong>ontob</strong><strong>el</strong> <strong>Group</strong><br />
Total energy consumption<br />
per employee (kWh/FTE)<br />
2009<br />
2010<br />
<strong>2011</strong><br />
12,000<br />
10,000<br />
8,000<br />
6,000<br />
4,000<br />
2,000<br />
V<strong>ontob</strong><strong>el</strong> <strong>Group</strong>, <strong>Annual</strong> <strong>Reports</strong> <strong>2011</strong> 21<br />
0<br />
Business trav<strong>el</strong><br />
per employee (km/FTE)<br />
2009<br />
2010<br />
<strong>2011</strong><br />
12,000<br />
10,000<br />
8,000<br />
6,000<br />
4,000<br />
2,000<br />
0