PURSUITS 2011! - Business Education Council of Niagara
PURSUITS 2011! - Business Education Council of Niagara
PURSUITS 2011! - Business Education Council of Niagara

Create successful ePaper yourself
Turn your PDF publications into a flip-book with our unique Google optimized e-Paper software.
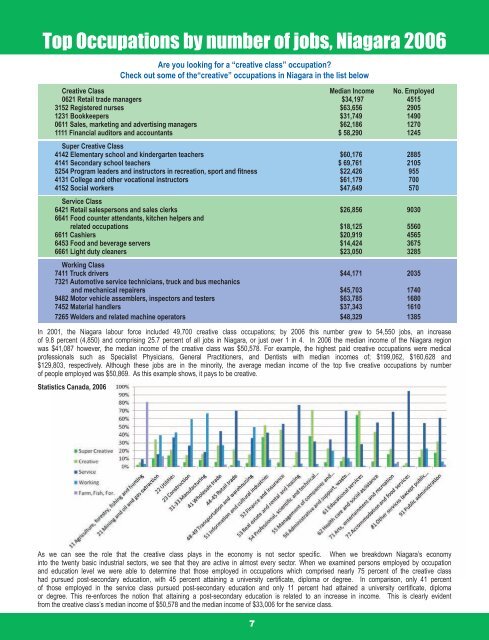
Top Occupations by number <strong>of</strong> jobs, <strong>Niagara</strong> 2006<br />
Are you looking for a “creative class” occupation<br />
Check out some <strong>of</strong> the“creative” occupations in <strong>Niagara</strong> in the list below<br />
Creative Class Median Income No. Employed<br />
0621 Retail trade managers $34,197 4515<br />
3152 Registered nurses $63,656 2905<br />
1231 Bookkeepers $31,749 1490<br />
0611 Sales, marketing and advertising managers $62,186 1270<br />
1111 Financial auditors and accountants $ 58,290 1245<br />
Super Creative Class<br />
4142 Elementary school and kindergarten teachers $60,176 2885<br />
4141 Secondary school teachers $ 69,761 2105<br />
5254 Program leaders and instructors in recreation, sport and fitness $22,426 955<br />
4131 College and other vocational instructors $61,179 700<br />
4152 Social workers $47,649 570<br />
Service Class<br />
6421 Retail salespersons and sales clerks $26,856 9030<br />
6641 Food counter attendants, kitchen helpers and<br />
related occupations $18,125 5560<br />
6611 Cashiers $20,919 4565<br />
6453 Food and beverage servers $14,424 3675<br />
6661 Light duty cleaners $23,050 3285<br />
Working Class<br />
7411 Truck drivers $44,171 2035<br />
7321 Automotive service technicians, truck and bus mechanics<br />
and mechanical repairers $45,703 1740<br />
9482 Motor vehicle assemblers, inspectors and testers $63,785 1680<br />
7452 Material handlers $37,343 1610<br />
7265 Welders and related machine operators $48,329 1385<br />
In 2001, the <strong>Niagara</strong> labour force included 49,700 creative class occupations; by 2006 this number grew to 54,550 jobs, an increase<br />
<strong>of</strong> 9.8 percent (4,850) and comprising 25.7 percent <strong>of</strong> all jobs in <strong>Niagara</strong>, or just over 1 in 4. In 2006 the median income <strong>of</strong> the <strong>Niagara</strong> region<br />
was $41,087 however, the median income <strong>of</strong> the creative class was $50,578. For example, the highest paid creative occupations were medical<br />
pr<strong>of</strong>essionals such as Specialist Physicians, General Practitioners, and Dentists with median incomes <strong>of</strong>; $199,062, $160,628 and<br />
$129,803, respectively. Although these jobs are in the minority, the average median income <strong>of</strong> the top five creative occupations by number<br />
<strong>of</strong> people employed was $50,869. As this example shows, it pays to be creative.<br />
Statistics Canada, 2006<br />
As we can see the role that the creative class plays in the economy is not sector specific. When we breakdown <strong>Niagara</strong>’s economy<br />
into the twenty basic industrial sectors, we see that they are active in almost every sector. When we examined persons employed by occupation<br />
and education level we were able to determine that those employed in occupations which comprised nearly 75 percent <strong>of</strong> the creative class<br />
had pursued post-secondary education, with 45 percent attaining a university certificate, diploma or degree. In comparison, only 41 percent<br />
<strong>of</strong> those employed in the service class pursued post-secondary education and only 11 percent had attained a university certificate, diploma<br />
or degree. This re-enforces the notion that attaining a post-secondary education is related to an increase in income. This is clearly evident<br />
from the creative class’s median income <strong>of</strong> $50,578 and the median income <strong>of</strong> $33,006 for the service class.<br />
7