slides in pdf format - Department of Statistics - Rice University
slides in pdf format - Department of Statistics - Rice University
slides in pdf format - Department of Statistics - Rice University

You also want an ePaper? Increase the reach of your titles
YUMPU automatically turns print PDFs into web optimized ePapers that Google loves.
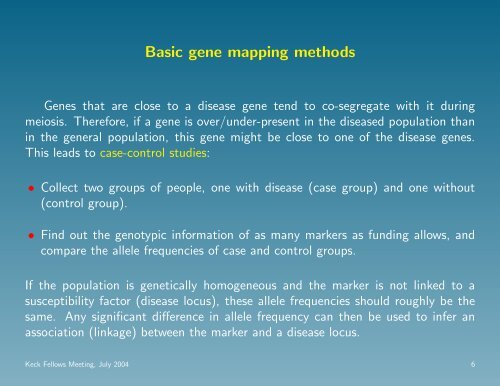
Basic gene mapp<strong>in</strong>g methods<br />
Genes that are close to a disease gene tend to co-segregate with it dur<strong>in</strong>g<br />
meiosis. Therefore, if a gene is over/under-present <strong>in</strong> the diseased population than<br />
<strong>in</strong> the general population, this gene might be close to one <strong>of</strong> the disease genes.<br />
This leads to case-control studies:<br />
• Collect two groups <strong>of</strong> people, one with disease (case group) and one without<br />
(control group).<br />
• F<strong>in</strong>d out the genotypic <strong>in</strong><strong>format</strong>ion <strong>of</strong> as many markers as fund<strong>in</strong>g allows, and<br />
compare the allele frequencies <strong>of</strong> case and control groups.<br />
If the population is genetically homogeneous and the marker is not l<strong>in</strong>ked to a<br />
susceptibility factor (disease locus), these allele frequencies should roughly be the<br />
same. Any significant difference <strong>in</strong> allele frequency can then be used to <strong>in</strong>fer an<br />
association (l<strong>in</strong>kage) between the marker and a disease locus.<br />
Keck Fellows Meet<strong>in</strong>g, July 2004 6