slides in pdf format - Department of Statistics - Rice University
slides in pdf format - Department of Statistics - Rice University
slides in pdf format - Department of Statistics - Rice University

You also want an ePaper? Increase the reach of your titles
YUMPU automatically turns print PDFs into web optimized ePapers that Google loves.
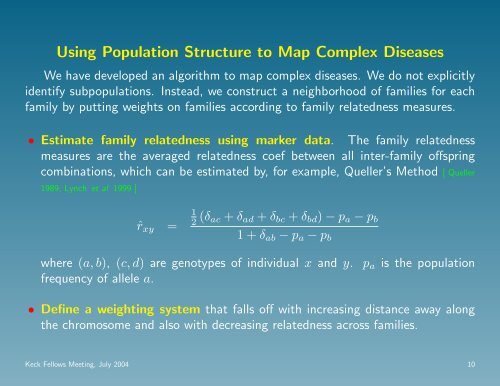
Us<strong>in</strong>g Population Structure to Map Complex Diseases<br />
We have developed an algorithm to map complex diseases. We do not explicitly<br />
identify subpopulations. Instead, we construct a neighborhood <strong>of</strong> families for each<br />
family by putt<strong>in</strong>g weights on families accord<strong>in</strong>g to family relatedness measures.<br />
• Estimate family relatedness us<strong>in</strong>g marker data. The family relatedness<br />
measures are the averaged relatedness coef between all <strong>in</strong>ter-family <strong>of</strong>fspr<strong>in</strong>g<br />
comb<strong>in</strong>ations, which can be estimated by, for example, Queller’s Method [ Queller<br />
1989, Lynch et al 1999 ]<br />
ˆr xy =<br />
1<br />
2 (δ ac + δ ad + δ bc + δ bd ) − p a − p b<br />
1 + δ ab − p a − p b<br />
where (a, b), (c, d) are genotypes <strong>of</strong> <strong>in</strong>dividual x and y. p a is the population<br />
frequency <strong>of</strong> allele a.<br />
• Def<strong>in</strong>e a weight<strong>in</strong>g system that falls <strong>of</strong>f with <strong>in</strong>creas<strong>in</strong>g distance away along<br />
the chromosome and also with decreas<strong>in</strong>g relatedness across families.<br />
Keck Fellows Meet<strong>in</strong>g, July 2004 10