Electric Vehicle Energy Usage Modeling and Measurement ... - IJME
Electric Vehicle Energy Usage Modeling and Measurement ... - IJME
Electric Vehicle Energy Usage Modeling and Measurement ... - IJME

Create successful ePaper yourself
Turn your PDF publications into a flip-book with our unique Google optimized e-Paper software.
——————————————————————————————————————————————–————<br />
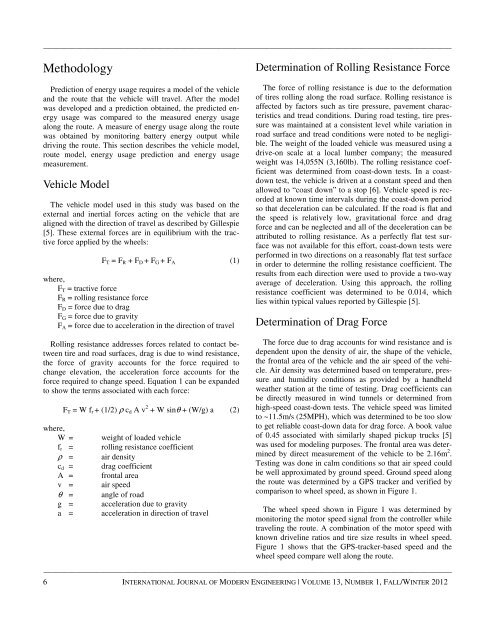
Methodology<br />
Prediction of energy usage requires a model of the vehicle<br />
<strong>and</strong> the route that the vehicle will travel. After the model<br />
was developed <strong>and</strong> a prediction obtained, the predicted energy<br />
usage was compared to the measured energy usage<br />
along the route. A measure of energy usage along the route<br />
was obtained by monitoring battery energy output while<br />
driving the route. This section describes the vehicle model,<br />
route model, energy usage prediction <strong>and</strong> energy usage<br />
measurement.<br />
<strong>Vehicle</strong> Model<br />
The vehicle model used in this study was based on the<br />
external <strong>and</strong> inertial forces acting on the vehicle that are<br />
aligned with the direction of travel as described by Gillespie<br />
[5]. These external forces are in equilibrium with the tractive<br />
force applied by the wheels:<br />
F T = F R + F D + F G + F A (1)<br />
where,<br />
F T = tractive force<br />
F R = rolling resistance force<br />
F D = force due to drag<br />
F G = force due to gravity<br />
F A = force due to acceleration in the direction of travel<br />
Rolling resistance addresses forces related to contact between<br />
tire <strong>and</strong> road surfaces, drag is due to wind resistance,<br />
the force of gravity accounts for the force required to<br />
change elevation, the acceleration force accounts for the<br />
force required to change speed. Equation 1 can be exp<strong>and</strong>ed<br />
to show the terms associated with each force:<br />
where,<br />
W =<br />
f r =<br />
ρ =<br />
c d =<br />
A =<br />
v =<br />
θ =<br />
g =<br />
a =<br />
F T = W f r + (1/2) ρ c d A v 2 + W sinθ + (W/g) a (2)<br />
weight of loaded vehicle<br />
rolling resistance coefficient<br />
air density<br />
drag coefficient<br />
frontal area<br />
air speed<br />
angle of road<br />
acceleration due to gravity<br />
acceleration in direction of travel<br />
Determination of Rolling Resistance Force<br />
The force of rolling resistance is due to the deformation<br />
of tires rolling along the road surface. Rolling resistance is<br />
affected by factors such as tire pressure, pavement characteristics<br />
<strong>and</strong> tread conditions. During road testing, tire pressure<br />
was maintained at a consistent level while variation in<br />
road surface <strong>and</strong> tread conditions were noted to be negligible.<br />
The weight of the loaded vehicle was measured using a<br />
drive-on scale at a local lumber company; the measured<br />
weight was 14,055N (3,160lb). The rolling resistance coefficient<br />
was determined from coast-down tests. In a coastdown<br />
test, the vehicle is driven at a constant speed <strong>and</strong> then<br />
allowed to “coast down” to a stop [6]. <strong>Vehicle</strong> speed is recorded<br />
at known time intervals during the coast-down period<br />
so that deceleration can be calculated. If the road is flat <strong>and</strong><br />
the speed is relatively low, gravitational force <strong>and</strong> drag<br />
force <strong>and</strong> can be neglected <strong>and</strong> all of the deceleration can be<br />
attributed to rolling resistance. As a perfectly flat test surface<br />
was not available for this effort, coast-down tests were<br />
performed in two directions on a reasonably flat test surface<br />
in order to determine the rolling resistance coefficient. The<br />
results from each direction were used to provide a two-way<br />
average of deceleration. Using this approach, the rolling<br />
resistance coefficient was determined to be 0.014, which<br />
lies within typical values reported by Gillespie [5].<br />
Determination of Drag Force<br />
The force due to drag accounts for wind resistance <strong>and</strong> is<br />
dependent upon the density of air, the shape of the vehicle,<br />
the frontal area of the vehicle <strong>and</strong> the air speed of the vehicle.<br />
Air density was determined based on temperature, pressure<br />
<strong>and</strong> humidity conditions as provided by a h<strong>and</strong>held<br />
weather station at the time of testing. Drag coefficients can<br />
be directly measured in wind tunnels or determined from<br />
high-speed coast-down tests. The vehicle speed was limited<br />
to ~11.5m/s (25MPH), which was determined to be too slow<br />
to get reliable coast-down data for drag force. A book value<br />
of 0.45 associated with similarly shaped pickup trucks [5]<br />
was used for modeling purposes. The frontal area was determined<br />
by direct measurement of the vehicle to be 2.16m 2 .<br />
Testing was done in calm conditions so that air speed could<br />
be well approximated by ground speed. Ground speed along<br />
the route was determined by a GPS tracker <strong>and</strong> verified by<br />
comparison to wheel speed, as shown in Figure 1.<br />
The wheel speed shown in Figure 1 was determined by<br />
monitoring the motor speed signal from the controller while<br />
traveling the route. A combination of the motor speed with<br />
known driveline ratios <strong>and</strong> tire size results in wheel speed.<br />
Figure 1 shows that the GPS-tracker-based speed <strong>and</strong> the<br />
wheel speed compare well along the route.<br />
——————————————————————————————————————————————–————<br />
6 INTERNATIONAL JOURNAL OF MODERN ENGINEERING | VOLUME 13, NUMBER 1, FALL/WINTER 2012