Electric Vehicle Energy Usage Modeling and Measurement ... - IJME
Electric Vehicle Energy Usage Modeling and Measurement ... - IJME
Electric Vehicle Energy Usage Modeling and Measurement ... - IJME

Create successful ePaper yourself
Turn your PDF publications into a flip-book with our unique Google optimized e-Paper software.
——————————————————————————————————————————————–————<br />
The GPS-tracker-based elevation data were collected by<br />
traveling the route with two active GPS trackers, which<br />
provided elevation data at 1Hz intervals. The GPS trackers<br />
used to conduct this study were a Trimble Geo XH <strong>and</strong> a<br />
Garmin eTrex Vista. The Trimble Geo XH is survey grade,<br />
while the Garmin eTrex Vista is recreational grade. The<br />
Garmin eTrex Vista produces lower accuracy position data<br />
but has a built-in barometric pressure sensor which allows<br />
relative elevation readings to be taken without relying on<br />
satellites.<br />
The Trimble GPS data were also post-processed using<br />
differential correction to provide a third set of elevation<br />
data. Differential correction methods remove anomalies due<br />
to issues in the interaction between satellites <strong>and</strong> GPS receivers<br />
(typically due to atmospheric conditions) based on<br />
readings from nearby GPS receivers that are in a fixed location<br />
[7]. Because the Trimble tracker is survey grade, differentially<br />
corrected route data from the Trimble tracker is<br />
considered to be the most reliable source of route model<br />
data used in this study.<br />
The fourth set of elevation data was sourced from a<br />
USGS database. The USGS has image-based digital elevation<br />
models (DEMs) published online that have a resolution<br />
of 10 meters. This means that in an image, every 10-meter<br />
by 10-meter pixel is assigned an elevation value [8]. For the<br />
case described here, the route was entered into ArcMap<br />
(geospatial analysis software) <strong>and</strong> the elevation data for<br />
points along the route were extracted from the appropriate<br />
DEM.<br />
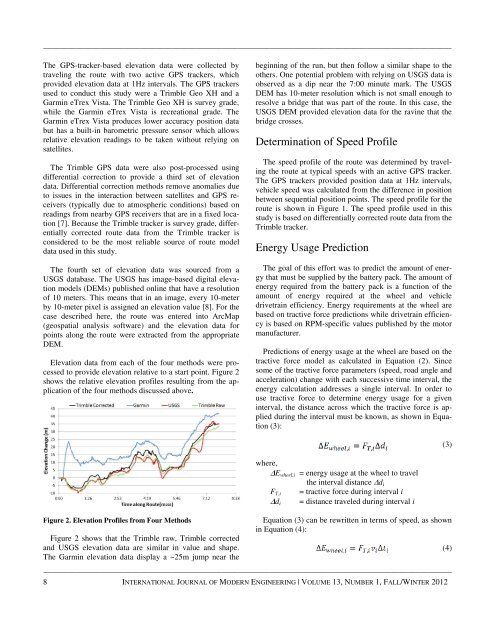
Elevation data from each of the four methods were processed<br />
to provide elevation relative to a start point. Figure 2<br />
shows the relative elevation profiles resulting from the application<br />
of the four methods discussed above.<br />
beginning of the run, but then follow a similar shape to the<br />
others. One potential problem with relying on USGS data is<br />
observed as a dip near the 7:00 minute mark. The USGS<br />
DEM has 10-meter resolution which is not small enough to<br />
resolve a bridge that was part of the route. In this case, the<br />
USGS DEM provided elevation data for the ravine that the<br />
bridge crosses.<br />
Determination of Speed Profile<br />
The speed profile of the route was determined by traveling<br />
the route at typical speeds with an active GPS tracker.<br />
The GPS trackers provided position data at 1Hz intervals,<br />
vehicle speed was calculated from the difference in position<br />
between sequential position points. The speed profile for the<br />
route is shown in Figure 1. The speed profile used in this<br />
study is based on differentially corrected route data from the<br />
Trimble tracker.<br />
<strong>Energy</strong> <strong>Usage</strong> Prediction<br />
The goal of this effort was to predict the amount of energy<br />
that must be supplied by the battery pack. The amount of<br />
energy required from the battery pack is a function of the<br />
amount of energy required at the wheel <strong>and</strong> vehicle<br />
drivetrain efficiency. <strong>Energy</strong> requirements at the wheel are<br />
based on tractive force predictions while drivetrain efficiency<br />
is based on RPM-specific values published by the motor<br />
manufacturer.<br />
Predictions of energy usage at the wheel are based on the<br />
tractive force model as calculated in Equation (2). Since<br />
some of the tractive force parameters (speed, road angle <strong>and</strong><br />
acceleration) change with each successive time interval, the<br />
energy calculation addresses a single interval. In order to<br />
use tractive force to determine energy usage for a given<br />
interval, the distance across which the tractive force is applied<br />
during the interval must be known, as shown in Equation<br />
(3):<br />
(3)<br />
Figure 2. Elevation Profiles from Four Methods<br />
Figure 2 shows that the Trimble raw, Trimble corrected<br />
<strong>and</strong> USGS elevation data are similar in value <strong>and</strong> shape.<br />
The Garmin elevation data display a ~25m jump near the<br />
where,<br />
∆E wheel,i = energy usage at the wheel to travel<br />
the interval distance ∆d i<br />
F T,i = tractive force during interval i<br />
∆d i = distance traveled during interval i<br />
Equation (3) can be rewritten in terms of speed, as shown<br />
in Equation (4):<br />
——————————————————————————————————————————————–————<br />
8 INTERNATIONAL JOURNAL OF MODERN ENGINEERING | VOLUME 13, NUMBER 1, FALL/WINTER 2012<br />
(4)