Electric Vehicle Energy Usage Modeling and Measurement ... - IJME
Electric Vehicle Energy Usage Modeling and Measurement ... - IJME
Electric Vehicle Energy Usage Modeling and Measurement ... - IJME

You also want an ePaper? Increase the reach of your titles
YUMPU automatically turns print PDFs into web optimized ePapers that Google loves.
——————————————————————————————————————————————–————<br />
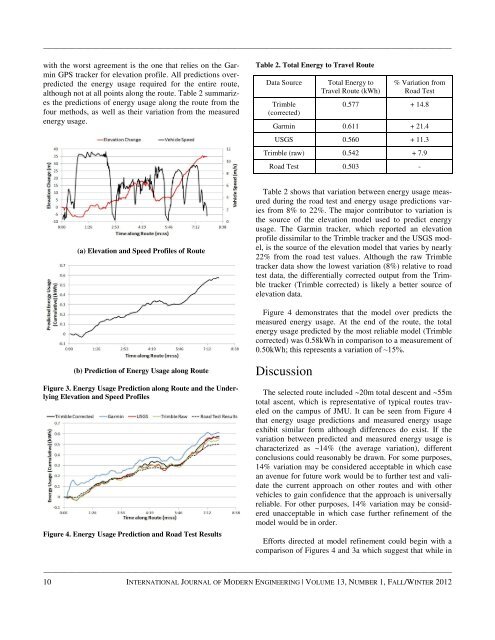
with the worst agreement is the one that relies on the Garmin<br />
GPS tracker for elevation profile. All predictions overpredicted<br />
the energy usage required for the entire route,<br />
although not at all points along the route. Table 2 summarizes<br />
the predictions of energy usage along the route from the<br />
four methods, as well as their variation from the measured<br />
energy usage.<br />
Table 2. Total <strong>Energy</strong> to Travel Route<br />
Data Source<br />
Trimble<br />
(corrected)<br />
Total <strong>Energy</strong> to<br />
Travel Route (kWh)<br />
% Variation from<br />
Road Test<br />
0.577 + 14.8<br />
Garmin 0.611 + 21.4<br />
USGS 0.560 + 11.3<br />
Trimble (raw) 0.542 + 7.9<br />
Road Test 0.503 -<br />
(a) Elevation <strong>and</strong> Speed Profiles of Route<br />
Table 2 shows that variation between energy usage measured<br />
during the road test <strong>and</strong> energy usage predictions varies<br />
from 8% to 22%. The major contributor to variation is<br />
the source of the elevation model used to predict energy<br />
usage. The Garmin tracker, which reported an elevation<br />
profile dissimilar to the Trimble tracker <strong>and</strong> the USGS model,<br />
is the source of the elevation model that varies by nearly<br />
22% from the road test values. Although the raw Trimble<br />
tracker data show the lowest variation (8%) relative to road<br />
test data, the differentially corrected output from the Trimble<br />
tracker (Trimble corrected) is likely a better source of<br />
elevation data.<br />
Figure 4 demonstrates that the model over predicts the<br />
measured energy usage. At the end of the route, the total<br />
energy usage predicted by the most reliable model (Trimble<br />
corrected) was 0.58kWh in comparison to a measurement of<br />
0.50kWh; this represents a variation of ~15%.<br />
(b) Prediction of <strong>Energy</strong> <strong>Usage</strong> along Route<br />
Figure 3. <strong>Energy</strong> <strong>Usage</strong> Prediction along Route <strong>and</strong> the Underlying<br />
Elevation <strong>and</strong> Speed Profiles<br />
Figure 4. <strong>Energy</strong> <strong>Usage</strong> Prediction <strong>and</strong> Road Test Results<br />
Discussion<br />
The selected route included ~20m total descent <strong>and</strong> ~55m<br />
total ascent, which is representative of typical routes traveled<br />
on the campus of JMU. It can be seen from Figure 4<br />
that energy usage predictions <strong>and</strong> measured energy usage<br />
exhibit similar form although differences do exist. If the<br />
variation between predicted <strong>and</strong> measured energy usage is<br />
characterized as ~14% (the average variation), different<br />
conclusions could reasonably be drawn. For some purposes,<br />
14% variation may be considered acceptable in which case<br />
an avenue for future work would be to further test <strong>and</strong> validate<br />
the current approach on other routes <strong>and</strong> with other<br />
vehicles to gain confidence that the approach is universally<br />
reliable. For other purposes, 14% variation may be considered<br />
unacceptable in which case further refinement of the<br />
model would be in order.<br />
Efforts directed at model refinement could begin with a<br />
comparison of Figures 4 <strong>and</strong> 3a which suggest that while in<br />
——————————————————————————————————————————————–————<br />
10 INTERNATIONAL JOURNAL OF MODERN ENGINEERING | VOLUME 13, NUMBER 1, FALL/WINTER 2012