

Hard_Edges_Mapping_SMD_FINAL_VERSION_Web
Hard_Edges_Mapping_SMD_FINAL_VERSION_Web
Hard_Edges_Mapping_SMD_FINAL_VERSION_Web

You also want an ePaper? Increase the reach of your titles
YUMPU automatically turns print PDFs into web optimized ePapers that Google loves.
26 <strong>Hard</strong> edges<br />
Local Examples: Manchester and Lambeth<br />
For the purposes of comparison, two examples<br />
are presented below alongside each other<br />
– Manchester (a northern city with high<br />
prevalence of <strong>SMD</strong>) and Lambeth (an inner<br />
London borough with fairly high prevalence) (for<br />
more details on these cases see Appendix J).<br />
We present for each authority a prevalence<br />
rate (per 1,000 working age population) and<br />
an estimated actual number for each <strong>SMD</strong><br />
category. We follow the same approach as with<br />
our presentation of the national total numbers<br />
in Figure 1, by estimating the number in each<br />
category (or segment) of <strong>SMD</strong> from the best<br />
available source for that number.<br />
We also present an estimate of the number<br />
within any of these <strong>SMD</strong> categories who also<br />
have mental health problems. As discussed<br />
elsewhere in this report, there are grounds for<br />
believing that the incidence of mental health<br />
problems may be significantly greater than<br />
recorded here. Thus these initial estimates<br />
give a feel for a conservative estimate of the<br />
overlap between mental health problems and<br />
our <strong>SMD</strong> groups.<br />
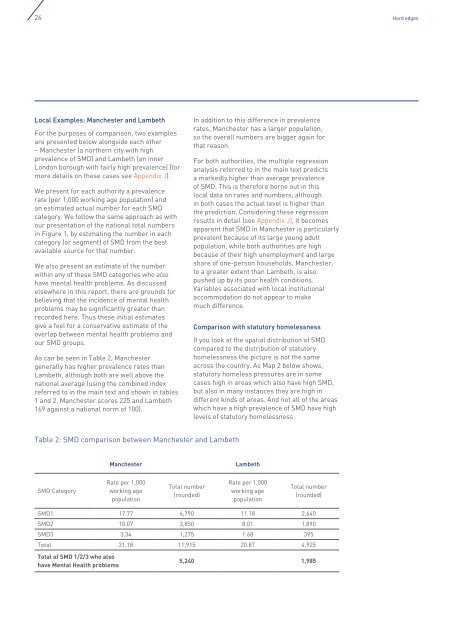
As can be seen in Table 2, Manchester<br />
generally has higher prevalence rates than<br />
Lambeth, although both are well above the<br />
national average (using the combined index<br />
referred to in the main text and shown in tables<br />
1 and 2, Manchester scores 225 and Lambeth<br />
169 against a national norm of 100).<br />
In addition to this difference in prevalence<br />
rates, Manchester has a larger population,<br />
so the overall numbers are bigger again for<br />
that reason.<br />
For both authorities, the multiple regression<br />
analysis referred to in the main text predicts<br />
a markedly higher than average prevalence<br />
of <strong>SMD</strong>. This is therefore borne out in this<br />
local data on rates and numbers, although<br />
in both cases the actual level is higher than<br />
the prediction. Considering these regression<br />
results in detail (see Appendix J), it becomes<br />
apparent that <strong>SMD</strong> in Manchester is particularly<br />
prevalent because of its large young adult<br />
population, while both authorities are high<br />
because of their high unemployment and large<br />
share of one-person households. Manchester,<br />
to a greater extent than Lambeth, is also<br />
pushed up by its poor health conditions.<br />
Variables associated with local institutional<br />
accommodation do not appear to make<br />
much difference.<br />
Comparison with statutory homelessness<br />
If you look at the spatial distribution of <strong>SMD</strong><br />
compared to the distribution of statutory<br />
homelessness the picture is not the same<br />
across the country. As Map 2 below shows,<br />
statutory homeless pressures are in some<br />
cases high in areas which also have high <strong>SMD</strong>,<br />
but also in many instances they are high in<br />
different kinds of areas. And not all of the areas<br />
which have a high prevalence of <strong>SMD</strong> have high<br />
levels of statutory homelessness.<br />
Table 2: <strong>SMD</strong> comparison between Manchester and Lambeth<br />
Manchester Lambeth<br />
<strong>SMD</strong> Category<br />
Rate per 1,000<br />
working age<br />
population<br />
Total number<br />
(rounded)<br />
Rate per 1,000<br />
working age<br />
population<br />
Total number<br />
(rounded)<br />
<strong>SMD</strong>1 17.77 6,790 11.18 2,640<br />
<strong>SMD</strong>2 10.07 3,850 8.01 1,890<br />
<strong>SMD</strong>3 3.34 1,275 1.68 395<br />
Total 31.18 11,915 20.87 4,925<br />
Total of <strong>SMD</strong> 1/2/3 who also<br />
have Mental Health problems<br />
5,240 1,985