

Hard_Edges_Mapping_SMD_FINAL_VERSION_Web
Hard_Edges_Mapping_SMD_FINAL_VERSION_Web
Hard_Edges_Mapping_SMD_FINAL_VERSION_Web

Create successful ePaper yourself
Turn your PDF publications into a flip-book with our unique Google optimized e-Paper software.
37<br />
www.lankellychase.org.uk<br />
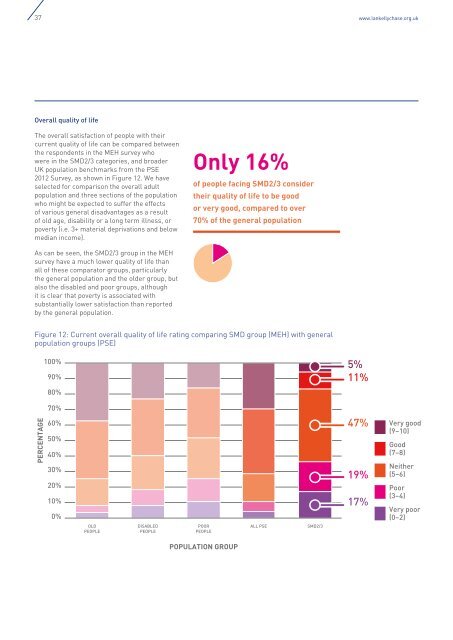
Overall quality of life<br />
The overall satisfaction of people with their<br />
current quality of life can be compared between<br />
the respondents in the MEH survey who<br />
were in the <strong>SMD</strong>2/3 categories, and broader<br />
UK population benchmarks from the PSE<br />
2012 Survey, as shown in Figure 12. We have<br />
selected for comparison the overall adult<br />
population and three sections of the population<br />
who might be expected to suffer the effects<br />
of various general disadvantages as a result<br />
of old age, disability or a long term illness, or<br />
poverty (i.e. 3+ material deprivations and below<br />
median income).<br />
ality of Life Rating<br />
oup (MEH) with<br />
Groups (PSE)<br />
As can be seen, the <strong>SMD</strong>2/3 group in the MEH<br />
survey have a much lower quality of life than<br />
all of these comparator groups, particularly<br />
the general population and the older group, but<br />
also the disabled and poor groups, although<br />
it is clear that poverty is associated with<br />
substantially lower satisfaction than reported<br />
by the general population.<br />
Only 16%<br />
of people facing <strong>SMD</strong>2/3 consider<br />
their quality of life to be good<br />
or very good, compared to over<br />
70% of the general population<br />
Total 99%<br />
Figure 12: Current overall quality of life rating comparing <strong>SMD</strong> group (MEH) with general<br />
population groups (PSE)<br />
5%<br />
11%<br />
PERCENTAGE<br />
OLD<br />
PEOPLE<br />
DISABLED<br />
PEOPLE<br />
POOR<br />
PEOPLE<br />
ALL PSE<br />
<strong>SMD</strong>2/3<br />
47%<br />
19%<br />
17%<br />
Very good<br />
(9–10)<br />
Good<br />
(7–8)<br />
Neither<br />
(5–6)<br />
Poor<br />
(3–4)<br />
Very poor<br />
(0–2)<br />
POPULATION GROUP