On high ground Container Corporation of India - The Smart Investor
On high ground Container Corporation of India - The Smart Investor
On high ground Container Corporation of India - The Smart Investor

You also want an ePaper? Increase the reach of your titles
YUMPU automatically turns print PDFs into web optimized ePapers that Google loves.
<strong>Container</strong> <strong>Corporation</strong> <strong>of</strong> <strong>India</strong><br />
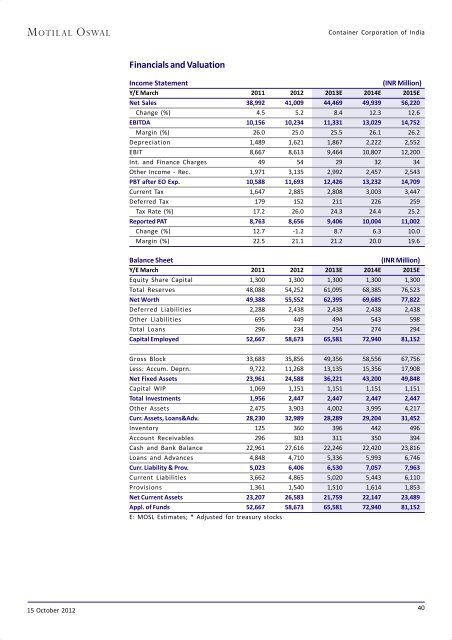
Financials and Valuation<br />
Income Statement<br />
(INR Million)<br />
Y/E March 2011 2012 2013E 2014E 2015E<br />
Net Sales 38,992 41,009 44,469 49,939 56,220<br />
Change (%) 4.5 5.2 8.4 12.3 12.6<br />
EBITDA 10,156 10,234 11,331 13,029 14,752<br />
Margin (%) 26.0 25.0 25.5 26.1 26.2<br />
Depreciation 1,489 1,621 1,867 2,222 2,552<br />
EBIT 8,667 8,613 9,464 10,807 12,200<br />
Int. and Finance Charges 49 54 29 32 34<br />
Other Income - Rec. 1,971 3,135 2,992 2,457 2,543<br />
PBT after EO Exp. 10,588 11,693 12,426 13,232 14,709<br />
Current Tax 1,647 2,885 2,808 3,003 3,447<br />
Deferred Tax 179 152 211 226 259<br />
Tax Rate (%) 17.2 26.0 24.3 24.4 25.2<br />
Reported PAT 8,763 8,656 9,406 10,004 11,002<br />
Change (%) 12.7 -1.2 8.7 6.3 10.0<br />
Margin (%) 22.5 21.1 21.2 20.0 19.6<br />
Balance Sheet<br />
(INR Million)<br />
Y/E March 2011 2012 2013E 2014E 2015E<br />
Equity Share Capital 1,300 1,300 1,300 1,300 1,300<br />
Total Reserves 48,088 54,252 61,095 68,385 76,523<br />
Net Worth 49,388 55,552 62,395 69,685 77,822<br />
Deferred Liabilities 2,288 2,438 2,438 2,438 2,438<br />
Other Liabilities 695 449 494 543 598<br />
Total Loans 296 234 254 274 294<br />
Capital Employed 52,667 58,673 65,581 72,940 81,152<br />
Gross Block 33,683 35,856 49,356 58,556 67,756<br />
Less: Accum. Deprn. 9,722 11,268 13,135 15,356 17,908<br />
Net Fixed Assets 23,961 24,588 36,221 43,200 49,848<br />
Capital WIP 1,069 1,151 1,151 1,151 1,151<br />
Total Investments 1,956 2,447 2,447 2,447 2,447<br />
Other Assets 2,475 3,903 4,002 3,995 4,217<br />
Curr. Assets, Loans&Adv. 28,230 32,989 28,289 29,204 31,452<br />
Inventory 125 360 396 442 496<br />
Account Receivables 296 303 311 350 394<br />
Cash and Bank Balance 22,961 27,616 22,246 22,420 23,816<br />
Loans and Advances 4,848 4,710 5,336 5,993 6,746<br />
Curr. Liability & Prov. 5,023 6,406 6,530 7,057 7,963<br />
Current Liabilities 3,662 4,865 5,020 5,443 6,110<br />
Provisions 1,361 1,540 1,510 1,614 1,853<br />
Net Current Assets 23,207 26,583 21,759 22,147 23,489<br />
Appl. <strong>of</strong> Funds 52,667 58,673 65,581 72,940 81,152<br />
E: MOSL Estimates; * Adjusted for treasury stocks<br />
15 October 2012 40