FORM 10-K/A GAMCO Investors, Inc. - Gabelli
FORM 10-K/A GAMCO Investors, Inc. - Gabelli
FORM 10-K/A GAMCO Investors, Inc. - Gabelli
- No tags were found...

You also want an ePaper? Increase the reach of your titles
YUMPU automatically turns print PDFs into web optimized ePapers that Google loves.
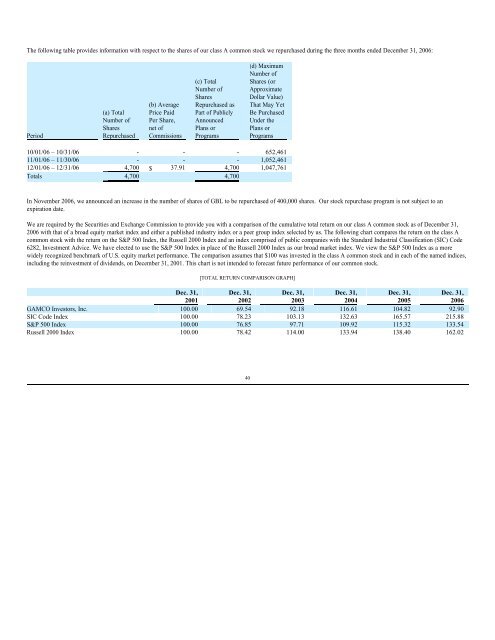
The following table provides information with respect to the shares of our class A common stock we repurchased during the three months ended December 31, 2006:<br />
Period<br />
(a) Total<br />
Number of<br />
Shares<br />
Repurchased<br />
(b) Average<br />
Price Paid<br />
Per Share,<br />
net of<br />
Commissions<br />
(c) Total<br />
Number of<br />
Shares<br />
Repurchased as<br />
Part of Publicly<br />
Announced<br />
Plans or<br />
Programs<br />
(d) Maximum<br />
Number of<br />
Shares (or<br />
Approximate<br />
Dollar Value)<br />
That May Yet<br />
Be Purchased<br />
Under the<br />
Plans or<br />
Programs<br />
<strong>10</strong>/01/06 – <strong>10</strong>/31/06 - - - 652,461<br />
11/01/06 – 11/30/06 - - - 1,052,461<br />
12/01/06 – 12/31/06 4,700 $ 37.91 4,700 1,047,761<br />
Totals 4,700 4,700<br />
In November 2006, we announced an increase in the number of shares of GBL to be repurchased of 400,000 shares. Our stock repurchase program is not subject to an<br />
expiration date.<br />
We are required by the Securities and Exchange Commission to provide you with a comparison of the cumulative total return on our class A common stock as of December 31,<br />
2006 with that of a broad equity market index and either a published industry index or a peer group index selected by us. The following chart compares the return on the class A<br />
common stock with the return on the S&P 500 Index, the Russell 2000 Index and an index comprised of public companies with the Standard Industrial Classification (SIC) Code<br />
6282, Investment Advice. We have elected to use the S&P 500 Index in place of the Russell 2000 Index as our broad market index. We view the S&P 500 Index as a more<br />
widely recognized benchmark of U.S. equity market performance. The comparison assumes that $<strong>10</strong>0 was invested in the class A common stock and in each of the named indices,<br />
including the reinvestment of dividends, on December 31, 2001. This chart is not intended to forecast future performance of our common stock.<br />
[TOTAL RETURN COMPARISON GRAPH]<br />
Dec. 31, Dec. 31, Dec. 31, Dec. 31, Dec. 31, Dec. 31,<br />
2001 2002 2003 2004 2005 2006<br />
<strong>GAMCO</strong> <strong>Investors</strong>, <strong>Inc</strong>. <strong>10</strong>0.00 69.54 92.18 116.61 <strong>10</strong>4.82 92.90<br />
SIC Code Index <strong>10</strong>0.00 78.23 <strong>10</strong>3.13 132.63 165.57 215.88<br />
S&P 500 Index <strong>10</strong>0.00 76.85 97.71 <strong>10</strong>9.92 115.32 133.54<br />
Russell 2000 Index <strong>10</strong>0.00 78.42 114.00 133.94 138.40 162.02<br />
40