FORM 10-K/A GAMCO Investors, Inc. - Gabelli
FORM 10-K/A GAMCO Investors, Inc. - Gabelli
FORM 10-K/A GAMCO Investors, Inc. - Gabelli
- No tags were found...
You also want an ePaper? Increase the reach of your titles
YUMPU automatically turns print PDFs into web optimized ePapers that Google loves.
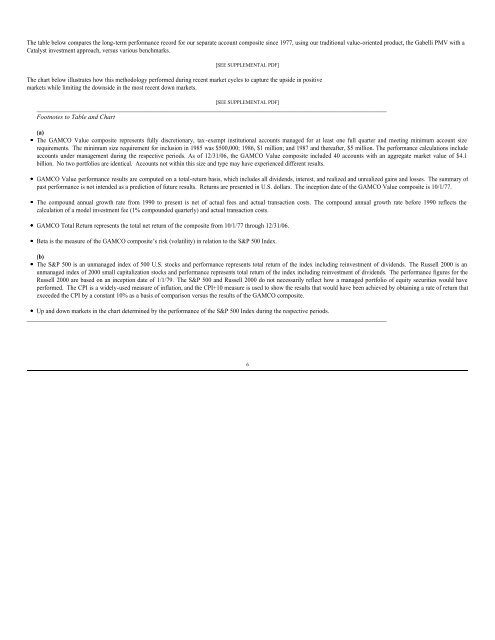
The table below compares the long-term performance record for our separate account composite since 1977, using our traditional value-oriented product, the <strong>Gabelli</strong> PMV with a<br />
Catalyst investment approach, versus various benchmarks.<br />
[SEE SUPPLEMENTAL PDF]<br />
The chart below illustrates how this methodology performed during recent market cycles to capture the upside in positive<br />
markets while limiting the downside in the most recent down markets.<br />
[SEE SUPPLEMENTAL PDF]<br />
___________________________________________________________________________________________________________<br />
Footnotes to Table and Chart<br />
(a)<br />
· The <strong>GAMCO</strong> Value composite represents fully discretionary, tax-exempt institutional accounts managed for at least one full quarter and meeting minimum account size<br />
requirements. The minimum size requirement for inclusion in 1985 was $500,000; 1986, $1 million; and 1987 and thereafter, $5 million. The performance calculations include<br />
accounts under management during the respective periods. As of 12/31/06, the <strong>GAMCO</strong> Value composite included 40 accounts with an aggregate market value of $4.1<br />
billion. No two portfolios are identical. Accounts not within this size and type may have experienced different results.<br />
· <strong>GAMCO</strong> Value performance results are computed on a total-return basis, which includes all dividends, interest, and realized and unrealized gains and losses. The summary of<br />
past performance is not intended as a prediction of future results. Returns are presented in U.S. dollars. The inception date of the <strong>GAMCO</strong> Value composite is <strong>10</strong>/1/77.<br />
· The compound annual growth rate from 1990 to present is net of actual fees and actual transaction costs. The compound annual growth rate before 1990 reflects the<br />
calculation of a model investment fee (1% compounded quarterly) and actual transaction costs.<br />
· <strong>GAMCO</strong> Total Return represents the total net return of the composite from <strong>10</strong>/1/77 through 12/31/06.<br />
· Beta is the measure of the <strong>GAMCO</strong> composite’s risk (volatility) in relation to the S&P 500 Index.<br />
(b)<br />
· The S&P 500 is an unmanaged index of 500 U.S. stocks and performance represents total return of the index including reinvestment of dividends. The Russell 2000 is an<br />
unmanaged index of 2000 small capitalization stocks and performance represents total return of the index including reinvestment of dividends. The performance figures for the<br />
Russell 2000 are based on an inception date of 1/1/79. The S&P 500 and Russell 2000 do not necessarily reflect how a managed portfolio of equity securities would have<br />
performed. The CPI is a widely-used measure of inflation, and the CPI+<strong>10</strong> measure is used to show the results that would have been achieved by obtaining a rate of return that<br />
exceeded the CPI by a constant <strong>10</strong>% as a basis of comparison versus the results of the <strong>GAMCO</strong> composite.<br />
· Up and down markets in the chart determined by the performance of the S&P 500 Index during the respective periods.<br />
______________________________________________________________________________________________________________<br />
6


