- Page 1 and 2:
FINAL ENVIRONMENTAL IMPACT STATEMEN
- Page 3 and 4:
APPENDICES GLACIER BAY N ATIONAL PA
- Page 5 and 6:
National Park Service, Interior §
- Page 7 and 8:
National Park Service, Interior §
- Page 9 and 10:
National Park Service, Interior §
- Page 11 and 12:
National Park Service, Interior §
- Page 13 and 14:
APPENDIX B Glacier Bay National Par
- Page 15 and 16:
• Using, possessing, storing, or
- Page 17 and 18:
park road prior notification of tra
- Page 19 and 20:
The intent of these requirements is
- Page 21 and 22:
2.17(c)(1) Removal of downed aircra
- Page 23 and 24:
4.21(b)-(c) Speed limits-designatio
- Page 25 and 26:
• Fuel caches will be stored at l
- Page 27 and 28:
• The landmass between Margerie G
- Page 29 and 30:
• A private boater may apply for
- Page 31 and 32:
• The discharge of “blackwater
- Page 33 and 34:
This compendium is approved and res
- Page 35 and 36:
Appendix B, Areas Closed to Overnig
- Page 37 and 38:
Appendix D: Maps and Charts of Glac
- Page 39 and 40:
APPENDIX C Acoustics Memorandum
- Page 41 and 42: 1.0 ACOUSTIC CONCEPTS AND TERMINOLO
- Page 43 and 44: 1.2.3 Levels of Tones A tone is a s
- Page 45 and 46: The terms phase, phase difference,
- Page 47 and 48: Lr = L s - 20 log R where Lr is the
- Page 49 and 50: larger volume than would have been
- Page 51 and 52: Many assumptions must be made to pr
- Page 53 and 54: e 1• Pa, approximately 80 dB abov
- Page 55 and 56: Intensity discrimination may be imp
- Page 57 and 58: and Dahlheim 2001). It is suggested
- Page 59 and 60: 8-hr measurement periods was due pr
- Page 61 and 62: Malme, C. I., P. R. Miles, C. W. Cl
- Page 63 and 64: APPENDIX D Air Emissions Calculatio
- Page 65 and 66: The basic equations used for the ca
- Page 67 and 68: Average Power Ratings (kW) and Load
- Page 69 and 70: Existing Conditions Speed Assumptio
- Page 71 and 72: Baseline Cruise Ship Emissions- 200
- Page 73 and 74: Summary of Baseline Cruise Ship Emi
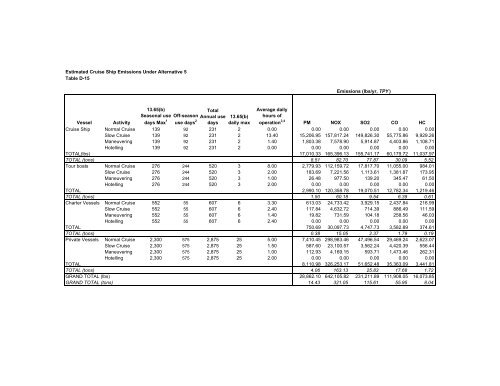
- Page 75 and 76: Estimated Cruise Ship Emissions Und
- Page 77 and 78: Summary of Estimated Cruise Ship Em
- Page 79 and 80: Estimated Cruise Ship Emissions Und
- Page 81 and 82: Summary of Estimated Cruise Ship Em
- Page 83 and 84: Estimated Cruise Ship Emissions Und
- Page 85 and 86: Summary of Estimated Cruise Ship Em
- Page 87 and 88: Estimated Cruise Ship Emissions Und
- Page 89 and 90: Summary of Estimated Cruise Ship Em
- Page 91: Estimated Cruise Ship Emissions Und
- Page 95 and 96: Estimated Cruise Ship Emissions Und
- Page 97 and 98: Summary of Estimated Cruise Ship Em
- Page 99 and 100: ESTIMATED CUMULATIVE EMISSIONS EMIS
- Page 101 and 102: EMISSIONS FROM DIESEL GENERATORS AT
- Page 103 and 104: Matrix To Identify Glacier Bay Admi
- Page 105 and 106: Have adverse effects on properties
- Page 107 and 108: LOCAL CATEGORIES Year Local Categor
- Page 109 and 110: GENERAL PERMIT VISITOR USE DAYS BY
- Page 111 and 112: Private Vessel Characteristics of P
- Page 113 and 114: Lengths of Private Vessels Entering
- Page 115: Dundas Bay Vessel Traffic Documente
- Page 138 and 139: TABLE 1: GUIDING PROPERTIES OF EFFE
- Page 140 and 141: TABLE 3: PROBABLE SPILL SCENARIOS -
- Page 142 and 143:
DRAFT Technical Memorandum Vessel W
- Page 144 and 145:
Figures Figure 1 Passing Boat's Wak
- Page 146 and 147:
3 BACKGROUND This section provides
- Page 148 and 149:
were analyzed to determine their ap
- Page 150 and 151:
Predictions of maximum wave height
- Page 152 and 153:
• evaluating Gustavus, Alaska win
- Page 154 and 155:
The investigators observed that the
- Page 156 and 157:
near protecting islands, wave growt
- Page 158 and 159:
• 100% of the vessel wake energy
- Page 160 and 161:
TABLE 2NUMBER OF OBSERVATIONS WHEN
- Page 162 and 163:
vessel wakes in comparison to the n
- Page 164 and 165:
FIGURE 8WAVE ENERGIES RELATED TO TH
- Page 166 and 167:
Site Beach potential 5 Assigned Sit
- Page 168 and 169:
TABLE 7SUBSTRATE TYPES AND SLOPE FO
- Page 170 and 171:
Site 7 The average material size fo
- Page 172 and 173:
degrees. The minimum slope is 4 deg
- Page 174 and 175:
Site 4 Site 4 is generally a cobble
- Page 176 and 177:
negligible. Therefore, this site ha
- Page 178 and 179:
There are many waterway users that
- Page 180 and 181:
• Requiring vessels to stay farth
- Page 182 and 183:
Tide cycle of June 12, 2002 and dat
- Page 184 and 185:
8 REFERENCES Alaska Sea Atlas Websi
- Page 187 and 188:
VICINITY MAP GUSTAVUS, ALASKA JUNEA
- Page 190 and 191:
assigned Gustavus probabilities sum
- Page 192 and 193:
Memorandum To: File Project No.: 02
- Page 194 and 195:
Wave generation models and example
- Page 196 and 197:
Wave generation models and example
- Page 198 and 199:
Wave generation models and example
- Page 200 and 201:
Wave generation models and example
- Page 202 and 203:
Wave generation models and example
- Page 204 and 205:
GPS Way Point Log Cruise of Spirit
- Page 206 and 207:
GPS Way Point Log Cruise of Spirit
- Page 208 and 209:
GPS Way Point Log Cruise of Spirit
- Page 210 and 211:
GPS Way Point Log Cruise of Spirit
- Page 212 and 213:
GPS Way Point Log Cruise of Spirit
- Page 214 and 215:
GPS Way Point Log Cruise of Spirit
- Page 216 and 217:
GPS Way Point Log Cruise of Spirit
- Page 218 and 219:
Memorandum To: File Project No.: 02
- Page 220 and 221:
Wind Rose Page 1 of 2 Database: TDF
- Page 222 and 223:
Juneau (radial bands indicate 10 kn
- Page 224 and 225:
Wind Rose Page 2 of 3 Please Read I
- Page 226 and 227:
Cordova (radial bands indicate 10 k
- Page 228 and 229:
Wind Rose Page 2 of 2 The following
- Page 230 and 231:
Wind Rose Page 1 of 2 Database: TDF
- Page 232:
Memorandum To: File Project No.: 02
- Page 263 and 264:
Memorandum To: File Project No.: 02
- Page 265 and 266:
H MO1 := 0.13 H MO2 := 0.68 H MO3 :
- Page 267 and 268:
Winds from 200, 260 and 340 deg Win
- Page 269 and 270:
Example 2 Wave analysis of site 11
- Page 271 and 272:
Winds from 200 degrees From the win
- Page 273 and 274:
m 2 := H MO2 2 P2 hr ⋅ ⋅24⋅36
- Page 275 and 276:
CoastWalkers Polygon Table Listed b
- Page 277 and 278:
CoastWalkers Polygon Table Listed b
- Page 279 and 280:
CoastWalkers Polygon Table Listed b
- Page 281 and 282:
TABLE 1: ALTERNATIVE 1 - POTENTIAL
- Page 283 and 284:
TABLE 2: ALTERNATIVE 2 - POTENTIAL
- Page 285 and 286:
TABLE 3: ALTERNATIVE 3 - POTENTIAL
- Page 287 and 288:
TABLE 4: ALTERNATIVE 4 - POTENTIAL
- Page 289 and 290:
TABLE 5: ALTERNATIVE 5 - POTENTIAL
- Page 291 and 292:
TABLE 6: ALTERNATIVE 6 - POTENTIAL
- Page 293 and 294:
APPENDIX I 43 Code of Federal Regul
- Page 295 and 296:
easonable date by which aircraft re
- Page 297:
APPENDIX J Consultation Corresponde
- Page 385:
APPENDIX L Essential Fish Habitat A
- Page 415 and 416:
RESPONSE TO PUBLIC COMMENTS ON THE
- Page 417 and 418:
General Response Number 3. The Park
- Page 419 and 420:
Response to Public Comments Include
- Page 421:
Oman, Maryellen....................
- Page 425:
4 NUMBER RESPONSE F1-3 The FEIS inc
- Page 429:
8 NUMBER RESPONSE S1-02 The Park Se
- Page 433:
12 NUMBER RESPONSE S1-07 The refere
- Page 437:
16 Grouping: Native Corporation or
- Page 441:
20 NUMBER RESPONSE N1-5 The Park Se
- Page 445:
24 NUMBER RESPONSE N2-2 The issue o
- Page 449:
28 NUMBER RESPONSE N3-3 This provis
- Page 453:
32 NUMBER OR1-2 OR1-3 OR1-4 OR1-5 O
- Page 457:
36 NUMBER OR2-1 RESPONSE Each alter
- Page 461:
40 NUMBER OR3-3 OR3-4 OR3-5 OR3-6 O
- Page 465:
44 NUMBER RESPONSE OR4-02 Please se
- Page 469:
This page intentionally left blank.
- Page 473:
This page intentionally left blank.
- Page 477:
This page intentionally left blank.
- Page 481:
60 NUMBER OR4-09 RESPONSE A major s
- Page 485:
64 NUMBER OR4-15 RESPONSE Under the
- Page 489:
68 Grouping: Organization Format: C
- Page 493:
72 NUMBER OR5-05 RESPONSE Public co
- Page 497:
76 Grouping: Organization Format: P
- Page 501:
80 Grouping: Organization Format: C
- Page 505:
84 NUMBER OR6-15 OR6-16 OR6-17 OR6-
- Page 509:
88 NUMBER OR6-30 OR6-31 OR6-32 OR6-
- Page 513:
This page intentionally left blank.
- Page 517:
96 Grouping: Organization Format: W
- Page 521 and 522:
100 NUMBER RESPONSE OR10-4 Please s
- Page 523 and 524:
102 Grouping: Organization Format:
- Page 525 and 526:
104 Grouping: Business Format: Web
- Page 527 and 528:
106 NUMBER RESPONSE B1-2 The effect
- Page 529 and 530:
108 NUMBER RESPONSE B1-3 Please see
- Page 531 and 532:
110 NUMBER RESPONSE B1-4 Each alter
- Page 533 and 534:
112 NUMBER RESPONSE B1-5 The discus
- Page 535 and 536:
114 NUMBER RESPONSE B1-7 Three of t
- Page 537 and 538:
116 NUMBER RESPONSE B1-8 The underw
- Page 539 and 540:
118 Grouping: Business Format: Comm
- Page 541 and 542:
120 NUMBER RESPONSE B2-2 Changes to
- Page 543 and 544:
122 Grouping: Business Format: Comm
- Page 545 and 546:
124 NUMBER RESPONSE B3-7 While Dund
- Page 547 and 548:
126 Grouping: Business Format: Publ
- Page 549 and 550:
This page intentionally left blank.
- Page 551 and 552:
130 Grouping: Business Format: Comm
- Page 553 and 554:
132 NUMBER RESPONSE B5-02 Each alte
- Page 555 and 556:
134 NUMBER RESPONSE B5-06 Under the
- Page 557 and 558:
136 NUMBER RESPONSE B5-11 The comme
- Page 559 and 560:
138 Grouping: Business Format: Comm
- Page 561 and 562:
140 NUMBER RESPONSE B7-2 The "based
- Page 563 and 564:
142 Grouping: Business Format: Web
- Page 565 and 566:
144 Grouping: Business Format: Comm
- Page 567 and 568:
146 NUMBER RESPONSE B9-02 Any futur
- Page 569 and 570:
148 NUMBER RESPONSE B9-05 The EIS r
- Page 571 and 572:
150 NUMBER RESPONSE B9-06 The Park
- Page 573 and 574:
152 NUMBER RESPONSE B9-08 In genera
- Page 575 and 576:
154 Grouping: Business Format: Comm
- Page 577 and 578:
156 NUMBER RESPONSE B10-3 The NPS p
- Page 579 and 580:
158 Grouping: Business Format: Web
- Page 581 and 582:
160 Grouping: Individual Format: Co
- Page 583 and 584:
162 Grouping: Individual Format: Co
- Page 585 and 586:
164 Grouping: Individual Format: Co
- Page 587 and 588:
166 Grouping: Individual Format: We
- Page 589 and 590:
168 Grouping: Individual Format: We
- Page 591 and 592:
170 Grouping: Individual Format: Co
- Page 593 and 594:
172 Grouping: Individual Format: We
- Page 595 and 596:
174 Grouping: Individual Format: We
- Page 597 and 598:
176 NUMBER RESPONSE I7-2 The Park S
- Page 599 and 600:
178 Grouping: Individual Format: We
- Page 601 and 602:
180 Grouping: Individual Format: We
- Page 603 and 604:
182 Grouping: Individual Format: Pu
- Page 605 and 606:
184 NUMBER RESPONSE I10-6 The admin
- Page 607 and 608:
186 Grouping: Individual Format: Co
- Page 609 and 610:
188 Grouping: Individual Format: Co
- Page 611 and 612:
190 Grouping: Individual Format: We
- Page 613 and 614:
192 Grouping: Individual Format: Co
- Page 615 and 616:
194 Grouping: Individual Format: Co
- Page 617 and 618:
196 Grouping: Individual Format: We
- Page 619 and 620:
198 Grouping: Individual Format: We
- Page 621 and 622:
200 Grouping: Individual Format: We
- Page 623 and 624:
202 NUMBER RESPONSE I19-2 Please se
- Page 625 and 626:
204 Grouping: Individual Format: Pu
- Page 627 and 628:
206 Grouping: Individual Format: Co
- Page 629 and 630:
208 Grouping: Individual Format: Pu
- Page 631 and 632:
210 NUMBER RESPONSE I22-01 The NPS
- Page 633 and 634:
This page intentionally left blank.
- Page 635 and 636:
214 Grouping: Individual Format: We
- Page 637 and 638:
216 Grouping: Individual Format: We
- Page 639 and 640:
218 Grouping: Individual Format: We
- Page 641 and 642:
220 Grouping: Individual Format: We
- Page 643 and 644:
222 Grouping: Individual Format: We
- Page 645 and 646:
224 Grouping: Individual Format: Pu
- Page 647 and 648:
226 NUMBER RESPONSE I28-3 The Park
- Page 649 and 650:
228 Grouping: Individual Format: We
- Page 651 and 652:
230 Grouping: Individual Format: We
- Page 653 and 654:
232 Grouping: Individual Format: We
- Page 655 and 656:
234 Grouping: Individual Format: We
- Page 657 and 658:
236 Grouping: Individual Format: We
- Page 659 and 660:
238 NUMBER RESPONSE I33-2 The emiss
- Page 661 and 662:
240 NUMBER RESPONSE I33-3 The 27 po
- Page 663 and 664:
242 NUMBER RESPONSE I33-4 The sulfu
- Page 665 and 666:
244 NUMBER RESPONSE I33-5 After rev
- Page 667 and 668:
246 NUMBER RESPONSE I33-6 The socio
- Page 669 and 670:
248 Grouping: Individual Format: Co
- Page 671 and 672:
250 Grouping: Individual Format: Pu
- Page 673 and 674:
252 NUMBER RESPONSE I35-2 Three of
- Page 675 and 676:
254 Grouping: Individual Format: We
- Page 677 and 678:
256 Grouping: Individual Format: Co
- Page 679 and 680:
258 Grouping: Individual Format: Co
- Page 681 and 682:
260 Grouping: Individual Format: We
- Page 683 and 684:
262 Grouping: Individual Format: Pu
- Page 685 and 686:
264 Grouping: Individual Format: We
- Page 687 and 688:
266 Grouping: Individual Format: We
- Page 689 and 690:
268 Grouping: Individual Format: We
- Page 691 and 692:
270 Grouping: Individual Format: We
- Page 693 and 694:
272 NUMBER RESPONSE I44-7 The FEIS
- Page 695 and 696:
274 Grouping: Individual Format: We
- Page 697 and 698:
276 Grouping: Individual Format: Pu
- Page 699 and 700:
278 NUMBER I45b-5 RESPONSE The Park
- Page 701 and 702:
280 NUMBER I45b-6 RESPONSE The NPS
- Page 703 and 704:
282 Grouping: Individual Format: Co
- Page 705 and 706:
284 Grouping: Individual Format: Co
- Page 707 and 708:
286 Grouping: Individual Format: We
- Page 709 and 710:
288 Grouping: Individual Format: Pu
- Page 711 and 712:
290 Grouping: Form Letter Format: F
- Page 713 and 714:
Names of the Senders of the Nationa
- Page 715 and 716:
Names of the Senders of the Nationa
- Page 717 and 718:
Names of the Senders of the Nationa
- Page 719:
Names of the Senders of the Nationa


