Final Technical Report - weADAPT
Final Technical Report - weADAPT
Final Technical Report - weADAPT
- No tags were found...

Create successful ePaper yourself
Turn your PDF publications into a flip-book with our unique Google optimized e-Paper software.
<strong>Final</strong> <strong>Technical</strong> <strong>Report</strong><br />
AIACC AS07<br />
Southeast Asia Regional Vulnerability to Changing Water Resource and<br />
Extreme Hydrological Events due to Climate Change<br />
Southeast Asia START Regional Center (SEA START RC),<br />
Old SWU Pathumwan 5 Building, 5 th Floor,<br />
Henri Dunant Road, Bangkok 10330, Thailand<br />
http://www.start.or.th<br />
Southeast Asia START Regional Center <strong>Technical</strong> <strong>Report</strong> No. 15<br />
Bangkok, September 2006<br />
<strong>Final</strong> technical report – AIACC AS07 1
Table of Contents<br />
Part 1: Project Information and Brief Summary<br />
Page<br />
1 Project Information 7<br />
1.1 Project title and AIACC reference number 7<br />
1.2 Abstract 7<br />
1.3 Investigators 8<br />
1.4 Administering institution 9<br />
1.5 Project funding and in-kind support 9<br />
1.6 Countries of primary focus 10<br />
1.7 Case study area 10<br />
1.8 Sectors studied 10<br />
1.9 Systems studied 10<br />
1.10 Group studied 10<br />
1.11 Sources of stress and change 10<br />
2 Executive Summary 11<br />
2.1 Research problems and objectives 11<br />
2.2 Approach 11<br />
2.2.1 Study on climate change and its impact on biophysical systems: modeling 12<br />
approach<br />
2.2.2 Assessment of vulnerability and adaptation to climate impact: field survey and 14<br />
multiple criteria analysis approach<br />
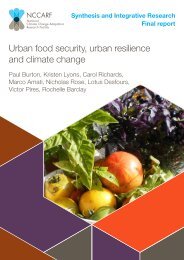
2.3 Scientific finding 14<br />
2.3.1 Future climate change in Southeast Asia: lower Mekong River basin 14<br />
2.3.2 Impact of climate change on hydrological regime: Mekong River’s tributaries 17<br />
2.3.3 Impact of climate change on rain-fed agriculture: rice cultivation 18<br />
2.3.4 Risk and vulnerability of rain-fed farmer in Southeast Asia to climate change 20<br />
2.3.5 Adaptation of rain-fed farmer in Southeast Asia to climate change 21<br />
2.4 Capacity building outcomes and remaining needs 23<br />
2.5 National Communications, science-policy linkages and stakeholder engagement 24<br />
2.6 Policy implications and future directions 25<br />
<strong>Final</strong> technical report – AIACC AS07 3
Part 2: Details <strong>Report</strong><br />
Page<br />
3 Introduction 27<br />
4 Characterization of Current Climate and Scenarios of Future Climate 28<br />
Change<br />
4.1 Activities Conducted: Development of high resolution regional climate scenario 28<br />
for the lower Mekong River region<br />
4.2 Description of Scientific Methods and Data 28<br />
4.3 Results: Climate change in lower Mekong River basin 31<br />
4.3.1 Change in future temperature in lower Mekong River basin 32<br />
4.3.2 Change in future precipitation in lower Mekong River basin 39<br />
4.4 Conclusion 40<br />
5 Impacts and vulnerability 42<br />
5.1 Activity conducted 42<br />
5.2 Study of impact of climate change on hydrological regime in lower Mekong 42<br />
River region<br />
5.2.1 Description of Scientific Methods and Data 42<br />
5.2.2 Results: Impact of climate change on discharge of Mekong River’s tributaries 46<br />
in Lao PDR and Thailand<br />
5.2.3 Conclusion 50<br />
5.3 Study of impact of climate change on rain-fed rice productivity in lower<br />
50<br />
Mekong River region<br />
5.3.1 Description of Scientific Methods and Data 50<br />
5.3.2 Results: Impact of climate change on rice productivity in lower Mekong River 51<br />
basin<br />
5.3.3 Conclusion 53<br />
5.4 Assessment on vulnerability and adaptation of rain-fed farmer in the lower 54<br />
Mekong River region to climate change<br />
5.4.1 Description of Scientific Methods and Data 54<br />
5.4.2 Result: Risk and vulnerability to climate impact of rain-fed farmer in lower 64<br />
Mekong River basin<br />
5.4.3 Conclusion 71<br />
6 Adaptation 74<br />
6.1 Activities Conducted: Assessment adaptation to climate change of rain-fed 75<br />
farmer in lower Mekong River basin<br />
6.2 Description of Scientific Methods and Data 75<br />
6.3 Results: Adaptation strategy of rain-fed farmer in lower Mekong River basin to 77<br />
climate impacts<br />
6.4 Conclusion 94<br />
7 Capacity Building Outcomes and Remaining Needs 97<br />
8 National Communications, Science-Policy Linkages and Stakeholder 99<br />
Engagement<br />
9 Outputs of the project 100<br />
10 Policy Implications and Future Directions 102<br />
<strong>Final</strong> technical report – AIACC AS07 4
Reference 103<br />
List of Figures and Tables 105<br />
Appendix 1: Rainy Season Pattern at Selected Cities in lower Mekong River 109<br />
Basin under Influence of Climate Change<br />
Appendix2: Result of Hydrological Regime Baseline Calculation and Model 113<br />
Calibration<br />
Appendix 3: Simulation Result of Hydrological Regime of major Sub-basins of 127<br />
Mekong River in Lao PDR and Thailand under Different Climate Scenarios<br />
<strong>Final</strong> technical report – AIACC AS07 5
Part 1: Project Information and brief summary<br />
1 Project Information<br />
1.1 Project title and AIACC reference number<br />
o Southeast Asia Regional Vulnerability to Changing Water Resource and Extreme<br />
Hydrological Events due to Climate Change<br />
o AIACC Regional Study AS07<br />
1.2 Abstract<br />
This research studied the impact of climate change on hydrological condition and<br />
rain-fed agriculture in Southeast Asia with focus on the lower Mekong River basin as<br />
well as assessed vulnerability and adaptation of rain-fed farmer to climate change impact.<br />
In this study, future climate scenarios were developed using climate model with given<br />
condition of increasing atmospheric CO 2 concentration from the baseline of 360ppm to<br />
540ppm and 720ppm (in other words, 1.5 and 2 times of baseline). The result from the<br />
simulation suggests that average temperature in the region tends to be slightly cooler<br />
under climate condition at CO 2 concentration of 540ppm but will be slightly warmer than<br />
baseline condition under climate condition at CO 2 concentration of 720ppm. The range of<br />
temperature change is 1-2ºC. The hot period of the year will extend longer and the cool<br />
period will be significantly shorter while the length of rainy season would remain the<br />
same, but with higher rainfall intensity. These changes in climate pattern will result in<br />
higher discharge of most of the Mekong River tributaries, which is higher proportion to<br />
the increasing in precipitation. Agriculture sector, especially rain-fed system will also be<br />
affected from change in climate pattern. The result from simulation using crop modeling<br />
technique shows that yield of rice productivity in the study site in Thailand will increase<br />
by 3-6%; but on the contrary, may reduce by almost 10% in the study site in Lao PDR.<br />
The rice production in the Mekong River delta in Viet Nam tends to have severe impact<br />
from climate change, especially summer-autumn crop production, of which the yield may<br />
reduce by over 40%. Change in rice productivity was used as proxy of climate change<br />
impact to assess risk and vulnerability of rain-fed farmer. The assessment shows that<br />
vulnerability to climate change impact of the farmers in the lower Mekong River region<br />
<strong>Final</strong> technical report – AIACC AS07 7
vary from place to place, according to degree of climate impact as well as socioeconomical<br />
and physical condition in each location. Result from farmer survey in<br />
selected communities in Lao PDR, Thailand and Vietnam shows adaptation strategy that<br />
is shaped by the socio-economic condition of their surrounding community. Farmers in<br />
communities with less developed socio-economic conditions, such as Lao PDR, tend to<br />
pursue simple strategies targeted at increasing coping capacity and sustaining basic needs<br />
that can be implemented at the household or community level with limited financial and<br />
other resources. Farmers in communities with more developed socio-economic conditions,<br />
as the case study in Thailand, tend to pursue strategies targeted at reducing the variability<br />
of income and at improving the productivity and resilience of their farms. The measures<br />
that they adopt tend to depend more on market and other institutions, improved<br />
technologies and financial resources than is the case for farmers in less developed<br />
communities.<br />
1.3 Investigator(s)<br />
Principle investigator<br />
1. Anond Snidvongs<br />
Southeast Asia START Regional Center (SEA START RC),<br />
5th Floor, Chulawich 1 Building,<br />
Chulalongkorn University,<br />
Henri Dunant Road,<br />
Bangkok 10330,<br />
Thailand<br />
Tel: (66) 2218 9464 to 7 Fax: (66) 2251 9416<br />
E-mail: anond@start.or.th<br />
Associates investigators (partial list - actively involved associates)<br />
1. Suppakorn Chinvanno, SEA START RC, Thailand<br />
2. Wirote Laongmanee, SEA START RC, Thailand<br />
3. Thanika Pancharat, SEA START RC, Thailand<br />
4. Weerasak Weerakant, SEA START RC, Thailand<br />
<strong>Final</strong> technical report – AIACC AS07 8
5. Attachai Jintrawet, Multiple Cropping Center, Chiang Mai University, Thailand<br />
6. Sahaschai Kongton, Land Development Department, Ministry of Agriculture,<br />
Thailand<br />
7. Vichien Kerdsuk, Research and Development Institute, Khon Kaen University,<br />
Thailand<br />
8. Vinai Sarawat, Khon Kaen Field Crop Research Center, Ministry of Agriculture,<br />
Thailand<br />
9. Sukit Ratanasriwong, Roi Et Agricultural Resources Service Center, Ministry of<br />
Agriculture, Thailand<br />
10. Chitnucha Buddhaboon, Prachinburi Rice Research Center, Ministry of<br />
Agriculture, Thailand<br />
11. Boontium Lersupavithnapa, Faculty of Agriculture, Ubonratchathani University,<br />
Thailand<br />
12. Thavone Inthavong, National Agriculture and Forestry Research Institute,<br />
Ministry of Agriculture, Lao PDR<br />
13. Somkhith Boulidam, Faculty of Social Science, National University of Laos, Lao<br />
PDR<br />
14. Nguyen Thi Hien Thuan, Sub-institute of Hydrometeorology of South Vietnam,<br />
Vietnam<br />
1.4 Administering institution<br />
Southeast Asia START Regional Center (SEA START RC)<br />
Old SWU Pathumwan 5 Building, 5 th Floor, Henri Dunant Road,<br />
Bangkok 10330, Thailand<br />
Tel: (66) 2218 9464 to 7 Fax: (66) 2251 9416<br />
1.5 Project funding and in-kind support<br />
AIACC<br />
158,000USD + 15,000USD<br />
APN (under CAPaBLE program)<br />
58,085USD<br />
Southeast Asia START Regional Center provides in-kind support in facilities,<br />
administrative support, equipments and tools.<br />
<strong>Final</strong> technical report – AIACC AS07 9
1.6 Countries of Primary Focus<br />
Thailand, Lao PDR, Viet Nam<br />
1.7 Case Study Areas<br />
The 3 study sites selected for the vulnerability and adaptation assessment are as follows,<br />
1. Ubon Ratchathani Province, Thailand<br />
2. Savannakhet Province, Lao PDR<br />
3. Mekong River delta, Viet Nam<br />
1.8 Sectors Studied<br />
Water resources<br />
Agriculture - rain-fed system<br />
1.9 Systems Studied<br />
Water resources<br />
Agriculture - rain-fed rice cultivation<br />
1.10 Groups Studied<br />
Livelihood groups - rain-fed farmer<br />
1.11 Sources of Stress and Change<br />
Change in climate pattern and extreme climate event.<br />
<strong>Final</strong> technical report – AIACC AS07 10
2 Executive Summary<br />
2.1 Research problems and objectives<br />
Research problems:<br />
o What are impacts of climate change on the hydrological regime and fresh water<br />
resources in Mekong River Basin<br />
o What are impacts of climate change on rain-fed rice productivity in Mekong River<br />
Basin<br />
o How would rain-fed farmer in the region be vulnerable to the impact of climate<br />
change<br />
o How would rain-fed farmer in the region adapt to impact of climate change<br />
Objectives:<br />
o To develop high resolution climate scenario - in terms of geographical and<br />
temporal<br />
o To understand the impact of climate change on regional hydrological regime and<br />
rain-fed agriculture in the Mekong River basin.<br />
o To develop and test framework and method to measure vulnerability of household<br />
in the community to climate impact.<br />
o To understand coping capacity and adaptation to climate impact of the rain-fed<br />
farmer in the lower Mekong River region.<br />
2.2 Approach<br />
This study can be divided into 2 parts, which used different approaches in the study.<br />
o The study on climate change and its impact on biophysical systems are based on the<br />
modeling approach. This area of study was focused on changes in climate pattern and<br />
its first order impact on hydrological condition and agriculture, particularly the rainfed<br />
system, in the region. Climate model was used to simulate high resolution future<br />
climate scenario. Climate change impact was analyzed by using future climate data<br />
from the simulation as input to hydrological model and crop model for further<br />
<strong>Final</strong> technical report – AIACC AS07 11
simulation on hydrological regime of the Mekong River sub-basins and potential crop<br />
productivity yield in the study sites.<br />
o Assessment of vulnerability and adaptation to climate impact were based on field<br />
survey by individual households interviewing and focus group meeting. The analysis<br />
on field interview data was based on quantitative analysis and multi-criteria method,<br />
which used multiple criteria and indicators developed for this case study.<br />
2.2.1 The study on climate change and its impact on biophysical systems: modeling<br />
approach<br />
o Study of climate change in Lower Mekong River Basin.<br />
The study of the climate change under this study is based on high-resolution<br />
regional climate scenario, which was simulated for the Southeast Asia region by<br />
regional climate modeling technique as the downscaling technique has been proven to<br />
be unable to give accurate result for the region. The Conformal Cubic Atmospheric<br />
Model (CCAM), which is the second-generation regional climate model developed<br />
specifically for Australasian region and developed by CSIRO Division of<br />
Atmospheric Research in Australia, was used and the output resolution was set at 0.1<br />
degree (approximately 10 km). The model uses the principle of stretched coordinate<br />
of a global model instead of uniform latitude-longitude gridding system and runs for<br />
18 vertical levels including the stratosphere. CCAM has also been evaluated in<br />
several international model inter-comparison exercises to be among the best climate<br />
model for Asian region (McGregor et al, 1998). The condition used for the simulation<br />
of climate change scenarios was the increasing of atmospheric CO 2 concentration<br />
from 360ppm, which was used as baseline in the analysis, to 540ppm and 720ppm.<br />
o Study of impact of climate change on hydrological regime in Lower Mekong River<br />
basin.<br />
The study of the climate change impact on hydrological regime was based on the<br />
Variable Infiltration Capacity (VIC) hydrological model. VIC is a macro-scale<br />
hydrologic model that solves full water and energy balances, originally developed by<br />
Xu Liang at the University of Washington.(Liang, et al, 1994) It is a semi-distributed<br />
grid-based hydrological model that parameterizes the dominant hydro meteorological<br />
<strong>Final</strong> technical report – AIACC AS07 12
processes taking place at the land surface - atmosphere interface. A mosaic<br />
representation of land surface cover, and sub grid parameterizations for infiltration<br />
and the spatial variability of precipitation, account for sub-grid scale heterogeneities<br />
in key hydrological processes. The model uses two soil layers and a vegetation layer<br />
with energy and moisture fluxes exchanged between the layers. Vegetation and soil<br />
characteristics associated with each grid cell are reflected in sets of vegetation and<br />
soil parameters. Parameters for vegetation types are specified in a user defined<br />
library of vegetation classes (usually derived from standard, national classification<br />
schemes), while their distribution over the gridded land surface area is specified in a<br />
vegetation parameter file. Soil characteristics (e.g. sand and clay percents, bulk<br />
density) can be represented for a user-defined number of vertical soil layers - usually<br />
two or three, divided into a thin upper layer and a secondary set of layers that extend<br />
several meters into the soil column (Lohman, et al, 1998).<br />
o Study of impact of climate change on rain-fed agriculture in Lower Mekong River<br />
Basin<br />
Crop model was used to simulate future potential yield of rice productivity in the<br />
region under different climate conditions from the scenarios simulated by climate<br />
model. Decision Support System for Agro Technology Transfers (DSSAT version<br />
4.0) crop modeling software (Hoogenboom et al, 1998) was selected as simulation<br />
tool in this. The crop modeling software used daily climate data from the climate<br />
simulation, including maximum and minimum temperature, precipitation, solar<br />
radiation, etc., coupled with crop management scheme and soil property to calculate<br />
potential yield of rice in the study area. By using daily climate data for the simulation<br />
process, this study is able to capture the impact of climate change on rain-fed rice<br />
production not only in terms of the change in degree of intensity of each climate<br />
parameter, e.g. increase or decrease in rainfall or temperature, but also change in<br />
temporal aspect too, e.g. shifting of the onset or changing on the length of raining<br />
season or change in the pattern of mid-season dry spell period, etc.<br />
<strong>Final</strong> technical report – AIACC AS07 13
2.2.2 Assessment of vulnerability and adaptation to climate impact: field survey approach<br />
The assessment on risk and vulnerability of rain-fed farmer to climate impact in this<br />
study was based on field survey to collect data for the analysis of baseline livelihood of<br />
rain-fed farmers in the selected study sites, and also for multi-criteria analysis in<br />
measuring risk to climate impact. The three criteria used in this study in the assessing<br />
farmer’s risk to climate impact are as follows;<br />
o Household economic condition, which was used to measure the sensitivity of the<br />
farmer household to climate impact.<br />
o Dependency on on-farm production, which was used to measure the exposure of<br />
the farmer household to climate impact.<br />
o Coping capacity to climate impact.<br />
Change in rice productivity under influence of climate change and extreme climate<br />
event was used as proxy of threat from climate impact in the analysis process. Adaptation<br />
to climate change was also assessed by field interview and local stakeholders meeting,<br />
which mainly focus on the opinion of the farmers in the study sites.<br />
2.3 Scientific findings<br />
2.3.1 Future climate change in Southeast Asia: lower Mekong River basin<br />
The climate scenario simulation in this study was<br />
conducted for the whole region of Southeast Asia and also<br />
southern part of People Republic of China for the period of<br />
10 years at each atmospheric CO 2 concentration level.<br />
However, the analysis and verification/adjusting process<br />
was focused on the Lower Mekong River basin in Lao PDR,<br />
Thailand and Vietnam only. This is due to the limited<br />
availability of the observed climate date which is required<br />
for adjusting process.<br />
Figure 1: Focus area of climate<br />
change scenario analysis<br />
The climate scenario shows that the region tends to get slightly cooler under<br />
climate condition at CO 2 concentration of 540ppm but will be warmer under climate<br />
condition at CO 2 concentration of 720ppm. However, change in temperature under this<br />
<strong>Final</strong> technical report – AIACC AS07 14
set of climate scenario will be within range of 1-2 ºC, but the change in number of annual<br />
hot and cool days will be prominent. Hot day, which defined as the day with maximum<br />
temperature over 33ºC, will increase by 2-3 weeks and the cool days, which defined as<br />
the day with minimum temperature under 15ºC, will reduce also by 2-3 weeks throughout<br />
the region. In other words, summer time in the region will be significantly longer in the<br />
future.<br />
Figure 2: Average temperature in the lower Mekong River basin (baseline simulation) and<br />
comparison analysis to show future change<br />
Figure 3: Number of annual “hot day” in the lower Mekong River basin (baseline simulation)<br />
and comparison analysis to show future change<br />
<strong>Final</strong> technical report – AIACC AS07 15
Figure 4: Number of annual “cool day” in the lower Mekong River basin (baseline<br />
simulation) and comparison analysis to show future change<br />
The simulation result shows trend of increasing precipitation by 10-30%<br />
throughout the region under future climate condition at CO 2 concentration of 540ppm and<br />
720ppm, especially in the eastern and southern part of Lao PDR (see Figure 5).<br />
Figure 5: Average rainfall in the lower Mekong River basin (baseline simulation) and<br />
comparison analysis to show future change<br />
<strong>Final</strong> technical report – AIACC AS07 16
2.3.2 Impact of climate change on hydrological regime: Mekong River’s tributaries<br />
As CCAM climate model generated a snap shot of one decade climate condition<br />
under different CO 2 concentration conditions, data on wettest year and driest year of the<br />
decade were used for hydrological regime simulation, in order to analyze plausible range<br />
of hydrological change under future climate condition. The simulation result from VIC<br />
hydrological model, which focused on major Mekong River tributaries in Lao PDR and<br />
Thailand, shows that most of the sub-basins tend to have higher discharge under impact<br />
of climate change.<br />
<strong>Final</strong> technical report – AIACC AS07 17
Figure 6: Change in discharge of Mekong River tributaries in Lao PDR and Thailand<br />
under different climate scenarios<br />
2.3.3 Impact of climate change on rain-fed agriculture: rice cultivation<br />
The study of impact of climate change on rice productivity in Southeast Asia was<br />
conducted in 3 study sites selected in Lao PDR, Thailand and in the Mekong River delta<br />
in Vietnam.<br />
Figure 7: Selected study sites on impact of climate change on rice productivity in<br />
Southeast Asia<br />
<strong>Final</strong> technical report – AIACC AS07 18
From the mathematic model simulation using DSSAT crop model, the result<br />
shows that future climate condition, according to the climate scenario from CCAM<br />
climate model, may have slight negative impact on the rain-fed rice production in the<br />
study site in Lao PDR, Savannakhet province. The yield of rice productivity in<br />
Savannakhet province would reduced by almost 10% under climate condition at CO 2<br />
concentration of 540 ppm, but will be back to almost the same as baseline condition<br />
under the climate condition at CO 2 concentration of 720 ppm.<br />
For the case study in Thailand, the simulation result shows that climate change<br />
has positive impact on the rice productivity in the study area in Ubonratchathani province.<br />
The simulation shows trend of increasing in yield of rice productivity under future<br />
climate condition. The increase in productivity yield could be as high as 10-15% in some<br />
areas.<br />
In Viet Nam, where farmer grows 2 crop cycles in a year, the simulation result<br />
shows different climate impacts on yield of rice productivity in each crop cycle. The<br />
winter-spring crop will get slight impact from climate change as the yield will increase<br />
slightly from baseline year under climate condition at atmospheric CO 2 concentration of<br />
540 ppm, but will drop slightly from baseline year under climate condition at CO 2<br />
concentration of 720 ppm. However, the summer-autumn crop tends to get severe impact<br />
from climate change. The simulation shows significant decline in summer-autumn crop<br />
productivity by approximately 8-12% under climate condition at CO 2 concentration of<br />
540 ppm and would sharply drop up to almost 50% in some areas under climate condition<br />
at CO 2 concentration of 720 ppm.<br />
<strong>Final</strong> technical report – AIACC AS07 19
The study sites and analysis result from crop model calculation that shows impact<br />
of climate change on rain-fed rice cultivation are as follows:<br />
Lao PDR<br />
Location<br />
Savannakhet Province<br />
Impact of climate change on rice productivity<br />
Climate condition under different<br />
atmospheric CO 2 concentration<br />
Remark: Rice yield shown in kg/ha<br />
Change in % compare to<br />
baseline period<br />
360 ppm 540 ppm 720 ppm 540ppm 720ppm<br />
Songkhone District 2,534.90 2,303.20 2,470.10 -9.14 -2.56<br />
Thailand<br />
Ubonratchathani Province<br />
Zone 1 1,154.39 1,235.14 1,330.85 7.00 15.29<br />
Zone 2 1,919.61 2,002.15 2,072.04 4.30 7.94<br />
Zone 3 2,363.70 2,407.62 2,438.92 1.86 3.18<br />
Zone 4 2,542.32 2,575.03 2,591.89 1.29 1.95<br />
Zone 5 3,024.18 3,051.44 3,068.82 0.90 1.48<br />
Viet Nam<br />
An Giang Province<br />
Winter-Spring crop 5,592.00 5,741.33 5,357.00 2.67 -4.20<br />
Summer-Autumn crop 4,830.33 4,439.33 2,858.00 -8.09 -40.83<br />
Can Tho Province<br />
Winter-Spring crop 5,799.67 5,971.00 5,361.33 2.95 -7.56<br />
Summer-Autumn crop 6,778.67 6,783.33 5,627.00 0.07 -16.99<br />
Dong Thap<br />
Winter-Spring crop 5,578.00 5,877.33 5,153.33 5.37 -7.61<br />
Summer-Autumn crop 4,830.33 4,214.67 2,545.67 -12.75 -47.30<br />
Long An Province<br />
Winter-Spring crop 5,601.33 5,855.00 5,128.67 4.53 -8.44<br />
Summer-Autumn crop 6,646.67 6,535.00 5,301.67 -1.68 -20.24<br />
Table 1: Simulated yield of rice productivity at the 3 study sites under different climate<br />
scenarios<br />
2.3.4 Risk and vulnerability of rain-fed farmer in Southeast Asia to climate change<br />
The countries of the lower Mekong River region, being agriculture base country,<br />
have vast population of the rain-fed farmer, whose livelihood relies on the rice production<br />
and could seriously be affected from impact of climate change. The assessment on<br />
household risk to climate change impact was based on change in rice productivity of each<br />
household according to climate impact scenarios, which derived from the simulation and<br />
<strong>Final</strong> technical report – AIACC AS07 20
also coupled with influence of climate variability based on farmers’ perspective. The<br />
analysis of surveyed data, which focused on change in rice productivity under different<br />
climate scenarios and its impact on farmers’ livelihood condition, showed that<br />
vulnerability is site-specific condition, which depends upon the degree of climate impact<br />
and socio-economic condition as well as physical condition of each site. The profile of<br />
risk to climate change impact would differ from community to community.<br />
The case study in Lao PDR shows that livelihood condition of farmer in Lao PDR<br />
is low risk to climate impact, even though large number of population may be vulnerable<br />
under certain conditions. Under climate condition at CO 2 concentration of 540ppm, over<br />
80% of surveyed population in Lao PDR is classified under low risk category, while<br />
approximately 10% is in moderate risk and only slightly over 5% is in high risk<br />
categories. There is no substantial different between the situation under normal condition<br />
and extreme climate event situation. When compare to the baseline condition, the impact<br />
of climate change under normal condition would cause almost one-fifth of surveyed<br />
population in Lao PDR to be vulnerable and more than half of the population would be<br />
vulnerable in situation of extreme climate event coupled with climate change impact.<br />
In the case study sites in Thailand, baseline risk assessment shows that<br />
approximately one-third of survey population is low risk to climate impact, while the<br />
moderate risk group is the largest group, which account for approximately 40-50% of the<br />
surveyed population. Climate change has favorable impact on rice cultivation, but it<br />
cannot cover the influence extreme climate event and cause large portion of population to<br />
be vulnerable. In this case, many of those households in moderate risk group moved to<br />
high risk group.<br />
The impact of climate change under climate condition at atmospheric CO 2<br />
concentration of 720 ppm causes only slightly change in rice productivity from the<br />
condition under climate condition when CO 2 concentration is 540 ppm, therefore, has<br />
little effect to the risk grouping in both case studies in Lao PDR and Thailand.<br />
2.3.5 Adaptation of rain-fed farmer in Southeast Asia to climate change<br />
Rice farmers in the Southeast Asia region are experienced in managing climate<br />
risks and employ a variety of measures to reduce their vulnerability that are highly place<br />
<strong>Final</strong> technical report – AIACC AS07 21
and time specific. The measures used differ according to the specific climate hazards<br />
faced, physical and environmental constraints, available technologies, social and<br />
economic condition of the farm household and community, vitality of community<br />
institutions, degree of engagement in the market economy, market conditions, and the<br />
priorities and objectives of the farm households. Results from surveys of farmers in<br />
selected communities of Lao PDR, Thailand and Vietnam suggest a pattern that is shaped<br />
by the socio-economic condition of their surrounding community. Surveyed farmers<br />
identified numerous practices currently in use in their communities in Lao PDR, Thailand<br />
and that in their consideration lessen their vulnerability to present day climate variability<br />
and hazards. Some of the measures are motivated primarily by climate risks, while others<br />
are motivated by other concerns yet nonetheless reduce climate risks by increasing the<br />
resilience of farmers’ livelihoods to multiple sources of stress. They include measures<br />
that are implemented at the individual farm-level, the community-level, and the nationallevel.<br />
Farmers of the Lao PDR study sites tend to rely mostly on farm level measures<br />
for adapting to climate hazards and to a lesser degree on collective actions at the<br />
community level. Measures at the national level are very limited. Consequently, the<br />
capacity of the individual farm household to adapt is a key limiting factor at present for<br />
managing climate risks. Their responses to climate hazards aim mainly at basic<br />
household needs, primarily food security of the household. Common measures<br />
implemented by rice farmers include seasonal changes in seed variety, cultivation<br />
methods, and timing of farm management tasks based upon seasonal climate forecasts<br />
made with indigenous knowledge. Also common are raising livestock, and harvesting<br />
natural products for additional food and income.<br />
Farmers at the study sites in Thailand tend to rely on household and national level<br />
measures for reducing climate risks, while the role of community level measures has<br />
declined or been neglected. The household level measures focus on income<br />
diversification, primarily from off-farm sources that are not as sensitive to climate<br />
variations as income from rice. The main practice is seasonal migration to work in the<br />
cities, which can lead to the permanent migration of some members of the family in order<br />
to secure fixed income for the household. Wage income from city employment is less<br />
<strong>Final</strong> technical report – AIACC AS07 22
sensitive to climate and helps to insulate the farm household from climate driven<br />
variations in farm income. Seasonal and permanent migration to diversify and<br />
supplement household incomes are more common in the Thai study sites than in Lao<br />
PDR and Vietnam and are made possible by close links between the rural villages an<br />
urban areas where there is demand for labor.<br />
The rain-fed rice farmer in Vietnam tends to rely on measures implemented at the<br />
household level and aimed mainly toward on-farm actions to protect against climate<br />
hazards. Community and national level measures play very limited role in reducing their<br />
climate risks. The farm-level solutions include efforts and investments to increase and<br />
sustain the productivity of their farms such as construction and maintenance of small<br />
scale irrigation systems or embankments to protect their farmland from flood. But<br />
investment costs and limited financial capacity of farmers limit wider use of these<br />
measures. Using an alternative strategy, some farmers in the study sites have adapted to<br />
flood by accepting floods as part of the ecosystems of their farmland, adjusting their the<br />
crop calendar accordingly and allowing their lands to be flooded, thereby gaining<br />
advantages from nutrients being deposited that enhance soil fertility and pollutants being<br />
washed from their farmland. In addition, use of alternate crops and seed varieties are also<br />
common adaptation measures of the farmer in the Mekong River delta in Vietnam.<br />
2.4 Capacity building outcomes and remaining needs<br />
The research capacity in climate change study is limited in the Southeast Asian<br />
countries, particularly in the vulnerability and adaptation to climate change. The activities<br />
under this research had contributed in helping to bring these countries, particularly Lao<br />
PDR and Thailand, up to speed in the study and assessment on the impacts, vulnerability<br />
and adaptation to climate change. The activities under this research served as hand-on<br />
exercise for the researchers to conduct study on the climate change related issues.<br />
More than 20 researchers and research assistants from 3 countries, who had<br />
actively participated in this research, are from the following institutes:<br />
o Chulalongkorn University, Thailand<br />
o Chiang Mai University, Thailand<br />
o Mahidol University, Thailand<br />
<strong>Final</strong> technical report – AIACC AS07 23
o Khon Kaen University, Thailand<br />
o Ubonratchathani University, Thailand<br />
o Meteorological Department, Ministry of Science, Thailand<br />
o Department of Agriculture, Ministry of Agriculture, Thailand<br />
o Land Development Department, Ministry of Agriculture, Thailand<br />
o National University of Laos, Lao PDR<br />
o National Agriculture and Forestry Research Institute, Ministry of Agriculture, Lao<br />
PDR<br />
o Environmental Research Institute, Science Technology and Environment Agency,<br />
Lao PDR<br />
o Water Resource Coordinating Committee, Office of the Prime Minister, Lao PDR<br />
o Sub-institute of Hydrometeorology of South Vietnam, Vietnam<br />
The researchers from these institutes had formed up a network, which was<br />
initiated from their involvement in various processes in this pilot study. The study on<br />
climate change and its impact as well as vulnerability and adaptation of various systems<br />
and sectors still need to be further developed and expanded to wider range of research<br />
network in the Southeast Asia region. More local research capacity needs to be developed,<br />
which include the capacity of researcher itself as well as the network of collaboration<br />
among the institutions and also forum to exchange research results and develop further<br />
joint activity that may lead to further policy implementation.<br />
In addition, tools, dataset, methodology, and approaches, which were developed<br />
and used in this study, are made available to academic society and may be used as<br />
foundation for other climate change research in the future. However, tools and data which<br />
are vital for future study in climate change are still very much needed or be further<br />
improved. Among various tools and data needed are climate model to generate high<br />
resolution climate scenarios, which should be implemented locally within the region, in<br />
order to create diversity for robustness on climate impact analysis.<br />
2.5 National Communications, Science-Policy Linkages and Stakeholder Engagement<br />
The next Second National Communications to UNFCCC would emphasize<br />
substantially more on the impacts of climate change on natural system and human society<br />
<strong>Final</strong> technical report – AIACC AS07 24
than its first generation, yet expertise and know-how to assess and formulate adaptive<br />
strategy in systematic ways are still much lacking in the Mekong River countries. The<br />
activities under this research had helped in develop research capacity of both personnel as<br />
well as network among institutions in Lao PDR, Thailand and Viet Nam to be able to<br />
assist or responsible in the preparation of the next National Communications to UNFCCC.<br />
In addition, the result from the activities under this research, which includes tool,<br />
data, methodology, analysis summary, etc., such as model and dataset, high resolution<br />
regional climate scenario, analysis on impact of climate change on hydrological regime<br />
and crop productivity, etc., would be summarized and disseminated to relevant policy<br />
makers as well as other stakeholders in the Southeast Asia region for further study in<br />
wider scale as well as be used in future policy consideration.<br />
However, as the preparation of the second National Communications to UNFCCC<br />
of the countries where this research had focused upon (Lao PDR, Viet Nam and<br />
Thailand) has not yet started, therefore, there has been no direct involvement or<br />
contribution from this research to the National Communications yet. But as far as the<br />
science-policy linkage is concerned, the principle investigator of this research, Dr.Anond<br />
Snidvongs, was appointed a member of National Climate Change Committee of Thailand<br />
and an associate investigator, Mr.Suppakorn Chinvanno, was also appointed a member of<br />
working group in developing national climate change strategy for Thailand.<br />
2.6 Policy implications and future directions<br />
This pilot study project has raised awareness among policy maker and public<br />
sectors in the region regarding the climate change issues; however, in developing the<br />
climate change policy, the policy maker still requires more explicit answer regarding<br />
climate change impact, vulnerability and adaptation on various key systems, which need<br />
more study to confirm. In addition, the study on climate change impact under this<br />
regional study is base on long timescale, which is too long for the policy planning scope<br />
of any country in the region. Future study may need to focus on the issue of climate<br />
change impact in shorter timescale or address more on the climate variability that may<br />
change its pattern from climate change influence. Furthermore, more involvement from<br />
the policy maker and policy implementing agency should also be planned for the future<br />
<strong>Final</strong> technical report – AIACC AS07 25
activity. Pilot implementation, which may help building resilience to climate impact that<br />
has immediate as well as long-term benefit, such as seasonal climate forecast, may be<br />
further explored and pilot test be implemented.<br />
The climate change has impact on both bio-physical systems as well as socioeconomic<br />
aspects, and in many cases, need to be considered in regional scale as it may<br />
impact large geographic coverage and may have consequences that are trans-boundary.<br />
Furthermore, the efforts to cope with climate change impact in one location may cause<br />
side effect the other locations or systems or sectors, which could also be trans-boundary<br />
issue. This call for regional collaboration to jointly look into the issues together in order<br />
to establish and share common understanding on the impact and adaptation in bigger<br />
picture at regional scale, of which would ultimately lead to the adaptation strategy that<br />
could be implemented collectively under holistic approach to achieve better efficiency<br />
and effectiveness in coping with the climate stress and also help avoid conflict that may<br />
arise from discreet planning and implementation.<br />
<strong>Final</strong> technical report – AIACC AS07 26
Part 2: Details <strong>Report</strong><br />
3 Introduction<br />
This research studied the impact of climate change on hydrological regime and rain-fed<br />
agriculture in Southeast Asia, which focused on lower Mekong River basin region. In<br />
addition to study impact of climate change on bio-physical systems, this research also<br />
assessed risk, vulnerability and adaptation of rain-fed farmer in the region to climate change<br />
and variability.<br />
The objectives of this research are not only to find the answers to the research problems,<br />
but also to serve as pilot project to build research capacity in this discipline. The coverage of<br />
the activities under this research, which spanned across 3 countries in the lower Mekong<br />
River region - Lao PDR, Thailand and Vietnam, had established a network of researchers that<br />
may initiate more collaboration in the future for benefit of the region.<br />
In addition, this research also aimed to develop framework of study, methodology, tool<br />
and dataset that can be used for other study in the future. Among various outcomes of this<br />
research, high resolution future climate scenario of the region is an important deliverable that<br />
can be used for the study of climate change impact on various sectors and systems in the<br />
future. Risk and vulnerability assessment method, which was developed under this research,<br />
may also be used as guideline in the future assessment, even though they still need to be<br />
further improved. The activities under this research also serve as the demonstration on the<br />
scenario-based approach study. In addition, it also points out that the study on impact of<br />
climate change need to be conducted with site specific or place-based approach, therefore,<br />
the national or regional assessment would need to be conducted in wide scale with the issue<br />
of trans-boundary impact well aware.<br />
This research also aimed to raise awareness of climate change issues among the policy<br />
makers and public sectors through series of workshop, meetings and published articles as<br />
well as to stimulate more studies in the future.<br />
<strong>Final</strong> technical report – AIACC AS07 27
4 Characterization of Current Climate and Scenarios of Future Climate<br />
Change<br />
4.1 Activities Conducted: Development of high resolution regional climate scenario for<br />
the lower Mekong River region<br />
4.2 Description of Scientific Methods and Data<br />
This research had developed high resolution climate scenario for Southeast Asia<br />
region. The simulated climate scenario provides high resolution daily climate data at the<br />
resolution of 0.1 degree (approx. 10km), which would then be used as input for<br />
hydrological and crop model.<br />
The climate model used for this simulation is Conformal Cubic Atmospheric<br />
Model (CCAM), which is the second-generation regional climate model developed<br />
specifically for Australasian region by the CSIRO Division of Atmospheric Research in<br />
Australia. (McGregor et al, 1998) CCAM has also been evaluates in several international<br />
model inter-comparison exercises to be among the best climate model for Asian region.<br />
The model uses the principle of stretched coordinate of a global model instead of uniform<br />
latitude-longitude grid system, which helps minimizing<br />
‘bouncing’ effect at the boundary. This technique has<br />
advantage over the downscaling technique, which has<br />
been proven to be unable to give accurate result for the<br />
region. The simulation process in this “stretched grid<br />
technique” will make calculation for the specific area at<br />
high resolution while calculate the area further away at<br />
lower resolution in order to save computing time. Such<br />
technique has an important advantage that it can<br />
Figure 8: Stretched-grid with<br />
produce very high-resolution climate projections for controlled boundary in the study area<br />
the target study area, the output resolution was set at 0.1 degree (about 10 km). The<br />
CCAM model runs for 18 vertical levels including the stratosphere. It also allows for<br />
other features, such as land and sea surfaces surface land form and land cover be varied<br />
and climate be simulated under different combinations of atmospheric and land surface<br />
<strong>Final</strong> technical report – AIACC AS07 28
forcing. It also addresses both climate change and climate variability and the most<br />
important feature is that it generates daily climate output which is necessary for<br />
downstream impact study, e.g. for use in the modeling of hydrological regime and crop<br />
production.<br />
The driving force that was used for generating this set of climate scenarios was<br />
the increasing of atmospheric CO 2 concentration, as CO 2 is the largest contributor to<br />
anthropogenic radiative forcing of the atmosphere (SRES, 2000). The future climate<br />
scenarios were simulated based on the condition of different atmospheric CO 2<br />
concentration levels. The atmospheric CO 2 concentration of 360 ppm, which is the CO 2<br />
concentration level approximately at present time (or to be more precise such condition<br />
was around the decade of the 1980s), was used for simulating baseline climate scenario.<br />
The climate scenarios for future were simulated at CO 2 concentration of 540 ppm and<br />
720 ppm (or at 1.5 time and double of baseline condition).<br />
The coverage of climate simulation under this study is as per illustration below:<br />
Figure 9: Geographical coverage of the CCAM simulation –<br />
Southeast Asia and southern region of People Republic of China<br />
The result from climate simulation still require further analysis and adjusting<br />
based on observed climate data during the baseline period. Even though, the climate<br />
<strong>Final</strong> technical report – AIACC AS07 29
model simulation was conducted for the whole region of Southeast Asia and also<br />
southern part of People Republic of China, but the analysis and adjusting were performed<br />
only on the lower region of Mekong River basin in Lao PDR, Thailand and Vietnam only<br />
due to the limited availability of the observed climate date which is required for adjusting<br />
process. The analysis of climate scenario in Cambodia area was also excluded under this<br />
study due to insufficient data from Cambodia. The focused area of study, which covers<br />
most part of Lao PDR, northeastern part of Thailand and Mekong River delta in Viet<br />
Nam, is shown in the illustration below:<br />
Figure 10: Geographic coverage of the analysis on climate change –<br />
Mekong River basin in Lao PDR, Thailand and Viet Nam<br />
The statistical adjustment process is based on cumulative rainfall using a nonlinear<br />
function (log-log regression) to exponentially increase the daily variability. An<br />
arbitrary rainfall threshold of 3 mm/day was applied to reduce number of rain days. The<br />
observed data used for the adjusting of future climate information are from:<br />
• Meteorology and Hydrology Department, Ministry of Agriculture and Forestry,<br />
Lao PDR<br />
• Meteorological Department, Ministry of Science and Technology, Thailand<br />
• Sub-institute of Hydrometeorology of South Vietnam, Vietnam<br />
<strong>Final</strong> technical report – AIACC AS07 30
Observed rainfall data from 23 meteorological observation stations from 3<br />
countries during the period of 1980s was used for climate scenario adjusting. The name<br />
and location of those stations are as shown in the illustration below:<br />
Figure 11: Location of meteorological stations that provide observed<br />
data for rainfall calibration process<br />
4.3 Results: Climate change in lower Mekong River basin<br />
The result of the climate simulation is the daily climate data for the period of 10<br />
years of climate condition at atmospheric CO 2 concentrations of<br />
360ppm/540ppm/720ppm. The climate parameters from the simulation include:<br />
• Daily maximum, minimum and average temperature ( o C)<br />
• Specific humidity (kg/kg)<br />
• Heat flux (W/m 2 )<br />
• Pressure (hPa)<br />
• Cloud cover (%)<br />
<strong>Final</strong> technical report – AIACC AS07 31
• Rainfall (mm/d)<br />
• Wind speed (m/s) and direction<br />
• Radiation (W/m 2 )<br />
The summary on future climate change focuses on 2 primary parameters:<br />
temperature and precipitation.<br />
4.3.1 Change in future temperature in lower Mekong River basin<br />
The result from simulation shows that the region tends to get slightly cooler under<br />
climate condition at CO 2 concentration of 540ppm and will change to be warmer under<br />
climate condition at CO 2 concentration of 720ppm. The illustrations below show the 10-<br />
year average temperature in the study area under climate condition at each different CO 2<br />
concentration level (360/540/720 ppm).<br />
Figure 12: Baseline average temperature in the study area under climate condition at<br />
CO 2 concentration of 360 ppm<br />
<strong>Final</strong> technical report – AIACC AS07 32
Figure 13: Future temperature in the study area –<br />
Average temperature under climate condition at CO 2 concentration of 540ppm and 720ppm<br />
Figure 14: Baseline average temperature lower Mekong River basin and future change<br />
<strong>Final</strong> technical report – AIACC AS07 33
According to the simulation result, temperature change in the future will vary<br />
from baseline condition within the range of 1-2ºC. This will occur during the dry period<br />
of the year, which can be seen by looking at the 10-year average daily temperature at<br />
different time of the year. The tables below is the summary on average minimum and<br />
maximum temperature, which is extracted for demonstration at 7 major cities in the<br />
region, was prepared for the month of January, which is winter or cool period of the year,<br />
April, which is summertime and July/Oct, which represent the beginning and end of rainy<br />
season.<br />
Figure 15: Locations of major cities selected to illustrate the<br />
impact of climate change on temperature in different seasons<br />
According to the simulation result, change in temperature in the future will occur<br />
in the winter and summertime, while the temperature during rainy season would remain<br />
almost unchanged, see Table 2 and Table 3.<br />
<strong>Final</strong> technical report – AIACC AS07 34
10-year Averaged Minimum Temperature<br />
UNIT: Degree Celsius<br />
Country City Lat. Long. Climate Jan Apr Jul Oct<br />
scenario:<br />
CO 2 level<br />
Vietnam Can Tho 10.05 105.75 360 20.1 23.5 23.4 22.6<br />
540 20.2 23.3 23.7 22.9<br />
720 21.4 24.5 24.6 23.7<br />
Lao PDR LuangPrabang 19.85 102.15 360 8.6 18.5 18.1 14.5<br />
540 7.8 19.5 18.5 14.4<br />
720 9.7 20.0 19.5 15.1<br />
Vientiane 18.05 102.55 360 14.5 25.0 22.2 20.2<br />
540 13.8 24.5 22.4 19.9<br />
720 15.8 27.0 23.2 20.5<br />
Pakse 15.15 105.75 360 17.1 23.6 20.9 20.4<br />
540 16.6 23.6 21.3 20.6<br />
720 18.4 24.9 22.0 21.0<br />
Thailand Nakhon Ratchasima 14.95 102.05 360 14.0 22.9 22.1 19.1<br />
(Korat) 540 13.3 23.0 22.4 18.8<br />
720 15.3 24.3 23.4 19.4<br />
Khon Kaen 16.45 102.85 360 15.5 26.4 22.3 20.3<br />
540 14.9 26.2 22.4 20.1<br />
720 16.9 27.7 23.3 20.6<br />
Nakhon Phanom 17.45 104.75 360 15.7 25.7 22.0 20.7<br />
540 14.8 25.6 22.2 20.6<br />
720 16.9 27.2 22.9 21.1<br />
Table 2: Average minimum temperature in major cities at different seasons under climate condition at<br />
CO 2 concentration of 360ppm, 540ppm and 720ppm.<br />
<strong>Final</strong> technical report – AIACC AS07 35
10-year Averaged Maximum Temperature<br />
UNIT: Degree Celsius<br />
Country City Lat. Long. Climate Jan Apr Jul Oct<br />
scenario:<br />
CO 2 level<br />
Vietnam Can Tho 10.05 105.75 360 28.6 34.6 29.0 29.9<br />
540 28.6 34.4 29.5 30.2<br />
720 30.0 35.8 30.2 30.6<br />
Lao PDR LuangPrabang 19.85 102.15 360 23.4 33.6 28.4 27.6<br />
540 22.6 33.9 28.0 26.4<br />
720 24.3 35.0 28.4 26.7<br />
Vientiane 18.05 102.55 360 28.5 39.4 31.6 29.1<br />
540 27.8 39.6 31.4 29.0<br />
720 29.6 41.1 32.0 29.4<br />
Pakse 15.15 105.75 360 28.4 35.8 27.3 28.4<br />
540 28.3 36.0 27.6 28.8<br />
720 30.0 37.5 28.1 28.7<br />
Thailand Nakhon Ratchasima 14.95 102.05 360 28.0 36.6 31.0 29.4<br />
(Korat) 540 27.0 37.0 31.3 29.4<br />
720 29.0 37.9 32.3 29.7<br />
Khon Kaen 16.45 102.85 360 27.8 38.6 29.6 28.8<br />
540 27.0 38.8 29.4 28.8<br />
720 28.9 40.1 30.1 28.9<br />
Nakhon Phanom 17.45 104.75 360 28.0 38.4 28.4 28.4<br />
540 27.3 38.7 28.5 28.6<br />
720 29.4 40.1 29.1 29.0<br />
Table 3: Average maximum temperature in major cities at different seasons under climate condition at<br />
CO 2 concentration of 360ppm, 540ppm and 720ppm.<br />
In addition to the change in minimum and maximum temperature, another<br />
indicator that shows change in regional temperature is the number of hot and cool days in<br />
a year. Even though the average temperature may change within the range of 2ºC,<br />
however, number of hot days will increase and number of cool days will reduce<br />
significantly. In other words, the summer tends to get longer and winter time will be<br />
shorter. The “hot day” in this study is defined as the day that maximum temperature is<br />
over 33ºC and the “cool day” is the day that minimum temperature is below 15ºC. Under<br />
the climate condition of CO 2 concentration at 540 ppm, the number of annual hot day will<br />
slightly reduce from baseline as the region tend to be slightly cooler, but the hot period<br />
<strong>Final</strong> technical report – AIACC AS07 36
will expand by 3-4 weeks throughout the region under the climate condition when the<br />
level of CO 2 rises to 720 ppm as per illustration below.<br />
Figure 16: Change in number of annual “hot day” in the study area<br />
The table below shows change in number of annual hot day at the major cites in<br />
the region.<br />
Number of annual hot day at different cities in the region<br />
Location<br />
Climate<br />
scenario:<br />
CO 2 = 360 ppm<br />
Climate<br />
scenario:<br />
CO 2 = 540 ppm<br />
Climate<br />
scenario:<br />
CO 2 = 720 ppm<br />
Vietnam<br />
Can Tho 79 71 108<br />
Lao PDR<br />
Luangphrabang 68 52 77<br />
Vientiane 148 116 157<br />
Pakse 86 81 110<br />
Thailand<br />
Nakhon Ratchasima<br />
(Korat) 121 116 159<br />
Khon Kaen 126 115 144<br />
Nakhon Phanom 112 103 142<br />
Table 4: Number of annual hot day at selected cities in the region under climate<br />
condition at different levels of atmospheric CO 2 concentration<br />
<strong>Final</strong> technical report – AIACC AS07 37
On the other hand, the climate change scenario shows trend of decreasing cool<br />
day in the future throughout the region, of which the cool period would be shorten by 3-4<br />
weeks in many locations as per illustration below.<br />
Figure 17: Change in number of annual “cool day” in the study area<br />
The table below shows change in number of annual cool day at the major cites in<br />
the region.<br />
Number of annual cool day at different cities in the region<br />
Location<br />
Climate<br />
scenario:<br />
CO 2 = 360 ppm<br />
Climate<br />
scenario:<br />
CO 2 = 540 ppm<br />
Climate<br />
scenario:<br />
CO 2 = 720 ppm<br />
Vietnam<br />
Can Tho 0 0 0<br />
Lao PDR<br />
Luangphrabang 147 147 141<br />
Vientiane 66 72 37<br />
Pakse 30 33 0<br />
Thailand<br />
Nakhon Ratchasima<br />
(Korat) 77 78 30<br />
Khon Kaen 57 54 19<br />
Nakhon Phanom 60 57 21<br />
Table 5: Number of annual cool day in the selected cities in the region under climate<br />
condition at different levels of atmospheric CO 2 concentration<br />
<strong>Final</strong> technical report – AIACC AS07 38
4.3.2 Change in future precipitation in lower Mekong River basin<br />
The result from the simulation shows trend of increasing precipitation throughout<br />
the region in the future. The increasing in precipitation will be prominent in Lao PDR as<br />
well as Mekong River delta in Viet Nam. However, the length of rainy season seems to<br />
be unchanged (see Appendix 1: Rainy Season Pattern at Selected Cities in lower Mekong<br />
River Basin under Influence of Climate Change). The illustration below shows 10-year<br />
average precipitation of the baseline condition and the future change under climate<br />
condition at atmospheric CO 2 of 540ppm and 720ppm.<br />
Figure 18: Average annual rainfall in the lower Mekong River region –<br />
Baseline condition and future change.<br />
The change in regional precipitation will vary from year to year under influence<br />
of climate variability. In the wettest year of the decade, precipitation in Lao PDR will<br />
increase by slightly over 10% under climate condition at atmospheric CO 2 of 540ppm<br />
and almost 30% under climate condition at atmospheric CO 2 of 720ppm. The Mekong<br />
River delta will also have higher annual rainfall by approximately 10%. However, on the<br />
contrary, there seems to be almost no change on annual precipitation in Thailand<br />
throughout the future under wet year scenario.<br />
<strong>Final</strong> technical report – AIACC AS07 39
Range of change in annual rainfall in Mekong River basin<br />
Wet year scenario<br />
Zone Climate scenario:<br />
CO 2 = 360 ppm<br />
Climate scenario:<br />
CO 2 = 540 ppm<br />
Climate scenario:<br />
CO 2 = 720 ppm<br />
Unit: Millimeter/100km 2<br />
Thailand 1,384 1,257 1,384<br />
Lao PDR 1,981 2,222 2,549<br />
Vietnam 1,743 1,939 1,983<br />
Table 6: Annual precipitation in Mekong River basin in Lao PDR, Thailand and<br />
Vietnam – Wet year scenario<br />
The condition is different in the driest year of the decade; annual precipitation in<br />
Mekong River delta in Viet Nam will remain unchanged but Thailand will have higher<br />
rainfall by almost 10%. Annual rainfall will remain almost unchanged in Lao PDR under<br />
climate condition at atmospheric CO 2 of 540ppm but will increase by 25% under climate<br />
condition at atmospheric CO 2 of 720ppm.<br />
Zone<br />
Range of change in annual rainfall in Mekong River basin<br />
Climate scenario:<br />
CO 2 = 360 ppm<br />
Dry year scenario<br />
Climate scenario: Climate scenario:<br />
CO 2 = 540 ppm CO 2 = 720 ppm<br />
Unit: Millimeter/100km 2<br />
Thailand 1,069 1,105 1,168<br />
Lao PDR 1,504 1,529 1,888<br />
Vietnam 1,457 1,424 1,434<br />
Table 7: Annual precipitation in Mekong River basin in Lao PDR, Thailand and<br />
Vietnam – Dry year scenario<br />
4.4 Conclusions<br />
The major change in climate pattern in the lower Mekong River basin is mainly<br />
on the precipitation and prolonged summertime. The result from simulation shows that<br />
precipitation will increase throughout the region in the future, especially in Lao PDR.<br />
Climate variability tends to be more extreme as the range of precipitation between dry<br />
<strong>Final</strong> technical report – AIACC AS07 40
and wet years will be wider in the future. Among the sub-regions in the focused area of<br />
study, it seems that Lao PDR would affect from impact of climate change most, in term<br />
of increasing precipitation.<br />
The higher precipitation while the length of rainy season will remain unchanged<br />
may lead to higher flood risk in the future, which may also increase in its magnitude as<br />
well as frequency. In addition to flood risk, higher intensity precipitation may also cause<br />
higher risk of landslide, especially in the mountainous area. Wider range of precipitation<br />
fluctuation between dry and wet year may also raise concerns in the water utilization and<br />
water allocation in dryer year. This could lead to the improvement on the infrastructure or<br />
other water policy in the region.<br />
As far as the temperature is concerned, the range of hot and cool weather in the<br />
region may only slightly change, but the region will have longer summer with shorter<br />
winter time. This phenomenon may have impact on various ecosystems, e.g. problem<br />
with pest and vector borne disease may also arise; however, this was not covered under<br />
the study of this research.<br />
<strong>Final</strong> technical report – AIACC AS07 41
5 Impacts and Vulnerability<br />
5.1 Activities Conducted<br />
o Study of impact of climate change on hydrological regime in lower Mekong River<br />
region.<br />
o Study of impact of climate change on rain-fed rice productivity in lower Mekong<br />
River region.<br />
o Assessment on vulnerability and adaptation of rain-fed farmer in the lower<br />
Mekong River region to impact of climate change.<br />
5.2 Study of impact of climate change on hydrological regime in lower Mekong River<br />
region<br />
5.2.1 Description of Scientific Methods and Data<br />
This research focus the study of impact of climate change on hydrological regime<br />
on Mekong River’s tributaries in Lao PDR and Thailand by using climate data from the<br />
climate scenario, which was simulated by CCAM climate model, as input into Variable<br />
Infiltration Capacity (VIC) hydrological model to conduct high resolution hydrological<br />
simulation.<br />
The tributaries of Mekong River under this study are as follows: (also see Figure<br />
19)<br />
• Lao PDR: Nam Ou, Nam Khan, Nam Nhiep, Nam Ngum, Nam Theun, Nam<br />
Kading, Se Bang Fai, Se Bang Hieng, Se Done and Se Kong<br />
• Thailand: Nam Songkram, Nam Chi and Nam Mun<br />
<strong>Final</strong> technical report – AIACC AS07 42
Figure 19: Selected Mekong River tributary watersheds for the study of climate change<br />
impact on hydrological regime<br />
Variable Infiltration Capacity (VIC) is a macro-scale hydrologic model that solves<br />
full water and energy balances, originally developed by Xu Liang at the University of<br />
Washington.(Liang, et al, 1994) It is a semi-distributed grid-based hydrological model<br />
that parameterizes the dominant hydro meteorological processes taking place at the land<br />
surface - atmosphere interface. A mosaic representation of land surface cover, and sub<br />
grid parameterizations for infiltration and the spatial variability of precipitation, account<br />
for sub-grid scale heterogeneities in key hydrological processes. The model uses two soil<br />
layers and a vegetation layer with energy and moisture fluxes exchanged between the<br />
layers.(Lohman, et al, 1998) Vegetation and soil characteristics associated with each grid<br />
cell are reflected in sets of vegetation and soil parameters. Parameters for vegetation<br />
types are specified in a user defined library of vegetation classes (usually derived from<br />
standard, national classification schemes), while their distribution over the gridded land<br />
surface area is specified in a vegetation parameter file. Soil characteristics (e.g., sand<br />
and clay percents, bulk density) can be represented for a user-defined number of vertical<br />
soil layers - usually two or three, divided into a thin upper layer and a secondary set of<br />
layers that extend several meters into the soil column. (Richey, et al, 2000)<br />
Data description and data source that were used for the simulation are as follows:<br />
• Forcing data: CCAM climate scenario data set at 0.1 degree resolution<br />
<strong>Final</strong> technical report – AIACC AS07 43
• Vegetation data: UMD 1km Global Land Cover dataset - year 1994<br />
• Soil data: Global Soil Data Task 2000 - Global Soil data product (IGBP-DIS)<br />
0.5 minute resolution<br />
• Elevation data: Shuttle Radar Topography Mission 3-arc second (SRTM-<br />
90M) compiled by Consortium for Spatial Information of the Consultative<br />
Group for International Agricultural Research (CGIAR-CSI)<br />
• River network: The Digital Chart of the World (DCW), which is the<br />
Environmental Systems Research Institute, Inc. (ESRI)’s product originally<br />
developed for the US Defense Mapping Agency (DMA) using DMA data. The<br />
dataset used was the DCW 1993 version, at 1:1,000,000 scale<br />
• Watershed boundaries: River basin boundaries are based on the EROS Data<br />
Center HYDRO1k basin boundaries developed at the U.S. Geological Survey<br />
(http://edcdaac.usgs.gov/gtopo30/hydro/)<br />
All data sets were re-calculated by GIS technique to 5 km resolution for operational<br />
model resolution.<br />
Baseline hydrological condition: Model calibration<br />
The baseline hydrological regime for further analysis was simulated by VIC<br />
hydrological model. This is also part of model calibration process, of which the result<br />
from the simulation was compared against the observed data during the 1980s. The<br />
simulation was performed to calculate tributaries run-off at various key locations where<br />
observation stations are located and model calibration was performed by using the<br />
observed data from these stations. The calibrated hydrological simulation result is shown<br />
in the Appendix 2: Hydrology Calibrating Result. The result shows that VIC model is<br />
able to simulate total discharge reasonable well in most of the sub-basis under this study.<br />
However, the model still has limitation in simulating the month-to-month discharge, this<br />
may due to the model limitation in handling the soil property, particularly the soil<br />
moisture. In addition, the model still has limitation in handling back water effect from the<br />
main stream into the tributary.<br />
The locations selected for the baseline simulation and calibration are as shown in<br />
the illustration and table below:<br />
<strong>Final</strong> technical report – AIACC AS07 44
Sub-Basin:<br />
Station:<br />
Sub-Basin:<br />
Station:<br />
Sub-Basin:<br />
Station:<br />
Sub-Basin:<br />
Station:<br />
Sub-Basin:<br />
Station:<br />
Sub-Basin:<br />
Station:<br />
Sub-Basin:<br />
Station:<br />
Sub-Basin:<br />
Station:<br />
Sub-Basin:<br />
Station:<br />
Sub-Basin:<br />
Station:<br />
Sub-Basin:<br />
Station:<br />
Sub-Basin:<br />
Station:<br />
Sub-Basin:<br />
Station:<br />
Nam Ou - Lao PDR<br />
Muong Ngoy (N20.702 E102.335)<br />
Nam Khan - Lao PDR<br />
Ban Mixay (N19.787 E102.177)<br />
Nam Ngum - Lao PDR<br />
Ban Hin Heup (N18.663 E102.355)<br />
Nam Ngum - Lao PDR<br />
Ban Pak Kanhoung (N18.417 E102.575)<br />
Nam Nhiep - Lao PDR<br />
Muong May (N18.505 E103.662)<br />
Nam Theun - Lao PDR<br />
Bang Signo (N17.850 E105.067)<br />
Nam Songkhram – Thailand<br />
Ban Tha Kok Daeng (N17.867 E103.783)<br />
Se Bang Fai - Lao PDR<br />
Se Bang Fai Bridge-13 (N17.072 E104.985)<br />
Se Bang Hieng - Lao PDR<br />
Ban Keng Done (N16.185 E105.815)<br />
Nam Chi - Thailand<br />
Ban Chot<br />
Nam Mun - Thailand<br />
Kaeng Saphu Tai (N15.240 E105.250)<br />
Se Done - Lao PDR<br />
Souvanakhili (N15.383 E105.817)<br />
Se Kong - Lao PDR<br />
Attapeu (N14.800 E106.833)<br />
Figure 20: Selected locations in Mekong River tributaries for calculating baseline hydrological condition<br />
and model calibrating process<br />
For result of baseline simulation and model calibration, see Appendix 2: Result of<br />
Hydrological Regime Baseline Calculation and Model Calibration.<br />
<strong>Final</strong> technical report – AIACC AS07 45
5.2.2 Results: Impact of climate change on discharge of Mekong River’s tributaries in<br />
Lao PDR and Thailand<br />
After the VIC hydrological model had been calibrated, the future climate data<br />
from climate scenario, which was simulated from CCAM climate model, was used as<br />
input to simulate future tributary’s run-off under influence of climate change. As CCAM<br />
climate model generates 10 years climate data at each atmospheric CO 2 concentration<br />
condition (360ppm, 540ppm and 720ppm), climate data from the wettest year and driest<br />
year of the decade were used in the hydrological simulation, in order to understand the<br />
range of change in future hydrological condition in these watersheds.<br />
The VIC model runs one grid cell at a time over a desired period (any subset of<br />
the period spanned by the model forcing data), to produce time series of runoff, base flow,<br />
evaporation, and other physical variables for each grid cell. These time series are then<br />
routed by the VIC routing model to produce stream flow at points of interest in the<br />
watershed. The simulation of tributary discharge was based on the calculation of run-off<br />
at the river mouth before it flows into Mekong River main stem. The locations of the<br />
routing are as per Figure 21 below:<br />
(For the result of simulation of each sub-basin, see Appendix 3: Simulation Result<br />
of Hydrological Regime of major Sub-basins of Mekong River in Lao PDR and Thailand<br />
under Different Climate Scenarios).<br />
<strong>Final</strong> technical report – AIACC AS07 46
Sub-Basin:<br />
Station:<br />
Sub-Basin:<br />
Station:<br />
Sub-Basin:<br />
Station:<br />
Sub-Basin:<br />
Station:<br />
Sub-Basin:<br />
Station:<br />
Sub-Basin:<br />
Station:<br />
Sub-Basin:<br />
Station:<br />
Sub-Basin:<br />
Station:<br />
Sub-Basin:<br />
Station:<br />
Sub-Basin:<br />
Station:<br />
Sub-Basin:<br />
Station:<br />
Sub-Basin:<br />
Station:<br />
Sub-Basin:<br />
Station:<br />
Sub-Basin:<br />
Station:<br />
Sub-Basin:<br />
Station:<br />
Nam Ou - Lao PDR<br />
Tributary mouth (N20.05 E102.24)<br />
Nam Khan - Lao PDR<br />
Tributary mouth (N19.87 E102.18)<br />
Upper Nam Ngum - Lao PDR<br />
Before dam entry (N18.75 E102.77)<br />
Nam Ngum - Lao PDR<br />
Tributary mouth (N18.16 E103.07)<br />
Nam Nhiep - Lao PDR<br />
Tributary mouth (N18.41 E103.59)<br />
Nam Theun - Lao PDR<br />
Tributary mouth (N18.33 E104.01)<br />
Se Bang Fai - Lao PDR<br />
Tributary mouth (N16.98 E104.83)<br />
Se Bang Hieng - Lao PDR<br />
Tributary mouth (N16.19 E105.32)<br />
Se Done - Lao PDR<br />
Tributary mouth (N15.26 E105.84)<br />
Se Kong - Lao PDR<br />
Tributary mouth (N13.67 E106.13)<br />
Se Son - Lao PDR<br />
Tributary mouth (N13.58 E106.30)<br />
Se Pok - Lao PDR<br />
Tributary mouth (N13.50 E106.30)<br />
Nam Songkhram - Thailand<br />
Tributary mouth (N17.68 E104.35)<br />
Nam Chi - Thailand<br />
Tributary mouth (N15.26 E104.66)<br />
Nam Mun - Thailand<br />
Tributary mouth (N15.26 E105.45)<br />
Figure 21: Routing locations for analysis of climate change impact on hydrological regime of the Mekong<br />
River’s tributaries<br />
<strong>Final</strong> technical report – AIACC AS07 47
The result from the simulation shows that most of the tributaries of Mekong River<br />
in Lao PDR and Thailand tend to have more water in the future due to higher<br />
precipitation. For the wet year scenario, almost every watershed will have higher<br />
discharge under the climate condition at CO 2 concentration of 540 ppm and increase<br />
further under the climate condition at CO 2 concentration of 720 ppm. However, in the dry<br />
year scenario, many sub-basins will have slightly less water under climate condition at<br />
CO 2 concentration of 540 ppm, but the discharge will increase under the climate<br />
condition at CO 2 concentration of 720 ppm.<br />
Change in the discharge of Mekong River’s tributary under influence of climate<br />
change is summarized in the table below:<br />
Mekong<br />
River’s<br />
tributary<br />
Lao PDR<br />
Impact of Climate Change on Water Resource in Mekong River’s tributaries in<br />
Lao PDR and Thailand<br />
Wet Year Scenario: Tributary catchment’s Dry Year Scenario: Tributary catchment’s<br />
discharge under climate condition at different discharge under climate condition at CO 2<br />
CO 2 concentration<br />
different concentration<br />
Baseline:<br />
360 ppm<br />
(million m 3 )<br />
540 ppm<br />
(% change<br />
from baseline)<br />
720 ppm<br />
(% change<br />
from<br />
baseline)<br />
Baseline:<br />
360 ppm<br />
(million m 3 )<br />
540 ppm<br />
(% change<br />
from<br />
baseline)<br />
720 ppm<br />
(% change<br />
from<br />
baseline)<br />
Nam Ou 11,458 +7.23% +16.78% 9,035 -15.56% +24.38%<br />
Nam Khan 1,293 +6.65% +6.93% 946 -11.17% +44.80%<br />
Upper Nam 3,820 +14.77% +8.44% 2,891 -12.30% +51.49%<br />
Ngum (before<br />
dam)<br />
Nam Ngum 14,837 +6.83% +11.79% 11,837 +4.70% +46.63%<br />
Nam Nhiep 4,796 +4.70% +46.63% 3,902 -4.00% +33.28%<br />
Nam Theun 39,427 -5.86% +18.75% 31,483 +11.03% +30.47%<br />
Se Bang Fai 8,330 -4.54% +14.92% 6,412 +1.40% +32.69%<br />
Se Bang 10,057 +0.04% +27.95% 6,784 +10.60% +51.21%<br />
Hieng<br />
Se Done 2,574 +13.30% +100.05% 1,829 +2.91% +53.43%<br />
Se Kong 37,506 +20.20% +63.21% 35,138 -13.64% +5.57%<br />
Se Son 14,279 +24.74% +51.75% 13,303 -11.60% +1.84%<br />
Se Pok 13,050 +22.39% +51.26% 12,382 -15.29% -3.53%<br />
Thailand<br />
Nam<br />
12,270 +6.34% +7.41% 11,750 +7.18 +24.98<br />
Songkram<br />
Nam Chi 6,423 +12.73% +21.27% 7,788 -10.24 +14.43<br />
Nam Mun 18,645 +10.02% +34.06% 21,232 -15.01 +15.39<br />
Table 8: Impact of climate change on discharge of Mekong River’s tributaries in Lao PDR and Thailand<br />
<strong>Final</strong> technical report – AIACC AS07 48
The illustrations below show the summary result Impact of climate change on<br />
hydrological condition in tributaries of Mekong River in Lao PDR and Thailand.<br />
Figure 22: Change in discharge of Mekong River tributaries in Lao PDR and Thailand under dry<br />
year scenario of climate condition at CO2 concentration of 540ppm and 720ppm<br />
Figure 23: Change in discharge of Mekong River tributaries in Lao PDR and Thailand under wet<br />
year scenario of climate condition at CO2 concentration of 540ppm and 720ppm<br />
<strong>Final</strong> technical report – AIACC AS07 49
5.2.3 Conclusion<br />
The change in tributary’s run-off is not in proportion of to the change in<br />
precipitation. Increasing in tributary’s discharge is higher than the increasing of<br />
precipitation in the catchments. The increased discharge is excess water as the current<br />
water condition is sufficient to maintain the ecosystem of the watershed, e.g.<br />
evapotransporation of plant in the watershed, soil moisture, etc.<br />
5.3 Study of impact of climate change on rain-fed rice productivity in lower Mekong<br />
River region<br />
Change in climate pattern will affect agriculture system directly, especially the<br />
rain-fed system. This study focused the study of climate change impact on rain-fed rice<br />
cultivation as it is considered as the most important food crop of the Southeast Asia<br />
region with focus on 3 selected study sites in Lao PDR, Thailand and Viet Nam.<br />
Figure 24: Selected study sites on impact of climate change on rain-fed rice<br />
productivity<br />
5.3.1 Description of Scientific Methods and Data<br />
This study analyzed the impact of climate change by using crop model to simulate<br />
potential future yield of rice productivity in the region under different climate scenarios.<br />
The crop model used is Decision Support System for Agro Technology Transfers<br />
(DSSAT version 4.0) crop modeling software (Hoogenboom et al, 1998) with daily<br />
<strong>Final</strong> technical report – AIACC AS07 50
climate data from climate scenario, which was generated by CCAM climate model, as<br />
input, which include maximum and minimum temperature, precipitation, solar radiation,<br />
etc. and coupled with crop management scheme and soil property to calculate the yield of<br />
rice productivity. By using daily climate data for the simulation process, this study is able<br />
to capture the impact of climate change on rain-fed rice production not only in terms of<br />
the change in degree of intensity of each climate parameter, e.g. increase or decrease in<br />
rainfall or temperature, but also change in temporal aspect too, e.g. shifting of the onset<br />
or changing on the length of rainy season or change in the pattern of mid-season dry spell<br />
period, etc.<br />
The crop management scheme used in the simulation process was based on<br />
assumed homogeneous practice at each site to simplify the calculation process. Crop<br />
managements comprised of crop cultivars, planting field, initial condition of the field<br />
before planting, planting detail (method and plat density), water management, and both<br />
organic and inorganic fertilizer application.<br />
5.3.2 Results: Impact of climate change on rice productivity in lower Mekong River basin<br />
Farming systems in Lao PDR and Thailand are single crop cycle per year due to<br />
the length of the rainy season. Viet Nam farming system adopt dual crop as the rainy<br />
season is longer in the Mekong River delta area. The climate change from the CCAM<br />
climate model shows slight negative impact on the rain-fed rice productivity in Lao PDR.<br />
The simulated yield of rice productivity in Savannakhet province would reduce by 10%<br />
under climate condition at CO 2 concentration of 540 ppm but will increase back to almost<br />
baseline condition under the climate condition at CO 2 concentration of 720 ppm.<br />
The simulation of rice productivity at the study site in Ubonratchathani province,<br />
Thailand, shows that climate change has positive impact on the rice production in the<br />
area. The simulation result shows trend of increasing yield of rice productivity under<br />
future climate condition. The increase in productivity yield could be as high as 10-15% in<br />
some areas.<br />
In Viet Nam, the simulation result shows different climate impacts on yield of rice<br />
productivity in different crop cycle. The winter-spring crop may get slight positive<br />
impact, of which the productivity would slightly increase by approximately 3-5% under<br />
<strong>Final</strong> technical report – AIACC AS07 51
climate condition at CO 2 concentration of 540 ppm, however yield would drop by<br />
approximately 4-8% from baseline condition under climate condition at CO 2<br />
concentration of 720 ppm. The summer-autumn crop tends to get severe impact from<br />
climate change, which the simulation result shows significant drop by approximately 8-<br />
12% under climate condition at CO 2 concentration of 540 ppm, and would sharply drop<br />
further by approximately 15% to almost 50% in some areas under climate condition at<br />
CO 2 concentration of 720 ppm. On average, the simulation result shows that yield of rice<br />
production in the Mekong River delta would drop by approximately 18% toward the end<br />
of this century (under climate condition at CO 2 concentration of 720 ppm, which<br />
according to SRES A1FI, will be around the end of the century).<br />
<strong>Final</strong> technical report – AIACC AS07 52
The result from the simulation is shown in the table below:<br />
Location<br />
Rice productivity under different climate scenarios<br />
Climate condition under different<br />
atmospheric CO 2 concentration<br />
Remark: Rice productivity yield shown in kg/ha<br />
Change in % compare to<br />
baseline period<br />
360 ppm 540 ppm 720 ppm 540ppm 720ppm<br />
Lao PDR - Savannakhet<br />
Province<br />
Songkhone District 2,534.90 2,303.20 2,470.10 -9.14 -2.56<br />
Thailand - Ubonratchathani<br />
Province<br />
Zone 1 1,154.39 1,235.14 1,330.85 7.00 15.29<br />
Zone 2 1,919.61 2,002.15 2,072.04 4.30 7.94<br />
Zone 3 2,363.70 2,407.62 2,438.92 1.86 3.18<br />
Zone 4 2,542.32 2,575.03 2,591.89 1.29 1.95<br />
Zone 5 3,024.18 3,051.44 3,068.82 0.90 1.48<br />
Viet Nam<br />
An Giang Province<br />
Winter-Spring crop 5,592.00 5,741.33 5,357.00 2.67 -4.20<br />
Summer-Autumn crop 4,830.33 4,439.33 2,858.00 -8.09 -40.83<br />
Can Tho Province<br />
Winter-Spring crop 5,799.67 5,971.00 5,361.33 2.95 -7.56<br />
Summer-Autumn crop 6,778.67 6,783.33 5,627.00 0.07 -16.99<br />
Dong Thap<br />
Winter-Spring crop 5,578.00 5,877.33 5,153.33 5.37 -7.61<br />
Summer-Autumn crop 4,830.33 4,214.67 2,545.67 -12.75 -47.30<br />
Long An Province<br />
Winter-Spring crop 5,601.33 5,855.00 5,128.67 4.53 -8.44<br />
Summer-Autumn crop 6,646.67 6,535.00 5,301.67 -1.68 -20.24<br />
Table 9: Simulated yield of rice productivity at the 3 study sites under different climate scenarios<br />
5.3.3 Conclusion<br />
Climate change will have both positive and negative to the rice cultivation in the<br />
region. However, the result from the simulation is still somewhat differ from the actual<br />
yield according to surveyed data from field interview, perhaps due to the assumptions<br />
made for crop management and accuracy of other dataset used for the simulation,<br />
particularly soil property. Anyhow, these figures may be used as indicator to show future<br />
trend of the climate change impact on rice productivity in the Southeast Asia region.<br />
However, another significant climate impact on rice production in the study areas is from<br />
extreme climate event, such as flood, drought and dry spell, etc, which may increase in<br />
<strong>Final</strong> technical report – AIACC AS07 53
terms of frequency and severity as impact of global warming. Based on farmer interview<br />
at the study sites, especially in Thailand and Lao PDR, the extreme climatic events may<br />
cause loss of rice productivity by average 30-50% from flood in moderate flood year.<br />
Figure 25: Impact of extreme climate event on rice cultivation<br />
5.4 Assessment on vulnerability and adaptation of rain-fed farmer in the lower Mekong<br />
River region to climate change<br />
The rain-fed farmer in the lower Mekong River region could be among the most<br />
vulnerable group as their livelihood depends heavily on their annual on-farm productivity,<br />
particularly the rice cultivation, which is directly exposed to climate risk. In addition,<br />
household economic condition of these farmers is also considered to be in the poor group<br />
in the society, thus may cause them to have limited resource or other capacity to cope<br />
with impact of climate variability and change. Assessment of risk and vulnerability of the<br />
rain-fed farmer of the lower Mekong River region in this study was based on field<br />
interview to assess baseline livelihood condition and also baseline climate risk, which<br />
will be further used in the analysis on vulnerability to climate change impact.<br />
5.4.1 Description of Scientific Methods and Data<br />
The assessment on risk and vulnerability to impact of climate change was based<br />
on change in rice productivity under different climate scenarios, which was used as a<br />
proxy of stress from future climate change, and analyzes its effect on the household<br />
livelihood condition according to the following diagram.<br />
<strong>Final</strong> technical report – AIACC AS07 54
Figure 26: Framework on the assessment of risk and vulnerability of rain-fed farmer to<br />
impact of climate change<br />
The main focus of this study covers 3 countries in lower Mekong River countries,<br />
the field survey to assess risk and vulnerability to climate impact of rain-fed farmer was<br />
focused in Lao PDR, Thailand and Viet Nam.<br />
Figure 27: Selected sites on risk and vulnerability of rain-fed farmer to impact of<br />
climate change<br />
<strong>Final</strong> technical report – AIACC AS07 55
The assessment in Viet Nam was conducted as pilot activity to test and fine tune<br />
the field interview and analysis method. The assessment in Thailand and Lao PDR was<br />
conducted to assess and compare risk and vulnerability of farmers in the society that has<br />
different socio-economic conditions, which can be indicated by the Gross National<br />
Income (GNI) figures of the two countries. In the year 2003, Lao PDR’s GNI per capita<br />
was $380, while Thailand’s GNI per capita was $2,550 in the same year (The World<br />
Bank). The field interview covered 560 farmer households in Thailand and 160 farmer<br />
households in Lao PDR. This report will focus on the result from the assessment in Lao<br />
PDR and Thailand.<br />
Background of Study Site in Thailand: Ubonratchathani Province<br />
Ubonratchathani province is located in the lower North-Eastern region of<br />
Thailand. The province covers area of 16,112km 2 . Most of the land areas in<br />
Ubonratchathani province are highlands, about 68 meters above the sea level, with<br />
Mekong River as the border line between the province and People Republic Democracy<br />
of Laos, as well as high mountains as the border line between People Republic<br />
Democracy of Laos and Democratic Republic of Cambodia. However, the overall areas<br />
in Ubonratchathani province are highlands with slopes from eastern part, with mixed<br />
sandy soils of low fertility. Also, there is Chi River coming to merge with Mun River,<br />
before passing through Ubonratchathani province from the West to the East, and downing<br />
into Mekong River at Khong Chiam district. In 2001, Ubonratchathani maintained a total<br />
population of 1,779,098 persons, mostly are in the agriculture sector.<br />
The study site is part of the Ubonratchathani Land Reform Area (ULRA), covers<br />
55,000 ha of gently undulating farm land on the right (eastern) bank of the Dome Yai<br />
River. This area has three slope classes, namely; level to gently sloping, sloping to<br />
undulating; and undulating to rolling. Soils are generally sandy and of low fertility.<br />
Korat series is the major soil in this area. These soils are almost well drained and strongly<br />
acidic.<br />
Most of the area is cultivated for paddy, with some areas for upland crops. There<br />
are small patches of degraded forests. Water is plentiful in the wet season, but severe<br />
shortage occurs in the dry season. Average rainfall is about 1,600 mm, 90 percent of<br />
<strong>Final</strong> technical report – AIACC AS07 56
which fall in the period May to October. The average temperature is from a minimum of<br />
17.0 º C in December and January to a maximum of 35.9 º C in the March and April. There<br />
is no source of irrigation, so cropping is a wet season activity.<br />
The study site is divided into 5 zones as follows:<br />
Zone Characteristics of zone Village selected<br />
# 1 The area is deep sand. Cropping patterns are rice + plantation 1. Ban Mak Mai<br />
and forest. The forest trees are eucalyptus and cashew nut. 2. Ban Mek Yai<br />
# 2 This area lies along the Lam Dom Yai River. Soil has high<br />
fertility. It is a wet area. The dominant cropping system is rice<br />
/upland crop (field crop) such as vegetable, cassava or kenaf.<br />
# 3 The area is partly upland rice. The cropping system is an<br />
encroached forest area.<br />
# 4 This area has an intensive rice system. There is low tree<br />
density in the area.<br />
# 5 This area is similar to zone # 3 but has more lowland<br />
characteristics. Rice area is an encroached forest.<br />
3. Ban Khok Pattana<br />
1. Ban Fung Pa<br />
2. Ban Muang<br />
3. Ban Bung Kham<br />
4. Ban Bua Thaim<br />
1. Ban Nong Sanom<br />
2. Ban Udom Chart<br />
3. Ban Pa Rai<br />
4. Ban Non Sawang<br />
1. Ban Bua Ngam<br />
2. Ban Nong Waeng<br />
3. Ban Rat Samakee<br />
4. Ban Non Yai<br />
1. Ban Pa Pok<br />
2. Ban Sok Seang<br />
3. Ban Non Deang<br />
Table 10: Study site on risk and vulnerability assessment in Thailand - details<br />
background of the 5 zones of study<br />
<strong>Final</strong> technical report – AIACC AS07 57
&<br />
&<br />
&<br />
&<br />
&<br />
&<br />
&<br />
&<br />
&<br />
&<br />
&<br />
&<br />
&<br />
&<br />
&<br />
&<br />
&<br />
&<br />
&<br />
&<br />
&<br />
&<br />
&<br />
104ð 35' 00" E<br />
105ð 15' 00" E<br />
105ð 04' 00" E<br />
105ð 15' 00" E<br />
N<br />
16ð 02' 00"N<br />
N<br />
14ð 53' 00" N<br />
Zone # 3<br />
Zone # 1<br />
Zone # 4<br />
Zone # 2<br />
Zone # 5<br />
14ð 31' 00 " N<br />
Ubon Ratchathani Province<br />
water body<br />
Boundary.shp<br />
Road<br />
Meteorogical station<br />
Scale 1 : 1,000,000<br />
Meteorogical station<br />
Village boundary<br />
Scale 1 : 200,000<br />
14ð 29' 00" N<br />
Figure 28: Study site on risk and vulnerability assessment in Thailand and<br />
details map of the 5 zones of study<br />
<strong>Final</strong> technical report – AIACC AS07 58
Background of study site in Lao PDR: Savannakhet Province<br />
Lao PDR locates in the center of the Southeast Asian peninsular, between lat.<br />
13 0 54’ to 22 0 03’ North, and between long. 100 0 05’ to 107 0 38’ East, with total area of<br />
236,800 km 2 . The length from north to south is approximately 1,000 km, and the width<br />
from east to west is approximately 470 km.<br />
Savannakhet province locates in the central to southern part of Lao PDR, having a<br />
total area of 21,774 km 2 , consisting of 15 districts. The topography of Savannakhet<br />
province is low land and slope slightly from east to west to Mekong River. Savannakhet<br />
province has the largest area of rice fields in the country, 139,582 ha or 19% of total rice<br />
fields in Lao PDR (Committee for Planning and Cooperation, 2003). Total population of<br />
Savannakhet province is 811,400 people or approximately 15% of the country population,<br />
which is the highest populated province in the country and mostly is farmer.<br />
Songkhone district locates in the southwest of Savannakhet province. It is the<br />
largest district in the province, with the total area of 1, 406 km 2 . The district consists of<br />
142 villages, and 13,919 households, which makes the total population of 86,855 people.<br />
Most of the population is farmer and grow rice mostly for own consumption with minor<br />
commercial on the excess production. The rice farming system is rain-fed rice farming<br />
with single crop cycle per year.<br />
Four villages selected as study area namely, Seboungnuantay, Lahakhoke,<br />
Khouthee, and Dongkhamphou villages. The study site has total area of 1,851 ha with the<br />
population 2,490 people in 434 households.<br />
<strong>Final</strong> technical report – AIACC AS07 59
Figure 29: Study site on risk and vulnerability assessment in Lao PDR and details map<br />
that shows Songkhone district, Savannakhet province<br />
The analysis on risk and vulnerability to climate impact in this study was based on<br />
multiple criteria and each criterion was assessed by using multiple indicators as the<br />
nature of risk and condition of livelihood is a complex issue beyond the capacity of any<br />
single indicator or criteria to describe. The three criteria selected for this study in the<br />
assessing farmer’s risk to climate impact are as follows;<br />
• Household economic condition, which was used to measure the sensitivity of the<br />
farmer household to climate impact.<br />
<strong>Final</strong> technical report – AIACC AS07 60
• Dependency on on-farm production, which was used to measure the exposure of<br />
the farmer household to climate impact.<br />
• Coping capacity of farmer to climate impact.<br />
These criteria when combined together would indicate the degree of risk of rainfed<br />
farmer to climate impact. The concept in evaluating risk profile and risk grouping as<br />
well as determining risk group is described in the diagram below;<br />
Figure 30: Conceptual framework on the analysis of risk and vulnerability of rain-fed<br />
farmers to climate change impact<br />
According to this conceptual framework, the farmer households which may be at<br />
risk and has high potential to be vulnerable to impact of climate change / variability are<br />
those who are poor or have unstable or non-sustained household economic condition and<br />
highly rely on rice production to maintain their livelihood condition, in addition, they<br />
may also have limited coping capacity to cope with climate impact too.<br />
<strong>Final</strong> technical report – AIACC AS07 61
In order to determine the risk profile of farmer household from these 3 criteria, a<br />
set of indicators was put up to evaluate the condition of each criterion as follow:<br />
Criteria Indicator Measurement Scoring Min<br />
score<br />
Household<br />
Economic<br />
condition<br />
Household<br />
sustainability<br />
condition<br />
Total household production (or<br />
total household income) / Total<br />
household consumption (or total<br />
household expenditure)<br />
>1=0, 1-0.7=1,<br />
= 0.8 = 0, <<br />
0.8 = 1<br />
(Thailand >=<br />
0.65 = 0, <<br />
0.65 = 1)<br />
0 1<br />
Sub-total 0 4<br />
>1=0, 1-0.7=1, 0 2<br />
interview would be analyzed according to the table above and farmers would then be<br />
grouped together according to their risk scoring, which would be categorized into 3<br />
groups:<br />
• The household which risk score is between 0-4 is classified as low risk category.<br />
• The household which risk score is between 5-8 is classified as moderate risk<br />
category.<br />
• The household which risk score is between 9-12 is classified as high risk category.<br />
In this study, change in rice productivity was used to represent climate stress that<br />
would affect the household economic condition as well as degree of household<br />
dependency on on-farm production to maintain livelihood condition, which would affect<br />
the household risk to climate impact at the end. In this study, the vulnerable household is<br />
defined as those whose risk score under climate change impact is changed from baseline<br />
condition.<br />
The calculation of household risk to climate change impact was based on change<br />
in rice productivity of each household according to climate impact scenarios, which<br />
derived from the simulation and also coupled with influence of extreme climate event,<br />
which is based on farmer’s opinion from the field interview that they have been<br />
experiencing crop damage by approximately 30%, in most cases from flood.<br />
<strong>Final</strong> technical report – AIACC AS07 63
Lao PDR:<br />
Savannakhet Province<br />
Changes in rice productivity under climate change impact<br />
Climate condition under<br />
CO 2 concentration 540<br />
ppm<br />
Normal<br />
condition<br />
Extreme<br />
climate event<br />
Climate condition under<br />
CO 2 concentration 720<br />
ppm<br />
Normal<br />
condition<br />
Extreme<br />
climate event<br />
Songkhone District -9.14% -39.14% -2.56% -32.56%<br />
Thailand:<br />
Ubonratchathani Province<br />
Zone 1 7.00% -23.00% 15.29% -14.71%<br />
Zone 2 4.30% -25.70% 7.94% -22.06%<br />
Zone 3 1.86% -28.14% 3.18% -26.82%<br />
Zone 4 1.29% -28.71% 1.95% -28.05%<br />
Zone 5 0.90% -29.10% 1.48% -28.52%<br />
Table 12: Scenario on change in rice productivity – proxy used for evaluating<br />
farmer’s risk and vulnerability to impact of climate change<br />
5.4.2 Result: Risk and vulnerability to climate impact of rain-fed farmer in lower Mekong<br />
River basin<br />
Baseline risk of farmer to climate impact<br />
From the assessment, the information from household survey was summarized<br />
and analyzed. The analysis shows that farmer in Lao PDR are highly resilience to climate<br />
impact as over 80% of the surveyed population is classified in the low risk group, while<br />
only less than 5% of the population is high risk to climate impact. However, on the<br />
contrary, surveyed farmers in Thailand are riskier to climate impact as about one-third of<br />
the surveyed population is classified as low risk and approximately 15%-25% are in the<br />
high risk category. The moderate risk group is the largest group of the surveyed farmers<br />
in Thailand, which in some study sites is as high as half of the total surveyed population.<br />
<strong>Final</strong> technical report – AIACC AS07 64
Climate Risk Group - Baseline condition<br />
% of Surveyed household<br />
100%<br />
80%<br />
60%<br />
40%<br />
20%<br />
0%<br />
4.40<br />
11.32<br />
84.28<br />
Lao PDR<br />
25.00 27.97 22.32<br />
39.58<br />
15.70 13.64<br />
50.41<br />
39.86<br />
44.64<br />
53.41<br />
35.42 33.88 32.17 33.04 32.95<br />
Thailand<br />
Zone 1<br />
Thailand<br />
Zone 2<br />
Thailand<br />
Zone 3<br />
Thailand<br />
Zone 4<br />
Thailand<br />
Zone 5<br />
High Risk<br />
Moderate Risk<br />
Low Risk<br />
Figure 31: Structure of risk groups to climate impact in each study site –<br />
Baseline condition<br />
From the assessment, the analysis shows that the low risk groups in every study<br />
site are highly resilience to climate impact and their risk profile is substantially differ<br />
from the moderate and high risk group. Their risk score is low in every criterion. In most<br />
cases, moderate and high risk group are riskier to climate impact because they lack of<br />
coping capacity and also expose to climate stress as the analysis result shows in the risk<br />
profile chart (see Figure 32), particularly the cases of the moderate and high risk groups<br />
in Thailand. On average, total risk score of the low risk groups in both Lao PDR and<br />
Thailand are approximately around 2 points, while the total risk score of the moderate<br />
and high risk group are around 7 and 10 points, respectively. The risk profile of each risk<br />
group in each location is shown in the chart below;<br />
<strong>Final</strong> technical report – AIACC AS07 65
12.00<br />
10.00<br />
Community climate risk profile: Baseline condition<br />
Lack of coping capacity<br />
Exposure to risk<br />
Sensitivity to risk<br />
Averaged risk score<br />
8.00<br />
6.00<br />
4.00<br />
2.00<br />
0.00<br />
0.02<br />
1.51<br />
0.90<br />
Low<br />
risk<br />
1.44<br />
3.50<br />
1.28<br />
Mod.<br />
Risk<br />
3.29<br />
3.86<br />
2.14<br />
High<br />
risk<br />
3.53<br />
4.00<br />
3.46<br />
3.67<br />
4.00<br />
3.05<br />
2.24<br />
2.08<br />
2.11<br />
2.38<br />
0.69 2.15<br />
0.24<br />
2.46<br />
0.37<br />
0.41 0.46<br />
2.63<br />
2.53<br />
2.56<br />
0.56 0.54 0.57 0.81 0.90<br />
0.97<br />
0.89<br />
1.00<br />
0.80<br />
0.87<br />
0.38 0.29 0.46 0.35 0.34<br />
Zone 1<br />
Low<br />
risk<br />
Zone 1<br />
Mod.<br />
risk<br />
Zone 1<br />
High<br />
risk<br />
Zone 2<br />
Low<br />
risk<br />
Zone 2<br />
Mod.<br />
risk<br />
Zone 2<br />
High<br />
risk<br />
Zone 3<br />
Low<br />
risk<br />
3.58<br />
Zone 3<br />
Mod.<br />
risk<br />
3.95<br />
3.40<br />
Zone 3<br />
High<br />
risk<br />
Zone 4<br />
Low<br />
risk<br />
3.40<br />
Zone 4<br />
Mod.<br />
risk<br />
3.96<br />
3.16<br />
Zone 4<br />
High<br />
risk<br />
Zone 5<br />
Low<br />
risk<br />
3.72<br />
Zone 5<br />
Mod.<br />
risk<br />
4.00<br />
3.42<br />
2.50<br />
Zone 5<br />
High<br />
risk<br />
Lao PDR<br />
Thailand<br />
Location: Study sites<br />
Figure 32: Profile of risk from climate impact each risk group at each study site<br />
Majority of the rain-fed farmer in Lao PDR is in low risk category, they are<br />
considered to be able to maintain their livelihood condition well under climate impact,<br />
partly because their household productivity is diversified over various activities, both onfarm<br />
and off-farm sources. As per interviewing with farmer in the study site, the rice<br />
production does not dominate the household productivity. They also live in the rural area<br />
where the population is low and surrounded by intact natural ecosystems that can provide<br />
sufficient products for alternate source of food as well as excess products that can be<br />
converted to or exchanged for other products required for daily necessity and cash. They<br />
also have other savings in form of reserved rice and cash convertible livestock to help<br />
them cope with impact from climate threat, even though cash saving is almost non-exist.<br />
In addition, the debt level of the farmer in Lao PDR is also virtually none, partly due to<br />
the limited availability of source of loan or other institutional lending mechanism, as well<br />
as social norms that is against indebt (Boulidam, 2005).<br />
From the field survey, the interviewed data revealed that the farmers in Thailand<br />
have very limited coping capacity, by having little saving and also high debt. They highly<br />
<strong>Final</strong> technical report – AIACC AS07 66
ely on income from rice production with little diversification. These conditions may<br />
cause them to be riskier to climate impact.<br />
Farmer’s risk and vulnerability to climate change: Climate condition under CO 2<br />
concentration 540 ppm<br />
By using changes in rice productivity, based on climate change impact scenarios<br />
as stated in Table 12, as proxy of climate change impact in the analysis and recalculating<br />
the risk scoring of each surveyed household, the analysis results shows that the profile of<br />
the risk groups has changed slightly.<br />
Under impact of climate change, over 80% of surveyed farmers in Lao PDR still<br />
are under low risk category. Approximately 10% is in moderate risk and slightly over 5%<br />
is in high risk category. There is no substantial different between the situation under<br />
normal condition and also the condition with influence of extreme climate event.<br />
In Thailand, there is no substantial change in the risk groups, which the moderate<br />
risk group is still the largest group in most cases, except in Zone 3 under influence of<br />
extreme event which the high risk group has become the largest group in the community.<br />
However, in case of the influence in extreme climate event, even though the low risk<br />
groups only slightly change in every zones, but there are noticeable changes in the<br />
moderate and high risk group, where there are number of household that move from<br />
moderate to high risk group.<br />
The risk group to climate change in climate condition under CO 2 concentration of<br />
540 ppm is shown in the chart below;<br />
<strong>Final</strong> technical report – AIACC AS07 67
Climate Risk Group - Climate condition under CO 2 = 540 ppm (normal & extreme condition)<br />
100%<br />
5.66<br />
6.29<br />
80%<br />
10.06<br />
12.58<br />
22.92<br />
30.21<br />
14.88<br />
28.10 27.27<br />
37.06<br />
22.32<br />
30.36<br />
13.64<br />
25.00<br />
% of Surveyed household<br />
60%<br />
40%<br />
84.28<br />
81.13<br />
40.63<br />
35.42<br />
50.41<br />
38.84 39.86<br />
32.87<br />
43.75<br />
39.29<br />
53.41<br />
42.05<br />
High Risk<br />
Moderate Risk<br />
Low risk<br />
20%<br />
36.46 34.38 34.71 33.06 32.87<br />
30.07<br />
33.93<br />
30.36 32.95 32.95<br />
0%<br />
Lao PDR<br />
(normal)<br />
Lao PDR<br />
(extreme)<br />
Thailand<br />
Zone 1<br />
(normal)<br />
Thailand<br />
Zone 1<br />
(extreme)<br />
Thailand<br />
Zone 2<br />
(normal)<br />
Thailand<br />
Zone 2<br />
(extreme)<br />
Thailand<br />
Zone 3<br />
(normal)<br />
Thailand<br />
Zone 3<br />
(extreme)<br />
Thailand<br />
Zone 4<br />
(normal)<br />
Thailand<br />
Zone 4<br />
(extreme)<br />
Thailand<br />
Zone 5<br />
(normal)<br />
Thailand<br />
Zone 5<br />
(extreme)<br />
Figure 33: Structure of risk groups in each study site to impact of climate change – Climate condition at<br />
CO 2 = 540 ppm<br />
When compare to the baseline condition, the impact of climate change under<br />
normal condition would cause almost one-fifth of the population in Lao PDR to be<br />
vulnerable and more than half of the population would be vulnerable under the influence<br />
of future extreme climate event coupled with climate change impact. However, in<br />
Thailand the impact of climate change is favorable to some households in the study sites<br />
and would make them to be less risky to climate impact, particularly in Zone 1. But the<br />
positive impact of climate change cannot cover the influence of extreme climate event,<br />
which causes large number of population, ranged from about 30% in Zone 1 to almost<br />
50% in Zone 5, to be vulnerable.<br />
<strong>Final</strong> technical report – AIACC AS07 68
Vulnerable group: Climate consition under CO 2 = 540ppm<br />
Percentage of surveyed<br />
household<br />
60.00<br />
50.00<br />
40.00<br />
30.00<br />
20.00<br />
10.00<br />
0.00<br />
-10.00<br />
-20.00<br />
53.46<br />
44.63 48.95<br />
40.18 37.50<br />
32.29<br />
16.98<br />
0.00<br />
-2.80 -2.68<br />
-12.50 -3.31<br />
Normal Extreme Normal Extreme Normal Extreme Normal Extreme Normal Extreme Normal Extreme<br />
Zone 1 Zone 2 Zone 3 Zone 4 Zone 5<br />
Lao PDR<br />
Location<br />
Thailand<br />
Figure 34: Vulnerable group from impact of climate change at each study site –<br />
Climate condition at CO 2 = 540 ppm<br />
Farmer’s risk and vulnerability to climate change: Climate condition under CO 2<br />
concentration 720 ppm<br />
Under impact of climate change in the climate condition at atmospheric CO 2<br />
concentration of 720 ppm, the change in rice productivity cause only slight change to the<br />
structure of risk groups, when compare to the condition under climate condition at CO 2<br />
concentration of 540 ppm, because climate change impact on rice productivity is slightly<br />
differ. The structure of risk groups in Lao PDR changed slightly and almost unchanged in<br />
case of study sites in Thailand when compare to the impact of climate change under<br />
climate condition at atmospheric CO 2 concentration of 540 ppm.<br />
<strong>Final</strong> technical report – AIACC AS07 69
Climate Risk Group - Climate condition under CO 2 = 720 ppm (normal & extreme condition)<br />
100%<br />
5.03 6.29<br />
80%<br />
10.69<br />
12.58<br />
19.79<br />
28.13<br />
14.05<br />
26.45 27.27<br />
37.06<br />
22.32<br />
30.36<br />
13.64<br />
25.00<br />
% of Surveyed household<br />
60%<br />
40%<br />
84.28<br />
81.13<br />
43.75<br />
36.46<br />
51.24<br />
39.67 39.86<br />
32.17<br />
43.75<br />
39.29<br />
53.41<br />
42.05<br />
High Risk<br />
Moderate Risk<br />
Low risk<br />
20%<br />
36.46 35.42 34.71 33.88 32.87 30.77<br />
33.93<br />
30.36 32.95 32.95<br />
0%<br />
Lao PDR<br />
(normal)<br />
Lao PDR<br />
(extreme)<br />
Thailand<br />
Zone 1<br />
(normal)<br />
Thailand<br />
Zone 1<br />
(extreme)<br />
Thailand<br />
Zone 2<br />
(normal)<br />
Thailand<br />
Zone 2<br />
(extreme)<br />
Thailand<br />
Zone 3<br />
(normal)<br />
Thailand<br />
Zone 3<br />
(extreme)<br />
Thailand<br />
Zone 4<br />
(normal)<br />
Thailand<br />
Zone 4<br />
(extreme)<br />
Thailand<br />
Zone 5<br />
(normal)<br />
Thailand<br />
Zone 5<br />
(extreme)<br />
Figure 35: Structure of risk groups in each study site to impact of climate change – Climate condition at<br />
CO 2 = 720 ppm<br />
Under impact of climate change at climate condition under CO 2 concentration of<br />
720 ppm, less population in Lao PDR is vulnerable when compare to the climate<br />
condition under CO 2 concentration of 540 ppm. In Thailand, about one-fifth of the<br />
population in Zone 1 is less risky to climate impact and this is also the case for small<br />
number of population in other areas. In the case of influence from extreme climate event<br />
coupled with climate change impact, high numbers of population in most areas are<br />
vulnerable, where the worse case is in Lao PDR and the least vulnerable is Zone 1 in<br />
Thailand, as summarized in the chart below;<br />
<strong>Final</strong> technical report – AIACC AS07 70
Vulnerable group: Climate condition under CO 2 = 720ppm<br />
Percentage of surveyed<br />
household<br />
60.00<br />
50.00<br />
40.00<br />
30.00<br />
20.00<br />
10.00<br />
0.00<br />
-10.00<br />
-20.00<br />
-30.00<br />
4.40<br />
52.20<br />
-20.83<br />
18.75<br />
40.50 46.15<br />
-5.79 -4.46<br />
-3.50<br />
37.50<br />
0.00<br />
36.36<br />
Normal Extreme Normal Extreme Normal Extreme Normal Extreme Normal Extreme Normal Extreme<br />
Zone 1 Zone 2 Zone 3 Zone 4 Zone 5<br />
Lao PDR<br />
Location<br />
Thailand<br />
Figure 36: Vulnerable group from impact of climate change at each study site –<br />
Climate condition at CO 2 = 720 ppm<br />
5.4.3 Conclusion<br />
The analysis result in this research gives an overview picture of farmer’s climate<br />
risk and how they would be vulnerable to the future climate change, as their rice<br />
productivity may be affected from changes in climate pattern by using quantitative<br />
approach on impact and risk analysis.<br />
The analysis result shows that vulnerability is a place-based condition, which<br />
depends upon the degree of impact as well as socio-economic condition and physical<br />
condition of each location. The profile of risk to climate change impact would differ from<br />
community to community and climate risk seems to be more serious from the impact of<br />
climate variability in the future, which impact of climate change that is favorable to some<br />
locations may not be able to cover. The local context that contributes to the livelihood of<br />
the society is also key factor to the vulnerability condition of the household in the<br />
community to climate change impact. In addition, the vulnerable society may not be high<br />
risk to climate impact, at least under definition of this study.<br />
This study is an effort in developing of quantitative approach for the vulnerability<br />
assessment process that also capture local context into the analysis, such as household<br />
expenditure that may vary from household to household and from community to<br />
community as well as from society to society. However, as this study is one of the pilot<br />
<strong>Final</strong> technical report – AIACC AS07 71
studies on the subject in this region, there still are many gaps in the process that need to<br />
be further improved for the future study activity. First of all, this study did not cover<br />
other non-climate stresses particularly the changes in socio-economic condition, which<br />
may have influence on farmer’s livelihood. The future socio-economic condition, e.g.<br />
cost of living, inflation, market structure and market condition, national and regional<br />
development policy, etc., could be greatly differ from current situation, especially in the<br />
timescale of climate change study. These non-climate factors are important drivers that<br />
may have significant influence on the future vulnerability and risk of any social group in<br />
the society to climate change impact. Therefore, appropriate socio-economic change<br />
scenarios should be developed and also be used in the risk analysis along with the climate<br />
change impact scenarios. In addition, single proxy of climate stress as used in the analysis<br />
of risk and vulnerability to climate change may be insufficient. Secondly, this study also<br />
did not cover the analysis on the threshold of farmer’s tolerance to climate impact,<br />
particularly in the categorizing of the risk groups. In addition, the accumulative impact to<br />
the household livelihood in the case of multi-year or consecutive year occurrence of<br />
extreme climate event should also be taken under consideration.<br />
The issue of accumulated risk and vulnerability condition may be a serious matter,<br />
especially in the case of farmer in Thailand, whose coping capacity is low with limited<br />
resource to buffer the serious climate impact on their on-farm productivity until the next<br />
cropping season. In addition, most of the households also have debt, which in many cases<br />
the debt is even higher than the annual income. The impact from multi-year climate threat,<br />
especially the extreme climate event that may occur in consecutive years, may drive them<br />
into very serious difficult economic condition. The vulnerability of farmer may<br />
accumulate over the threshold; they not be able to repay their debt and end up in losing<br />
their most important production resource, which is their farmland, and finally be forced<br />
to change their way of life or social status from being independent farmer to be hired<br />
farm labor or permanently move away from the sector to work in other economic sector.<br />
Future study may include the annual household cash flow analysis over period of time<br />
under different scenarios in order to understand household financial condition which is<br />
the result of multi-year climate stress.<br />
<strong>Final</strong> technical report – AIACC AS07 72
The focus on the understanding about vulnerability and adaptation to climate<br />
change of farmer in the lower Mekong region may need to be set on impact of climate<br />
variability over number of years, particularly the case of extreme climate anomaly that<br />
may increase in its frequency and magnitude in the future as result of climate change,<br />
especially in the case of serious extreme climate in consecutive years. This may help in<br />
the better understanding of how vulnerability could be accumulated and how farmer<br />
would be vulnerable to climate change.<br />
<strong>Final</strong> technical report – AIACC AS07 73
6 Adaptation<br />
Climate risks are not new to farmers of the lower Mekong. Important climate risks<br />
that are common to farmers of the region include mid-season dry spells that can damage<br />
young plants and late season floods just before harvest that can cause severe crop loss. Rice<br />
farmers’ experiences with measures to manage climate risks, and their perspectives on the<br />
potential for applying the same measures to adapt to climate change, are investigated through<br />
interviews and focus group discussions conducted in selected farming villages in Lao PDR,<br />
Thailand and Vietnam. While the climate hazards are similar for rice farmers across the study<br />
areas, significant differences are found in the measures used to cope with climate risks in the<br />
different villages. These differences in risk management practice arise from local and<br />
national differences in social, cultural, economic, and environmental conditions and policies,<br />
and suggest that effective strategies for adapting to climate change need to be attuned to the<br />
specific context of a place and time.<br />
Farmers of the lower Mekong River basin have been adapting to climate impacts<br />
throughout history and strategies for managing climate risks have evolved through time.<br />
However, it is difficult to separate adaptations made in response to climate pressures from<br />
actions taken in response to other forces emanating from demographic, social, economic,<br />
technological, environmental and other changes. In many cases, farm practices are a response<br />
to multiple risks from a variety of sources. Our study examines two types of actions: (i)<br />
actions that farmers consider to be mainly driven by climate risks and (ii) actions that are<br />
likely driven by other considerations but nevertheless improve the resilience of the farmer<br />
society with respect to climate stresses.<br />
<strong>Final</strong> technical report – AIACC AS07 74
6.1 Activities Conducted: Assessment adaptation to climate change of rain-fed farmer<br />
in lower Mekong River basin<br />
Figure 37: Study sites on the assessment of adaptation to impact of climate change in<br />
lower Mekong River basin<br />
6.2 Description of Scientific Methods and Data<br />
The assessment was based on field interview and group meeting with local<br />
stakeholders selected study sites, which are major rice farming areas in the region. The<br />
field interviews covered 290 households in Vientiane plain (May-June, 2005) and 160<br />
households in Savannakhet province (September, 2004) in Lao PDR; 560 households in<br />
Ubonratchathani Province (June-July, 2004) and 625 households in Kula Field (April-<br />
May, 2005) in Thailand; 60 households and provincial officials in the Mekong River<br />
delta area (June-July, 2004) in Vietnam. In addition, group discussion was also conducted<br />
with community leaders in Vientiane Plain and Kula Field during 2005 to discuss and<br />
evaluate adaptation options, which was summarized from the household interview.<br />
<strong>Final</strong> technical report – AIACC AS07 75
Figure 38: Household interview and group discussion on climate impact and<br />
adaptation strategy – farmer community in the study sites.<br />
The collected data are mostly qualitative information and reflect the opinions and<br />
perspectives of the respondents. The interviews and discussions focused on the following<br />
topics:<br />
• Observed changes in current climate pattern compared to the past (25-30 years<br />
or even longer).<br />
• The major climate threats and impacts to their farming activity.<br />
• Change in climate threat over the period of time, in terms of nature of threat,<br />
degree of impact, and the frequency of occurrence.<br />
• Measures and strategies for coping with the climate risks in the past, which<br />
include actions at household level, community level and external actions from<br />
government.<br />
<strong>Final</strong> technical report – AIACC AS07 76
• Potential measures and strategies for responding to possible future increases in<br />
the frequency or magnitude of extreme climatic events.<br />
6.3 Results: Adaptation strategy of rain-fed farmer in lower Mekong River basin to<br />
climate impacts<br />
Surveyed farmers identified numerous practices currently in use in their<br />
communities in Lao PDR, Thailand and that in their consideration lessen their<br />
vulnerability to present day climate variability and hazards. Some of the measures are<br />
motivated primarily by climate risks, while others are motivated by other concerns yet<br />
nonetheless reduce climate risks by increasing the resilience of farmers’ livelihoods to<br />
multiple sources of stress. They include measures that are implemented at the individual<br />
farm-level (see Table 13), the community-level (see Table 14), and the national-level (see<br />
Table 15).<br />
<strong>Final</strong> technical report – AIACC AS07 77
Table 13: Farm Level Measures for Managing Climate Risks<br />
Measure Objective Current Implementation Effectiveness Enabling and limiting<br />
factors<br />
On-farm measures<br />
Change seed variety -<br />
seasonal<br />
Food security - to<br />
maintain an<br />
acceptable level<br />
of productivity<br />
under the seasonal<br />
climate pattern.<br />
Lao PDR: Common practice - local seed varieties<br />
acceptable for local consumption. Indigenous knowledge<br />
still used for seasonal forecasting.<br />
Thailand: Limited - farming practice driven by market<br />
conditions; local seed varieties not widely accepted.<br />
Moderate – only able to<br />
cope with certain level of<br />
climate variability e.g.<br />
moderate dry-spell or<br />
moderate flood.<br />
• Precision of seasonal<br />
climate forecast<br />
• Market acceptance<br />
• Consumption<br />
preference<br />
Change seed variety -<br />
permanent<br />
To meet market<br />
requirements and<br />
increase resilience<br />
of farming to<br />
severe climatic<br />
condition.<br />
Vietnam: Moderate - short cycle seed variety also accepted<br />
by the market, but at lower price.<br />
Lao PDR: Limited - not influenced by market conditions<br />
due to the market structure. Also limited implementation<br />
in breeding research.<br />
Thailand: Common practice - in commercial farming.<br />
Possible to research ways to breed new varieties.<br />
Moderate - further<br />
research required in<br />
breeding new rice<br />
varieties<br />
• New breed<br />
availability<br />
• Market acceptance<br />
• Consumption<br />
preference<br />
Multiple farmland<br />
locations<br />
Adjusting planting<br />
technique & crop<br />
calendar to match<br />
climate pattern<br />
To balance risks<br />
from climatic<br />
impacts<br />
To maintain an<br />
acceptable level<br />
of productivity<br />
under the seasonal<br />
climate pattern.<br />
Vietnam: Common practice - commercial farming.<br />
Lao PDR: Limited - depends upon geographical<br />
characteristics of the village<br />
Thailand: Limited – depends upon land availability and<br />
geographical characteristics of the village<br />
Vietnam: Limited - depends upon the geographical<br />
characteristics of the village<br />
Lao PDR: Common practice – use of indigenous<br />
knowledge and flexibility in seed variety selection.<br />
Thailand: Moderate – change in seedling technique;<br />
inflexible crop calendar for some seed varieties dictated by<br />
the market<br />
High – can balance risk,<br />
but low future potential<br />
• Land availability<br />
• Population growth in<br />
the community<br />
• Geographical<br />
characteristics of the<br />
area<br />
Low • Precision of seasonal<br />
climate forecast<br />
• Flexibility of seed<br />
variety<br />
Vietnam: Moderate - long rainy season allows more<br />
flexibility in crop calendar and seed variety selection.<br />
<strong>Final</strong> technical report – AIACC AS07 79
Maintain appropriate<br />
farming conditions –<br />
e.g. small scale<br />
irrigation system /<br />
embankments in the<br />
farm land<br />
Planting alternate<br />
crops in between rice<br />
crop seasons<br />
To maintain an<br />
acceptable level<br />
of productivity<br />
under seasonal<br />
climatic stress.<br />
Additional food<br />
supply / additional<br />
income<br />
Lao PDR: Limited - lack of resources.<br />
Thailand: Moderate - limited investment capacity<br />
Vietnam: Moderate - limited investment capacity<br />
Lao PDR: Limited to moderate - depends on water<br />
availability and market conditions.<br />
Thailand: Limited to moderate - depends on water<br />
availability and market conditions.<br />
Low in Lao PDR due to<br />
lack of resources.<br />
Moderate to high in<br />
Thailand and Vietnam.<br />
• Geographical<br />
conditions<br />
• Initial investment<br />
• Operating cost<br />
Moderate. • Market<br />
• Farm land - size and<br />
condition<br />
• Water supply<br />
Changing to more<br />
climate resistant<br />
crops<br />
Household<br />
income security<br />
under climate<br />
stress.<br />
Vietnam: Limited to Moderate – 2 crop seasons for rice is<br />
the normal practice.<br />
Lao PDR: Limited - lack of know-how; based upon<br />
market conditions and dependence on rice cultivation for<br />
food security.<br />
Thailand: Limited to moderate - depends on resources<br />
available.<br />
High – only applicable to<br />
certain farms but has<br />
potential.<br />
• Soil condition.<br />
• Size of farm land<br />
• Know-how<br />
• Market conditions<br />
• Financial reserve<br />
• Local culture<br />
Livestock<br />
Secure household<br />
income under<br />
climate stress.<br />
Vietnam: Limited - dependence upon rice cultivation for<br />
national food security.<br />
Lao PDR: Common practice – at a small scale (household<br />
level).<br />
Thailand: Common practice - at a small scale (household<br />
level).<br />
High • Capital<br />
• Farm land - size and<br />
condition<br />
• Off-farm measures<br />
Harvest natural Additional food<br />
products<br />
supply / additional<br />
income<br />
Vietnam: N.A.<br />
Lao PDR: Common practice.<br />
Thailand: Limited - due to high population and ecosystem<br />
degradation.<br />
High in Lao PDR.<br />
Moderate to low in<br />
Thailand and Vietnam.<br />
• Productivity,<br />
diversity and<br />
condition of the<br />
natural ecosystem<br />
Non-farm products<br />
e.g. handicraft<br />
Additional<br />
income<br />
Vietnam: N.A.<br />
Lao PDR: Limited – due to the existing market structure.<br />
Thailand: Moderate – depends upon market conditions.<br />
Low to moderate in Lao<br />
PDR and Vietnam.<br />
Moderate in Thailand.<br />
• Know-how<br />
• Market<br />
<strong>Final</strong> technical report – AIACC AS07 80
Seasonal migrating<br />
Permanent migration<br />
Additional<br />
income<br />
Income security<br />
under conditions<br />
of climatic stress<br />
Vietnam: N.A.<br />
Lao PDR: Limited - due to existing urban economic<br />
conditions.<br />
Thailand: Common practice.<br />
Vietnam: N.A.<br />
Lao PDR: Limited - due to existing urban economic<br />
conditions.<br />
Thailand: Common practice.<br />
Low in Lao PDR and<br />
Vietnam. High in<br />
Thailand<br />
Low in Lao PDR and<br />
Vietnam. High in<br />
Thailand<br />
• Capacity of other<br />
economic sectors /<br />
urban areas<br />
• Networks for job<br />
search<br />
Capacity of other<br />
economic sectors / urban<br />
area<br />
Vietnam: Limited.<br />
<strong>Final</strong> technical report – AIACC AS07 81
Table 14: Community Level Measures for Managing Climate Risks<br />
Measure Objective Current Implementation Effectiveness Enabling and limiting factors<br />
Shared resources -<br />
rice reserve / fish<br />
pond<br />
Lao PDR: Common practice - partly due to<br />
culture and practice from war era.<br />
High in Lao PDR. Low in<br />
Thailand and Vietnam.<br />
Guaranteed replenishment<br />
(community rice reserve)<br />
Buffered food<br />
supply / additional<br />
income for<br />
community<br />
Thailand: Limited - competitive living<br />
conditions and repetitive crop failure.<br />
Village fund<br />
Funding to assist<br />
reinvestment in<br />
farming /<br />
sustaining<br />
livelihoods<br />
Vietnam: N.A.<br />
Lao PDR: Limited – has begun to expand and<br />
come under community management.<br />
Thailand: Common practice - under<br />
government management.<br />
Moderate in Lao PDR and<br />
Thailand.<br />
Guaranteed repayment by<br />
borrower<br />
Co-operative network<br />
among villages - offvillage<br />
farming<br />
practice<br />
To obtain partial<br />
rice production to<br />
sustain<br />
livelihoods<br />
Vietnam: N.A.<br />
Lao PDR: Moderate - depends on relationship<br />
between community leaders.<br />
Thailand: Limited - competitive living<br />
conditions.<br />
Low to moderate in Lao<br />
PDR. Low in Thailand<br />
and Vietnam.<br />
• Relationship between<br />
village leaders<br />
Processing farming<br />
and / or natural<br />
products<br />
Vietnam: N.A.<br />
Lao PDR: Limited.<br />
Thailand: Limited.<br />
Vietnam: N.A.<br />
Moderate • Know-how<br />
• Capital<br />
• Market<br />
<strong>Final</strong> technical report – AIACC AS07 82
Table 15: National Level Measures for Managing Climate Risks<br />
Measure Objective Current Implementation Effectiveness Enabling and limiting factors<br />
Financial support<br />
Lao PDR: Limited – limited institutional<br />
infrastructure<br />
arrangement and local cultural influence.<br />
Support in transition<br />
to a more diversified<br />
farming system<br />
Funding to assist<br />
reinvestment in<br />
farming /<br />
sustaining<br />
livelihood<br />
Sustained farming<br />
practice<br />
Thailand: Common practice.<br />
Vietnam: Moderate.<br />
Lao PDR: Limited - due to limited know-how<br />
and resources. Livelihoods also sustained by<br />
reliance on ecosystem products.<br />
Thailand: Limited – Expanding farming sector<br />
driven towards mono-cropping by the market.<br />
Low in Lao PDR. Moderate<br />
in Vietnam. High in<br />
Thailand.<br />
Low in Lao PDR. Moderate<br />
in Thailand and Vietnam.<br />
• Sufficient funding<br />
• Mechanism to reach and<br />
allocate available funds to<br />
the farmers in need<br />
• Terms and conditions of<br />
loan<br />
• Budget<br />
• Know how transfer<br />
Support in transition<br />
to other plants<br />
Sustained farming<br />
practice<br />
Vietnam: N.A.<br />
Lao PDR: Limited - need for focus on<br />
rice farming to provide food security.<br />
Thailand: Moderate - but limited to small<br />
farmland owners.<br />
Low in Lao PDR and<br />
Vietnam. Moderate in<br />
Thailand.<br />
• Budget<br />
• Know how transfer<br />
• Soil property<br />
Support in marketing<br />
village products<br />
Income<br />
diversification<br />
Vietnam: Limited - need for focus on rice<br />
farming for food security.<br />
Lao PDR: Limited - market structure.<br />
Thailand: Moderate<br />
Low in Lao PDR and<br />
Vietnam. Moderate in<br />
Thailand.<br />
• Appropriate marketing mix<br />
• Mechanism to develop a<br />
sustained market<br />
R & D - new seed<br />
varieties<br />
Sustain farming<br />
Vietnam: N.A.<br />
Lao PDR: Moderate - need to develop knowhow.<br />
Thailand: Common practice.<br />
Low in Lao PDR. Moderate<br />
in Thailand and Vietnam.<br />
• Budget<br />
• Time<br />
• Technology<br />
Infrastructure<br />
development - dams,<br />
Sustain farming<br />
Vietnam: Common practice.<br />
Lao PDR: Limited - limited investment<br />
capacity.<br />
Moderate • Budget<br />
• Geographical conditions<br />
<strong>Final</strong> technical report – AIACC AS07 83
other water diversion<br />
infrastructure,<br />
underground wells,<br />
irrigation network<br />
Information for<br />
farming planning –<br />
e.g. seasonal or interannual<br />
climate<br />
prediction<br />
Proper planning<br />
of farming<br />
activities.<br />
Thailand: Moderate - also limited technical<br />
feasibility.<br />
Vietnam: N.A.<br />
Lao PDR: Nonexistent.<br />
Thailand: Limited.<br />
Vietnam: Limited.<br />
Moderate • Technology<br />
• Communication channel and<br />
format<br />
<strong>Final</strong> technical report – AIACC AS07 84
While none of the measures are motivated by perceived needs to adapt to humaninduced<br />
climate change, many measures that are focused on near-term climate risks could<br />
be developed further for longer-term climate change adaptation (Kates, 2001).<br />
Implementation and effectiveness of the measures in the different countries, some of the<br />
enabling and limiting factors that give rise to differences across the countries, and their<br />
potential as adaptations to climate change are examined below.<br />
Managing climate risks in Vientiane Plain and Savannakhet, Lao PDR<br />
Most farmers in Vientiane Plain and Savannakhet Province are subsistence<br />
farmers, producing rice mainly for their own consumption. They have farms of moderate<br />
but sufficient size for producing rice to support annual consumption of the farm<br />
household. They produce a single rice crop each year and their use of mechanized and<br />
advanced farm technology and institutional instruments are limited. The communities are<br />
still surrounded by intact natural ecosystems from which natural products can be<br />
harvested. This strengthens livelihoods by supplementing and diversifying the farm<br />
household’s food and income sources. (Boulidam, 2005)<br />
Farmers of the Lao PDR study sites tend to rely mostly on farm level measures<br />
for adapting to climate hazards and to a lesser degree on collective actions at the<br />
community level. Measures at the national level are very limited. Consequently, the<br />
capacity of the individual farm household to adapt is a key limiting factor at present for<br />
managing climate risks. Their responses to climate hazards aim mainly at basic<br />
household needs, primarily food security of the household. Common measures<br />
implemented by rice farmers include seasonal changes in seed variety, cultivation<br />
methods, and timing of farm management tasks based upon seasonal climate forecasts<br />
made with indigenous knowledge. Also common are raising livestock, and harvesting<br />
natural products for additional food and income.<br />
The use of indigenous knowledge to make seasonal climate predictions is still<br />
popular. Indigenous knowledge based upon observations and interpretations of natural,<br />
e.g. the height of ant nests in trees, color of frogs’ legs, color of lizard’s tails, and various<br />
indicators of the dry season climate pattern, is used to make forecasts of the onset and<br />
cessation of the rainy season, quantity of rain and other climate parameters (Boulidam,<br />
<strong>Final</strong> technical report – AIACC AS07 85
2005). The forecasts are used for seasonally adjusting choices of seed varieties and time<br />
and methods for soil preparation, seeding, planting, fertilizing, weeding, harvesting and<br />
other tasks (Grenier, 1998). Because farmers in Vientiane Plain and Savannakhet<br />
Province grow rice mainly for their own consumption and/or to sell the excess production<br />
to the local market for local consumption, they have flexibility to select the seed variety<br />
to match local climate conditions without regard for the requirements of the market.<br />
Changing seed varieties in accordance with indigenous seasonal climate predictions is<br />
considered to be moderately effective by the surveyed farmers, while adjusting the<br />
methods and timing of farming practices are considered to have low effectiveness due to<br />
the precision in seasonal climate forecast and other physical limitations. Performance of<br />
these measures for adapting to climate change potentially could be enhanced by<br />
implementation of an early warning system based on modern inter-annual and seasonal<br />
climate forecasting, coupled with risk communication techniques to reach the populations<br />
at risk. Constraints on this measure include the precision of seasonal climate forecasts,<br />
ability and institutional network to communicate the forecasts in ways that are useful to<br />
farmers, acceptance of the forecasts by farmers, availability of suitable seed varieties, and<br />
flexibility for changing the crop calendar for their cultivation.<br />
There is less flexibility for farmers in the Lao PDR sites to change the rice variety<br />
on a semi-permanent basis to one that is more climates resilient or switching to an<br />
alternative crop. Constraints on these measures include lack of appropriate seed types,<br />
consumption preferences, national dependence on rice for food security, market<br />
conditions, lack of know how, lack of required financial reserves and other factors.<br />
Consequently these measures have limited current use. Where they have been used, these<br />
measures are considered by farmers to have moderate to high effectiveness for reducing<br />
vulnerability to climate and so are potential options for adapting to climate change. But<br />
the factors that constrain current use would need to be overcome. Growing a crop other<br />
than rice during the dry season is another moderately effective measure that is practiced<br />
to a limited or moderate degree and which can be an effective adaptation to climate<br />
change. But its use is restricted to where there is access to water and suitable markets.<br />
The community still has an important role in the management of climate risks in<br />
the study areas of Lao PDR. For example, in case of severe loss of rice production, the<br />
<strong>Final</strong> technical report – AIACC AS07 86
village leader would establish a cooperative network with other villages with small scale<br />
irrigation systems. Shared water would be applied to shared farmland for cultivation of<br />
short cycle rice varieties during the dry season to supplement the community’s food. In<br />
addition, shared resources, such as a community rice reserve contributed by households<br />
in the village, or a community fish pond, also act as buffers to climate hazards that<br />
sustain livelihoods and food security of the community. However, some of these<br />
collective actions are becoming obsolete, or will be in the near future, due to changes in<br />
socio-economic conditions. Forces that have reduced the role of community level actions<br />
include population growth and expansion in the use of credit from an established<br />
institution as an alternative to shared community resources for coping with crop losses.<br />
National level measures to manage climate risks are reported by surveyed farmers<br />
to be limited in scope and scale to date in Lao PDR. National action on climate risks has<br />
been constrained by local culture, lack of institutional arrangements to address climate<br />
risks, and limited know-how, resources, and investment. Looking to the future, climate<br />
change is magnifying climate risks and increasing the amount of resources, technology<br />
and know-how that will be needed to manage the risks. Farmers have very limited<br />
capacity to adapt to the changes and the diminishing role of communities is widening the<br />
gap between needs and capacities for managing risks. Consideration should be given to<br />
measures at the national level that would enhance capacity and enable actions for<br />
managing and adapting to climate risks at the farm level and at the community level.<br />
Managing climate risks in Kula Field and Ubonratchathani Province, Thailand<br />
Rice farmers in Thailand, particularly in the study areas in the northeast, are<br />
mostly commercial farmers who live in a monetary oriented society and grow rice<br />
primarily for national and international markets. They have farms of moderate size on<br />
which they produce a single rice crop each year using mechanized and modern<br />
technologies and institutional instruments. The sale of rice is their main source of income<br />
which is used primarily to purchase household basic needs, including rice for<br />
consumption, which could be cheaper in price and of different quality and texture than<br />
the rice the farm household grows. Only a small portion of farmers with larger farms are<br />
able to divide their farmland to grow both commercial rice variety for sale and a local<br />
<strong>Final</strong> technical report – AIACC AS07 87
ice variety for their own consumption or sale in the local market. The farming<br />
communities are closely linked to urban society The surrounding land area is populated<br />
and used for settlements or is deteriorated natural forest that can provide only limited<br />
natural products as supplement or alternate source of food and income. (Kerdsuk, et al,<br />
2005)<br />
According to the field assessment, farmers at the study sites in Thailand tend to<br />
rely on household and national level measures for reducing climate risks, while the role<br />
of community level measures has declined or been neglected. The household level<br />
measures focus on income diversification, primarily from off-farm sources that are not as<br />
sensitive to climate variations as income from rice (Kerdsuk et al., 2005). The main<br />
practice is seasonal migration to work in the cities, which can lead to the permanent<br />
migration of some members of the family in order to secure fixed income for the<br />
household. Wage income from city employment is less sensitive to climate and helps to<br />
insulate the farm household from climate driven variations in farm income. Seasonal and<br />
permanent migration to diversify and supplement household incomes are more common<br />
in the Thai study sites than in Lao PDR and Vietnam and are made possible by close<br />
links between the rural villages an urban areas where there is demand for labor.<br />
Unlike the studied communities in Lao PDR, where seasonal changes in rice<br />
variety and the crop calendar made in response to seasonal climate forecasts is common<br />
practice, these measures are little used by rice farmers in Kula Field and Ubonratchathani<br />
Province. Because they grow rice for national and international markets, they are limited<br />
in their ability to use local seed varieties, which fetch lower prices than commercial rice<br />
varieties, and to alter their crop calendar. In contrast, semi-permanent changes in seed<br />
variety to commercial varieties that are more resilient to climate stresses is common<br />
practice of farmers at the Thai study sites. This is made possible by the greater financial<br />
resources of commercial farming and by research and development programs that provide<br />
new rice varieties that are both accepted in the market and more resistant to stress. This<br />
option could be moderately effective for adapting to climate change. Limitations on<br />
wider use are financial, technological and environmental.<br />
Other on-farm measures for reducing climate risk practiced by rice farmers in<br />
Thailand include changing seedling technique, using hired, growing alternate crops<br />
<strong>Final</strong> technical report – AIACC AS07 88
etween rice seasons and raising livestock. Some farmers make investments to increase<br />
and sustain the productivity of their farms in ways that make them more resilient with<br />
respect to climate variations and changes. For example, they construct small scale<br />
irrigation systems to provide an alternate source of water for mid-season dry spells or for<br />
growing a crop during the dry season. They may also build embankments to protect their<br />
fields from flood damage. Such measures are more common than in Lao PDR. But<br />
greater use is limited by financial requirements for investment and maintenance. A small<br />
number of farmers with large land holdings implement mixed farming practice or switch<br />
part of their farmland from rice to a crop that is more resistant to climate stresses.<br />
Harvesting of natural products from forests, a common practice in Lao PDR, is limited at<br />
the study sites in Thailand because of high population densities and the degraded nature<br />
of forests that are adjacent to farm lands.<br />
National level policies and measures that serve to reduce vulnerability to climate<br />
hazards are more prevalent in Thailand than in Lao PDR and Vietnam. These policies and<br />
measures were not motivated by concerns about climate stress, especially climate change,<br />
but mainly by poverty reduction goals. Yet, national measures in Thailand have<br />
supported financial needs, infrastructure development, transitions to more diversified<br />
farming systems, marketing of local farm products, and farm planning that have helped to<br />
improve livelihoods of farmers and increase their resilience to climatic stresses. For<br />
example, an initiative of the Ministry of Agriculture and Cooperative in 2004<br />
(Department of Livestock Development) diversifies farming activity by promoting and<br />
supporting farmers to raise livestock. Another initiative promotes transition from rice<br />
cultivation to other plantation crops that are more resistant to climate stresses such as<br />
rubber trees. Research and development by government research facilities have provided<br />
new varieties of rice that are more resilient to climate variations while maintaining the<br />
quality that is required by the market.<br />
Community level measures are not common in Kula Field and Ubonratchathani<br />
Province, with the exception of village funds for local investments to support farm<br />
livelihoods, which are managed by the government. The role of community or local<br />
administration units for planning as well as implementing future adaptation to climate<br />
<strong>Final</strong> technical report – AIACC AS07 89
change in cooperation with the national agency could be promoted as local institutions<br />
can better address local needs and be more flexible and timely in implementation.<br />
Managing climate risks in Mekong River Delta, Vietnam<br />
Rice farmers of the Mekong River delta in Vietnam are mainly commercial<br />
farmers. They are able to grow two rice crops each year due to a longer rainy season, can<br />
sustain annual consumption, make moderate use of modern farm technology and use<br />
institutional instruments in farming practice. The household relies heavily on income<br />
from rice production. The farm communities are surrounded by populated areas and are<br />
not tightly tied to the urban economic system. (Field interview in Long An, Can Tho,<br />
Dong Thap and An Giang Provinces, Vietnam, 2004).<br />
The rain-fed rice farmer in Vietnam tends to rely on measures implemented at the<br />
household level and aimed mainly toward on-farm actions to protect against climate<br />
hazards. Community and national level measures play very limited role in reducing their<br />
climate risks. The farm-level solutions include efforts and investments to increase and<br />
sustain the productivity of their farms such as construction and maintenance of small<br />
scale irrigation systems or embankments to protect their farmland from flood. But<br />
investment costs and limited financial capacity of farmers limit wider use of these<br />
measures. Using an alternative strategy, some farmers in the study sites have adapted to<br />
flood by accepting floods as part of the ecosystems of their farmland, adjusting their the<br />
crop calendar accordingly and allowing their lands to be flooded, thereby gaining<br />
advantages from nutrients being deposited that enhance soil fertility and pollutants being<br />
washed from their farmland. In addition, use of alternate crops and seed varieties are also<br />
common adaptation measures of the farmer in the Mekong River delta in Vietnam.<br />
Changing the variety of rice grown, both seasonally in responses to climate<br />
forecasts and semi-permanently, is practiced by Vietnamese farmers, even though they<br />
are commercial farmers and grow rice to match market demand. Because the rainy season<br />
in the Mekong River delta is usually 7 months long, two crop cycles of rain-fed rice can<br />
be grown in one year. A two-crop cycle is also facilitated by the availability of shortcycle<br />
rice varieties that are suitable for growing in Vietnam and that are accepted by the<br />
market. This gives additional flexibility to farmers in Vietnam to select varieties of rice<br />
<strong>Final</strong> technical report – AIACC AS07 90
so as to balance the risk of losses from climate events against expected market returns<br />
according to farmers’ preferences regarding risk. Consequently, seasonal change of rice<br />
variety is more commonly observed among rice farmers in Vietnam than in Thailand.<br />
Community level measures at the study sites in Vietnam are very limited and have<br />
low effectiveness. Some measures are implemented on a national level in Vietnam that is<br />
considered by farmers to be moderately effective. National research and development<br />
programs have facilitated changes in rice varieties by farmers that lessen vulnerability to<br />
climate extremes. Also being implemented but on limited scale are national support for<br />
transition to alternative crops and provision of climate forecast information to farmers to<br />
assist with farm planning efforts.<br />
Many measures for managing climate risks are common to all the study sites, at<br />
least in general characteristics. But, as shown above, there are substantial differences<br />
across the study sites in the degree to which the farmers’ rely on farm-level, communitylevel<br />
and national-level actions, farm households’ objectives, the status of enabling and<br />
limiting factors, and the prevalence and effectiveness of different measures. These<br />
differences are apparent despite our focus on farmers who all make their livelihood<br />
primarily from growing rain-fed rice in a common river basin of Southeast Asia and who<br />
are exposed to similar climate hazards. The differences demonstrate the strong influence<br />
exerted by the local context on climate risk management. The measures that are used and<br />
their effectiveness are place and time specific.<br />
Still, some commonalities do emerge from the experiences of farmers across the<br />
study sites. We summarize some of the commonalities and differences below. In<br />
interpreting the findings, it should be borne in mind that the exploratory assessment<br />
surveyed farmers at only two sites in Lao PDR and Thailand and only one site in Vietnam.<br />
While for convenience of exposition, we write of farmers in Lao PDR, Thailand or<br />
Vietnam, it would be misleading to extrapolate from farmers at the selected sites to<br />
characterize the condition and practices of farmers nationwide in any of the three<br />
countries. Differences in local context within a country can yield different risk<br />
management approaches and performance across communities of the country, just as they<br />
do in our comparisons of study sites from different countries.<br />
<strong>Final</strong> technical report – AIACC AS07 91
At all of the study sites, farmers rely primarily upon their own capacity for<br />
implementing farm-level measures. But the context for farm-level action is shaped by<br />
what is done at community and national levels. Community-level measures are most<br />
prevalent in the farm communities of Vientiane Plain and Savannakhet Province in Lao<br />
PDR, where they play an important role in providing food security buffers and<br />
strengthening livelihoods. Farmers from the study sites in Thailand and Vietnam report<br />
that community-level measures are used only to a limited degree and are much<br />
diminished relative to the past. This too is the trend in Lao PDR sites. The diminishing<br />
role of collective action at the community-level may be an important deficit in the<br />
capacity of these communities to adapt to future climate change.<br />
Our evaluation of national-level measures are based on the perspectives reported<br />
by farmers and community leaders at the study sites and do not reflect a comprehensive<br />
evaluation of national policies and programs that are related to climate risks. But this is<br />
an important perspective as it gives a sense of what is happening on the ground, at least in<br />
the communities surveyed. In none of the three countries can the national-level measures<br />
of which farmers are aware be described as constituting a national strategy for managing<br />
climate risks. The actions are not coordinated and typically are not designed specifically<br />
to combat climate risks.<br />
Still, national-level measures in Thailand, as perceived and reported by farmers in<br />
the Thai communities of Kula Field and Ubonratchathani Province, are greater than what<br />
is reported by farmers surveyed in the other two countries and are an important<br />
complement to farm-level measures there. National level actions in Thailand provide<br />
financial and other support for investments in farming infrastructure, expansion of<br />
farming technologies, including climate resilient varieties of rice and other crops,<br />
sustainable farming practices, and diversified farm incomes. These efforts help to<br />
strengthen farm livelihoods and make them more resilient to climate and other shocks. In<br />
Vietnam, the national government supports research and development of seed varieties<br />
and provides financial support for investment in farm sector infrastructure, but other<br />
measures by the national government are reported by farmers to be limited. Nationallevel<br />
measures are the least prevalent in Lao PDR and do not presently play a strong role<br />
in making farm households in the study sites climate resilient.<br />
<strong>Final</strong> technical report – AIACC AS07 92
Farmers’ objectives, priorities and capacities for using farm-level risk<br />
management measures vary across the study sites, and this influences their choice of<br />
measures. At the Lao PDR sites, most farmers practice subsistence agriculture and<br />
depend primarily on their own rice production for their food supply. Their choice of rice<br />
variety to cultivate need only satisfy their own preferences and are not constrained by<br />
market requirements. They have access to healthy forests, from which they can harvest<br />
products to supplement their food supply but have little opportunity for earning monetary<br />
income and have low financial reserves and other assets. Consequently, their choices<br />
emphasize providing and protecting basic household needs, most particularly household<br />
food security, and employ strategies that have little financial cost and rely on household<br />
labor, indigenous knowledge, and use of natural products.<br />
Rice farmers in Kula Field and Ubonratchathani Province in Thailand are very<br />
much oriented to the market economy. They grow rice for cash income and have<br />
opportunities to participate in nearby urban labor markets. Their participation in<br />
commercial activities provides them with important financial resources and capacity, but<br />
their income can be volatile due to climate and market events and market requirements<br />
for commercial rice can limit options for changes in rice cultivation. Consequently, their<br />
choices emphasize diversifying household income, particularly from off-farm labor,<br />
adoption of rice varieties that are more climate resilient and thus less variable in the<br />
income they provide, and investments such as small scale irrigation and flood control that<br />
improve the productivity and resilience of their farmland.<br />
In the Mekong River delta of Vietnam, farmers grow rice commercially but have<br />
little opportunity to participate in urban labor markets and so are highly dependent upon<br />
the cash income from sale of their rice. They have some financial resources and benefit<br />
from a longer rainy season than occurs at the Thai and Lao PDR sites that allows them to<br />
grow two rice crops each year. The availability of short-cycle rice varieties that are<br />
suitable for growing on their farms and are accepted by the market also gives them<br />
greater flexibility to vary their rice cultivar and crop calendar if the season is expected to<br />
be unusually short or dry. Choices of the surveyed Vietnamese farmers emphasize<br />
varying cultivation practices to reduce the risk of damage or loss to the rice crop and<br />
investments to improve the productivity and resilience of their farms.<br />
<strong>Final</strong> technical report – AIACC AS07 93
The adaptation strategy tends to link closely to the socio-economic condition of<br />
each country. In Thailand, where the urban economy provides opportunity for large<br />
number of labor force, transportation is easily accessible, lack of natural ecosystem to<br />
rely on for food security as well as to provide products to substitute the loss of income;<br />
has led the vulnerable farmer to take the option to do seasonal migration to the city as the<br />
most popular choice. However, in case of Lao PDR, farmer tends to fall back on natural<br />
eco-system to sustain their livelihood. This also due to the urban economy is smaller size,<br />
in addition, the natural ecosystem is still very much intact and population density is low,<br />
therefore, they can harvest natural product to compensate the lost of household income<br />
and also to use the harvested product as supplement source of food too. The Viet Nam<br />
framer tends to develop on-farm adaptation, e.g. adjusting farming technique, to cope<br />
with impact from climate on their rice production.<br />
6.4 Conclusion<br />
Farmers of the lower Mekong River basin are exposed to a variety of climate<br />
hazards that threaten their livelihoods, food security and wellbeing. Those who cultivate<br />
rain-fed rice as a primary source of food or income are particularly vulnerable to climate<br />
variations such as prolonged dry spells during the growing season and flooding at the end<br />
of the season prior to harvest, events that are common in the current climate. Human<br />
induced climate change is expected to bring greater and possibly more intense rainfall to<br />
the region, which would increase flood risks to farmers.<br />
Rice farmers are experienced in managing climate risks and employ a variety of<br />
measures to reduce their vulnerability that are highly place and time specific. The<br />
measures used differ according to the specific climate hazards faced, physical and<br />
environmental constraints, available technologies, social and economic condition of the<br />
farm household and community, vitality of community institutions, degree of engagement<br />
in the market economy, market conditions, and the priorities and objectives of the farm<br />
households. Results from surveys of farmers in selected communities of Lao PDR,<br />
Thailand and Vietnam suggest a pattern that is shaped by the socio-economic condition<br />
of their surrounding community. Farmers in communities with less developed socioeconomic<br />
conditions tends to pursue simple strategies targeted at increasing coping<br />
<strong>Final</strong> technical report – AIACC AS07 94
capacity and sustaining basic needs that can be implemented at the household or<br />
community level with limited financial and other resources. Farmers in communities with<br />
more developed socio-economic conditions tend to pursue strategies targeted at reducing<br />
the variability of income and at improving the productivity and resilience of their farms.<br />
The measures that they adopt tend to depend more on market and other institutions,<br />
improved technologies and financial resources than is the case for farmers in less<br />
developed communities.<br />
The measures that are in use in the surveyed communities address current climate<br />
risks. They are not deliberate attempts to adapt to climate change. But they provide a<br />
basis of experience, knowledge and skills upon which to build a climate change<br />
adaptation strategy. They also demonstrate a history in the region of farmers acting<br />
effectively, within their constraints, in their self-interest to reduce their vulnerability to<br />
climate hazards. Despite these efforts, farmers in the region, particularly those who rely<br />
on rain-fed crops, are still strongly impacted by prolonged dry spells, floods and other<br />
climate events. They are highly vulnerable to climate hazards now and so can be<br />
expected to be highly vulnerable to climate change in the future.<br />
Their vulnerability is partly due to lack of capacity of farm households, lack of<br />
capacity of rural communities and lack of coordinated national strategies to support<br />
farmers and their communities to manage climate risks. An effective starting point for a<br />
national strategy of climate change adaptation would be to integrate into farm, rural<br />
development and poverty reduction policies the objectives of raising the capacities of<br />
farm households and rural communities to manage present climate risks. Some national<br />
policies in the region already do this to a limited extent, though not with the explicit<br />
intent to do so.<br />
Farm households need help with financial resources, opportunities for off-farm<br />
income, marketing of farm products, access to water and healthy ecosystems, information<br />
about current and changing climate hazards, know-how to diversify their farming<br />
practices and to apply new farming methods and technologies, and access to improved<br />
varieties of rice and other crops. They also need buffers to protect their food security,<br />
health and livelihoods when they suffer severe crop or financial loss. Delivering this<br />
assistance to bolster the capacity of farm households requires community level<br />
<strong>Final</strong> technical report – AIACC AS07 95
institutions with vitality and high capacity. Community institutions can also play a role in<br />
coordinating collective actions that require pooled resources to implement. Sadly,<br />
community level institutions in the surveyed communities are in decline and some<br />
community-level measures are becoming obsolete. A reversal of this trend will be<br />
important for maintaining existing capacity and raising capacity to the levels that will be<br />
needed to address the challenges of climate change.<br />
While not addressed directly in the study, coordinated regional action by the<br />
countries of the lower Mekong River basin should also be considered. The countries<br />
share a common resource, the Mekong River. Climate change will alter water availability,<br />
water quality, flood risks, and the performance and sustainability of river dependent<br />
livelihood systems throughout the basin. The actions taken within any of the countries to<br />
adapt to these changes are also likely to have trans-boundary effects.<br />
In this context, the countries of the lower Mekong River region should explore the<br />
potential for trans-boundary effects of their actions, options for reducing negative transboundary<br />
effects, and options for collective actions that may yield positive transboundary<br />
effects.<br />
<strong>Final</strong> technical report – AIACC AS07 96
7 Capacity Building Outcomes and Remaining Needs<br />
The research activity under this AIACC regional study, which also coupled with<br />
capacity building program under Asia-Pacific Network for Global Change Research (APN),<br />
had involved number of researchers and research assistants into the study under various steps<br />
and different disciplines in this integrate study. The workshop and training as well as handon<br />
exercise on research activity under this regional study had increased their abilities in<br />
climate change study, both on the natural science discipline as well as social science<br />
discipline.<br />
The major capacity building outcome on research capacity consist of over 20<br />
researchers, who had actively involved in the study, and network among the institutes in the<br />
3 countries in the Southeast Asia region, as well as network with other research institutes<br />
outside the region, which had interaction through activities in the AIACC. The names of<br />
institutions that had been actively involved in the regional study are as follows:<br />
o Chulalongkorn University, Thailand<br />
o Chiang Mai University, Thailand<br />
o Mahidol University, Thailand<br />
o Khon Kaen University, Thailand<br />
o Ubonratchathani University, Thailand<br />
o Meteorological Department, Ministry of Science, Thailand<br />
o Department of Agriculture, Ministry of Agriculture, Thailand<br />
o Land Development Department, Ministry of Agriculture, Thailand<br />
o National University of Laos, Lao PDR<br />
o National Agriculture and Forestry Research Institute, Ministry of Agriculture, Lao<br />
PDR<br />
o Environmental Research Institute, Science Technology and Environment Agency,<br />
Lao PDR<br />
o Water Resource Coordinating Committee, Office of the Prime Minister, Lao PDR<br />
o Sub-institute of Hydrometeorology of South Vietnam, Vietnam<br />
o Commonwealth Scientific and Industrial Research Organization (CSIRO),<br />
Australia<br />
<strong>Final</strong> technical report – AIACC AS07 97
In addition to the researchers and research assistants, there were 2 graduate students<br />
who had been directly involved and developed their thesis under this regional study.<br />
o Mrs.Somkhith Boulidam, lecturer from National University of Laos, Lao PDR<br />
MSc. (Natural Resource Management), Mahidol University, Thailand. Thesis<br />
title: Vulnerability and Adaptation of Rain-fed Farmers to Impact of Climate<br />
Variability in Lahakhok, Sebangnuane, Tau, Dongkhamphou and Koudhi Villages<br />
of Songkhone District, Savannakhet Province, Lao PDR.<br />
o Mr.Somvang Bouttavong, Water Resource Coordinating Committee from Lao<br />
PDR. MSc. (Natural Resource Management), Mahidol University, Thailand.<br />
Thesis title Application of Climate Change Scenarios in Studying the Effect of<br />
Climate Change on Crop Water Requirement and Water Balance in a Reservoir:<br />
A Case Study of the Planned Nam Nga Gnai Reservoir Project, Sanakham<br />
District, Vientiane Province, Lao PDR.<br />
Remaining needs includes improved tools and data which are vital and be<br />
fundamental for future study in climate change. Among various tools and data needed are<br />
high resolution climate scenarios. Local ability need to be developed to run climate model at<br />
high resolution, with ability to fine tune the simulation to match specific requirement of<br />
impact analysis in each area of study. This may include multiple climate models, particularly<br />
those that can execute on low cost computing facilities, e.g. PC or cluster of PC, and also<br />
global dataset under different scenarios. In addition to the tools and dataset, know-how<br />
transfer in form of training and/or consultancy to local researcher is also required, at least in<br />
the initial stage.<br />
The study on climate change and its impact as well as vulnerability and adaptation<br />
still need to be conducted on many other systems and sectors in many other aspects to<br />
produce information that can support policy making. In order to do this, institution capacity<br />
as well as researchers still needs to be further developed and expanded. This also include<br />
needs for regular forum to exchange idea, new finding, initiative on new collaboration, which<br />
would not be limited only on academic community but also to include government agencies,<br />
public organization, NGO, press, etc. in order to raise higher awareness on climate change<br />
<strong>Final</strong> technical report – AIACC AS07 98
issues that may lead to further policy initiation and implementation, especially the transboundary<br />
issues and/or regional collaboration in collective adaptation to climate change.<br />
8 National Communications, Science-Policy Linkages and Stakeholder<br />
Engagement<br />
The next Second National Communications to UNFCCC would emphasize<br />
substantially more on the impacts of climate change on natural system and human society<br />
than its first generation, yet expertise and know-how to assess and formulate adaptive<br />
strategy in systematic ways are still much lacking in the Mekong River countries. The<br />
activities under this research had helped in develop research capacity of both personnel as<br />
well as network among institutions in Lao PDR, Thailand and Viet Nam to be able to assist<br />
or responsible in the preparation of the next National Communication to UNFCCC.<br />
In addition, the result from the activities under this research, which includes tool, data,<br />
methodology, analysis summary, etc., such as model and dataset, high resolution regional<br />
climate scenario, analysis on impact of climate change on hydrological regime and crop<br />
productivity, etc., would be summarized and disseminated to relevant policy makers as well<br />
as other stakeholders in the Southeast Asia region for further study in wider scale as well as<br />
be used in future policy consideration.<br />
However, as the preparation of second National Communications to UNFCCC has<br />
not yet started in the countries where this regional study had involved in the study, so the<br />
issue on future contribution from this research to the National Communications to UNFCCC<br />
is yet to be followed up.<br />
As far as the science-policy linkage is concerned, the principle investigator of this<br />
research, Dr.Anond Snidvongs, was appointed a member of National Climate Change<br />
Committee of Thailand and the associate investigator, Mr.Suppakorn Chinvanno, was also<br />
appointed a member of working group in developing national climate change strategy for<br />
Thailand.<br />
<strong>Final</strong> technical report – AIACC AS07 99
9 Outputs of the project<br />
This regional study had produced tools, dataset and publications (even though, not<br />
published in peer reviewed publication, but could be useful for the region). These outputs are<br />
available for academic and non-profit used. The website is still under construction, but they<br />
also can be requested at:<br />
Mr.Suppakorn Chinvanno<br />
Southeast Asia START Regional Center<br />
5 th Floor, Chulawich 1 Building,<br />
Chulalongkorn University,<br />
Henri Dunant Road,<br />
Bangkok 10330,<br />
Thailand<br />
Tel: (66 2) 218 9464 to 9<br />
suppakorn@start.or.th<br />
Tools<br />
o Crop modeling tool – MRB rice shell.<br />
This is a tool to help in analyzing climate impact on rice productivity yield in the<br />
lower Mekong River basin.<br />
Database<br />
o High resolution future climate scenarios:<br />
<strong>Final</strong> output domain: 5-35 Degree N and 92 -110 Degree E<br />
Output resolution was interpolated to 0.1 degree (about 10 km)<br />
Temporal timestep for output: Daily<br />
Daily output variables:<br />
• Tmax, min and avg T (ºC)<br />
• Rainfall (mm/d)<br />
• Wind speed (m/s)<br />
• Radiation (W/m2)<br />
<strong>Final</strong> technical report – AIACC AS07 100
However, the adjusted climate scenario is available as per illustration below:<br />
o Hydrological regime of lower Mekong river<br />
Simulated discharge of major sub-basin of the tributaries in Lao PDR and<br />
Thailand under different climate scenarios.<br />
Publications<br />
o Proceeding: The APN CAPaBLE CB-01 Synthesis Workshop, Vientiane, Lao<br />
PDR – 29-30 July 2004. The Study of Future Climate Change impact on Water<br />
Resource and Rain-fed Agriculture Production – Case study in Lao PDR and<br />
Thailand<br />
o Assessment on Impact, Vulnerability and Adaptation to Climate Change: Finding<br />
and lesson learned from pilot study in the Lower Mekong River basin<br />
<strong>Technical</strong> research papers:<br />
o Impact of Climate Change on Rainfed Lowland Rice Production in Savannakhet<br />
Province, Lao PDR<br />
o Climate scenario verification and impact on rain-fed rice production in Thailand<br />
o Impact of climate change on rice production in Kula Ronghai Field, Thailand<br />
o Impact of climate change on maize, sugarcane and cassava production in<br />
northeastern region of Thailand<br />
o Assessment on impact and adaptation to climate change: The study on<br />
vulnerability and adaptation options of rain-fed farmer in Kula Ronghai Field,<br />
<strong>Final</strong> technical report – AIACC AS07 101
Thailand<br />
o The study on vulnerability and adaptation of rain-fed farmer to impact of climate<br />
change: Case study at Vientiane Plain, Lao PDR<br />
Website: Under construction<br />
10 Policy Implications and Future Directions<br />
This pilot study project has raised awareness among policy maker and public<br />
sectors in the region regarding the climate change issues; however, in developing the<br />
climate change policy, the policy maker still requires more explicit answer regarding<br />
climate change impact, vulnerability and adaptation on various key systems, which need<br />
more study to confirm. In addition, the study on climate change impact under this<br />
regional study is base on long timescale, which is too long for the policy planning scope<br />
of any country in the region. Future study may need to focus on the issue of climate<br />
change impact in shorter timescale or address more on the climate variability that may<br />
change its pattern from climate change influence. Furthermore, more involvement from<br />
the policy maker and policy implementing agency should also be planned for the future<br />
activity. Pilot implementation, which may help building resilience to climate impact that<br />
has immediate as well as long-term benefit, such as seasonal climate forecast, may be<br />
further explored and pilot test be implemented.<br />
The climate change has impact on both bio-physical systems as well as socioeconomic<br />
aspects, and in many cases, need to be considered in regional scale as it may<br />
impact large geographic coverage and may have consequences that are trans-boundary.<br />
Furthermore, the efforts to cope with climate change impact in one location may cause<br />
side effect the other locations or systems or sectors, which could also be trans-boundary<br />
issue. This call for regional collaboration to jointly look into the issues together in order<br />
to establish and share common understanding on the impact and adaptation in bigger<br />
picture at regional scale, of which would ultimately lead to the adaptation strategy that<br />
could be implemented collectively under holistic approach to achieve better efficiency<br />
and effectiveness in coping with the climate stress and also help avoid conflict that may<br />
arise from discreet planning and implementation.<br />
<strong>Final</strong> technical report – AIACC AS07 102
References<br />
Adger, W. Neil, Kelly, P. Mike, Nguyen Huu Ninh, 2001. Living with Environmental Change:<br />
Social vulnerability, adaptation and resilience in Vietnam, Routledge, London<br />
Boulidam, Somkhit, 2005, Vulnerability and Adaptation of Rain-fed Rice Farmers to Impact of<br />
Climate Variability in Lahakhok, Sebangnuane Tai, Dong Khamphou and Khudhi<br />
Villages of Songkhone District, Savannakhet, Lao PDR, Mahidol University, Thailand<br />
Department of Livestock Development, Ministry of Agriculture and Cooperative, Thailand<br />
[Online] Available at: http://www.dld.go.th/pvlo_ccs/p21.htm<br />
Grenier, L., 1998. Working with Indigenous Knowledge: A Guide for Researchers. International<br />
Development Research Centre, Canada.<br />
Hoogenboom, G., P.W. Wilkens, and G.Y. Tsuji (eds.). 1999. DSSAT version 3 v4. University<br />
of Hawaii, Honolulu, Hawaii.<br />
IPCC, 2001 a. Climate Change 2001: The Scientific Basis. Contribution of Working Group I to<br />
the Third Assessment <strong>Report</strong> of the Intergovernmental Panel on Climate Change<br />
(IPCC). Cambridge University Press, Cambridge, UK.<br />
IPCC, 2001 b. Climate Change 2001: Impacts, Adaptation and Vulnerability. Contribution of<br />
Working Group II to the Third Assessment <strong>Report</strong> of the Intergovernmental Panel on<br />
Climate Change (IPCC). Cambridge University Press, Cambridge, UK.<br />
IPCC. 2001c: Climate Change 2001: Synthesis <strong>Report</strong>. A Contribution of Working Groups I, II,<br />
and III to the Third Assessment <strong>Report</strong> of the Intergovernmental Panel on Climate<br />
Change, Watson, R.T. and the Core Writing Team (eds.). Cambridge University Press,<br />
Cambridge, United Kingdom, and New York, NY, USA, 398 pp.<br />
Kates, Robert W., 2001. Cautionary Tales: Adaptation and the Global Poor. Societal Adaptation<br />
to Climate Variability and Change, Khuwer Academic Publishers, Dordrecht, The<br />
Netherlands.<br />
Kerdsuk, Vichien, Kerdsuk, Varaporn, Sukchan, Somsak, 2005, Impacts Assessment and<br />
Adaptation to Climate Change: The Study of Vulnerability and Adaptation Options of<br />
Rain-fed Farmer in Tung Kula Ronghai, Khon Kaen University, Thailand.<br />
<strong>Final</strong> technical report – AIACC AS07 103
Liang, X., Lettenmaier, D. P., Wood, E. F. and Burges, S. J. 1994. A simple hydrologically<br />
based model of land surface water and energy fluxes for general circulation model. J.<br />
Geophys. Res. 99: 14415-14428.<br />
Lohman, D., Raschke, E., Nijssen, B. and Lettenmaier, D. P. 1998. Regional scale hydrology: I.<br />
Formation of the VIC-2L model coupled to a routing model. Hydrol. Sci. J. 43: 131-<br />
141<br />
McGregor, J.L., and M.R. Dix, 2001: The CSIRO conformal-cubic atmospheric GCM. In<br />
IUTAM Symposium on Advances in Mathematical Modelling of Atmosphere and<br />
Ocean Dynamics, P.F. Hodnett ( Ed.), Kluwer, Dordrecht, 197-202.<br />
McGregor, J. L., Katzfey, J. J. and Nguyen, K. C. 1998: Fine resolution simulations of climate<br />
change for Southeast Asia. <strong>Final</strong> report for a research project commissioned by<br />
Southeast Asian Regional Committee for START (SARCS). Aspendale, Vic. CSIRO<br />
Atmospheric Research, 35 p.<br />
Richey, J. E., Logsdon, M., Rodda, S., Nijssen, B., Lettenmaier, D. and Snidvongs, A. 2000.<br />
Sea-Basins: Towards A Coupled Hydrological and Material Transport Model of<br />
Southeast Asia and the Mekong River System. In R.W. Al-Soufi (ed.), Proceeeding of<br />
the Workshop on Hydrologic and Environmental Modelling in the Mekong Basin.<br />
Phnom Penh: <strong>Technical</strong> Support Division, Mekong River Commission MKG/R.00017,<br />
pp. 40-62.<br />
Shukla, P.R., Ravindranath, N.H., Garg, Amit, Battacharya, Sumana, 2003. Climate Change and<br />
India: Vulnerability Assessment and Adaptation, University Press, India.<br />
SRES, 2000. IPCC Special <strong>Report</strong> on Emission Scenarios. Intergovernmental Panel on Climate<br />
Change, Cambridge University Press, Cambridge.<br />
Wang, Yuqing, Leung, L. Ruby, McGregor, John L., Lee, Dong Kyou, Wang, Wei-Chyung,<br />
Ding, Yihui, Kimura, Fujio, 2004. Regional Climate Modeling: Progress, Challenges,<br />
Prospects. Journal of Meteorological of Japan.<br />
<strong>Final</strong> technical report – AIACC AS07 104
List of Figures and Tables<br />
Figures:<br />
Figure 1: Focus area of climate change scenario analysis<br />
Figure 2: Average temperature in the lower Mekong River basin (baseline simulation) and<br />
comparison analysis to show future change<br />
Figure 3: Number of annual “hot day” in the lower Mekong River basin (baseline simulation)<br />
and comparison analysis to show future change<br />
Figure 4: Number of annual “cool day” in the lower Mekong River basin (baseline simulation)<br />
and comparison analysis to show future change<br />
Figure 5: Average rainfall in the lower Mekong River basin (baseline simulation) and<br />
comparison analysis to show future change<br />
Figure 6: Change in discharge of Mekong River tributaries in Lao PDR and Thailand under<br />
different climate scenarios<br />
Figure 7: Selected study sites on impact of climate change on rice productivity in Southeast Asia<br />
Figure 8: Stretched-grid with controlled boundary in the study area<br />
Figure 9: Geographical coverage of the CCAM simulation – Southeast Asia and southern region<br />
of People Republic of China<br />
Figure 10: Geographic coverage of the analysis on climate change – Mekong River basin in Lao<br />
PDR, Thailand and Viet Nam<br />
Figure 11: Location of meteorological stations that provide observed data for rainfall calibration<br />
process<br />
Figure 12: Baseline average temperature in the study area under climate condition at CO2<br />
concentration of 360 ppm<br />
Figure 13: Future temperature in the study area – Average temperature under climate condition at<br />
CO2 concentration of 540ppm and 720ppm<br />
Figure 14: Baseline average temperature lower Mekong River basin and future change<br />
Figure 15: Locations of major cities selected to illustrate the impact of climate change on<br />
temperature in different seasons<br />
Figure 16: Change in number of annual “hot day” in the study area<br />
Figure 17: Change in number of annual “cool day” in the study area<br />
<strong>Final</strong> technical report – AIACC AS07 105
Figure 18: Average annual rainfall in the lower Mekong River region – Baseline condition and<br />
future change.<br />
Figure 19: Selected Mekong River tributary watersheds for the study of climate change impact<br />
on hydrological regime<br />
Figure 20: Selected locations in Mekong River tributaries for calculating baseline hydrological<br />
condition and model calibrating process<br />
Figure 21: Routing locations for analysis of climate change impact on hydrological regime of the<br />
Mekong River’s tributaries<br />
Figure 22: Change in discharge of Mekong River tributaries in Lao PDR and Thailand under dry<br />
year scenario of climate condition at CO2 concentration of 540ppm and 720ppm<br />
Figure 23: Change in discharge of Mekong River tributaries in Lao PDR and Thailand under wet<br />
year scenario of climate condition at CO2 concentration of 540ppm and 720ppm<br />
Figure 24: Selected study sites on impact of climate change on rain-fed rice productivity<br />
Figure 25: Impact of extreme climate event on rice cultivation<br />
Figure 26: Framework on the assessment of risk and vulnerability of rain-fed farmer to impact of<br />
climate change<br />
Figure 27: Selected sites on risk and vulnerability of rain-fed farmer to impact of climate change<br />
Figure 28: Study site on risk and vulnerability assessment in Thailand and details map of the 5<br />
zones of study<br />
Figure 29: Study site on risk and vulnerability assessment in Lao PDR and details map that<br />
shows Songkhone district, Savannakhet province<br />
Figure 30: Conceptual framework on the analysis of risk and vulnerability of rain-fed farmers to<br />
climate change impact<br />
Figure 31: Structure of risk groups to climate impact in each study site – Baseline condition<br />
Figure 32: Profile of risk from climate impact each risk group at each study site<br />
Figure 33: Structure of risk groups in each study site to impact of climate change – Climate<br />
condition at CO 2 = 540 ppm<br />
Figure 34: Vulnerable group from impact of climate change at each study site – Climate<br />
condition at CO 2 = 540 ppm<br />
Figure 35: Structure of risk groups in each study site to impact of climate change – Climate<br />
condition at CO 2 = 720 ppm<br />
<strong>Final</strong> technical report – AIACC AS07 106
Figure 36: Vulnerable group from impact of climate change at each study site – Climate<br />
condition at CO 2 = 720 ppm<br />
Figure 37: Study sites on the assessment of adaptation to impact of climate change in lower<br />
Mekong River basin<br />
Figure 38: Household interview and group discussion on climate impact and adaptation strategy<br />
– farmer community in the study sites<br />
Tables:<br />
Table 1: Simulated yield of rice productivity at the 3 study sites under different climate scenarios<br />
Table 2: Average minimum temperature in major cities at different seasons under climate<br />
condition at CO2 concentration of 360ppm, 540ppm and 720ppm.<br />
Table 3: Average maximum temperature in major cities at different seasons under climate<br />
condition at CO2 concentration of 360ppm, 540ppm and 720ppm.<br />
Table 4: Number of annual hot day at selected cities in the region under climate condition at<br />
different levels of atmospheric CO2 concentration<br />
Table 5: Number of annual cool day in the selected cities in the region under climate condition at<br />
different levels of atmospheric CO2 concentration<br />
Table 6: Annual precipitation in Mekong River basin in Lao PDR, Thailand and Vietnam – Wet<br />
year scenario<br />
Table 7: Annual precipitation in Mekong River basin in Lao PDR, Thailand and Vietnam – Dry<br />
year scenario<br />
Table 8: Impact of climate change on discharge of Mekong River’s tributaries in Lao PDR and<br />
Thailand<br />
Table 9: Simulated yield of rice productivity at the 3 study sites under different climate scenarios<br />
Table 10: Study site on risk and vulnerability assessment in Thailand - details background of the<br />
5 zones of study<br />
Table 11: Indicators used for evaluating farmer’s risk to climate impact<br />
Table 12: Scenario on change in rice productivity – proxy used for evaluating farmer’s risk and<br />
vulnerability to impact of climate change<br />
Table 13: Farm Level Measures for Managing Climate Risks<br />
Table 14: Community Level Measures for Managing Climate Risks<br />
<strong>Final</strong> technical report – AIACC AS07 107
Table 15: National Level Measures for Managing Climate Risks<br />
<strong>Final</strong> technical report – AIACC AS07 108
Appendix 1:<br />
Rainy Season Pattern at Selected Cities in lower Mekong River Basin under<br />
Influence of Climate Change<br />
<strong>Final</strong> technical report – AIACC AS07 109
80<br />
Vientiane<br />
Rainfall (milimeter)<br />
60<br />
40<br />
20<br />
C360<br />
0<br />
1 31 61 91 121 151 181 211 241 271 301 331 361<br />
Day<br />
80<br />
Vientiane<br />
Rainfall (milimeter)<br />
60<br />
40<br />
20<br />
C540<br />
0<br />
1 31 61 91 121 151 181 211 241 271 301 331 361<br />
Day<br />
80<br />
Vientiane<br />
Rainfall (milimeter)<br />
60<br />
40<br />
20<br />
C720<br />
0<br />
1 31 61 91 121 151 181 211 241 271 301 331 361<br />
Day<br />
Rainy season at Vientiane, Lao PDR<br />
CO 2 Scenario On-set date End date Rainy season day Annual rainfall (mm)<br />
360ppm 146 275 130 1229<br />
540ppm 136 278 143 1511<br />
720ppm 136 267 132 1502<br />
<strong>Final</strong> technical report – AIACC AS07 110
80<br />
Pakse<br />
Rainfall (milimeter)<br />
60<br />
40<br />
20<br />
C360<br />
0<br />
1 31 61 91 121 151 181 211 241 271 301 331 361<br />
Day<br />
80<br />
Pakse<br />
Rainfall (milimeter)<br />
60<br />
40<br />
20<br />
C540<br />
0<br />
1 31 61 91 121 151 181 211 241 271 301 331 361<br />
Day<br />
80<br />
Pakse<br />
Rainfall (milimeter)<br />
60<br />
40<br />
20<br />
C720<br />
0<br />
1 31 61 91 121 151 181 211 241 271 301 331 361<br />
Day<br />
Rainy season at Pakse, Lao PDR<br />
CO 2 Scenario On-set date End date Rainy season day Annual rainfall (mm)<br />
360ppm 137 267 130 2213<br />
540ppm 145 271 128 2370<br />
720ppm 152 277 126 2551<br />
<strong>Final</strong> technical report – AIACC AS07 111
80<br />
Cantho<br />
Rainfall (milimeter)<br />
60<br />
40<br />
20<br />
C360<br />
0<br />
1 31 61 91 121 151 181 211 241 271 301 331 361<br />
Day<br />
80<br />
Cantho<br />
Rainfall (milimeter)<br />
60<br />
40<br />
20<br />
C540<br />
0<br />
1 31 61 91 121 151 181 211 241 271 301 331 361<br />
Day<br />
80<br />
Cantho<br />
C720<br />
60<br />
Rainfall (milimeter)<br />
40<br />
20<br />
0<br />
1 31 61 91 121 151 181 211 241 271 301 331 361<br />
Day<br />
Rainy season at Cantho, Viet Nam<br />
CO 2 Scenario On-set date End date Rainy season day Annual rainfall (mm)<br />
360ppm 140 336 197 959<br />
540ppm 133 287 155 1027<br />
720ppm 137 312 176 1105<br />
<strong>Final</strong> technical report – AIACC AS07 112
Appendix 2:<br />
Result of Hydrological Regime Baseline Calculation and Model Calibration<br />
Baseline hydrological regime simulation in the lower Mekong River basin and<br />
calibration result was calculated at the various locations:<br />
<strong>Final</strong> technical report – AIACC AS07 113
Sub-Basin:<br />
Station:<br />
Nam Ou - Lao PDR<br />
Muong Ngoy<br />
Coordinate: N20.702 E102.335<br />
Observed year: 1989<br />
CCAM set:<br />
P00<br />
10000<br />
Discharge(million m 3 /year)<br />
8000<br />
6000<br />
4000<br />
2000<br />
0<br />
Observed<br />
Simulate<br />
1 4 7 10 13 16 19 22 25 28 31 34 37 40 43 46 49 52<br />
week<br />
Parameter<br />
Fraction of base flow 0.5<br />
Fraction of Runoff 1<br />
Diffusion 1<br />
Velocity 0.007<br />
RMSE 260.251<br />
<strong>Final</strong> technical report – AIACC AS07 114
Sub-Basin: Nam Khan - Lao PDR<br />
Station: Ban Mixay<br />
Coordinate: N19.787 E102.177<br />
Observed year: 1989<br />
CCAM set: P00<br />
1500<br />
Discharge (million m 3 /year)<br />
1000<br />
500<br />
0<br />
Observed<br />
Simulate<br />
1 4 7 10 13 16 19 22 25 28 31 34 37 40 43 46 49 52<br />
week<br />
Parameter<br />
Fraction of base flow 0.17<br />
Fraction of Runoff 0.1<br />
Diffusion 1<br />
Velocity 0.001<br />
RMSE 26.797<br />
<strong>Final</strong> technical report – AIACC AS07 115
Sub-Basin:<br />
Station:<br />
Nam Ngum - Lao PDR<br />
Ban Hin Heup<br />
Coordinate: N18.663 E102.355<br />
Observed year: 1989<br />
CCAM set:<br />
P00<br />
Discharge (million m 3 / year)<br />
4000<br />
3000<br />
2000<br />
1000<br />
0<br />
Observed<br />
Simulate<br />
1 4 7 10 13 16 19 22 25 28 31 34 37 40 43 46 49 52<br />
week<br />
Parameter<br />
Fraction of base flow 0.5<br />
Fraction of Runoff 1<br />
Diffusion 1<br />
Velocity 0.03<br />
RMSE 117.358<br />
<strong>Final</strong> technical report – AIACC AS07 116
Sub-Basin:<br />
Station:<br />
Nam Ngum - Lao PDR<br />
Ban Pak Kanhoung<br />
Coordinate: N18.417 E102.575<br />
Observed year: 1989<br />
CCAM set:<br />
P00<br />
16000<br />
Discharge (million m 3 /year)<br />
12000<br />
8000<br />
4000<br />
Observed<br />
Simulate<br />
0<br />
1 4 7 10 13 16 19 22 25 28 31 34 37 40 43 46 49 52<br />
week<br />
Parameter<br />
Fraction of base flow 0.6<br />
Fraction of Runoff 1<br />
Diffusion 1<br />
Velocity 0.05<br />
RMSE 476.844<br />
<strong>Final</strong> technical report – AIACC AS07 117
Sub-Basin: Nam Nhiep - Lao PDR<br />
Station: Muong May<br />
Coordinate: N18.505 E103.662<br />
Observed year: 1989<br />
CCAM set: P00<br />
6000<br />
Discharge (million m 3 /year)<br />
4000<br />
2000<br />
0<br />
Observed<br />
Simulate<br />
1 4 7 10 13 16 19 22 25 28 31 34 37 40 43 46 49 52<br />
week<br />
Parameter<br />
Fraction of base flow 0.5<br />
Fraction of Runoff 1<br />
Diffusion 20<br />
Velocity 1<br />
RMSE 135.736<br />
<strong>Final</strong> technical report – AIACC AS07 118
Sub-Basin: Nam Theun - Lao PDR<br />
Station: Bang Signo<br />
Coordinate: N17.850 E105.067<br />
Observed year: 1989<br />
CCAM set: P00<br />
8000<br />
Discharge (million m 3 /year)<br />
6000<br />
4000<br />
2000<br />
0<br />
Observed<br />
Simulate<br />
1 4 7 10 13 16 19 22 25 28 31 34 37 40 43 46 49 52<br />
week<br />
Parameter<br />
Fraction of base flow 2.45<br />
Fraction of Runoff 1<br />
Diffusion 1<br />
Velocity 0.01<br />
RMSE 266.937<br />
<strong>Final</strong> technical report – AIACC AS07 119
Sub-Basin: Nam Songkhram - Thailand<br />
Station: Ban Tha Kok Daeng<br />
Coordinate: N17.867 E103.783<br />
Observed year: 1989<br />
CCAM set: P00<br />
5000<br />
Discharge (million m 3 /year)<br />
4000<br />
3000<br />
2000<br />
1000<br />
0<br />
Observed<br />
Simulate<br />
1 4 7 10 13 16 19 22 25 28 31 34 37 40 43 46 49 52<br />
week<br />
Parameter<br />
Fraction of base flow 1.6<br />
Fraction of Runoff 1<br />
Diffusion 0.5<br />
Velocity 0.003<br />
RMSE 233.616<br />
<strong>Final</strong> technical report – AIACC AS07 120
Sub-Basin: Se Bang Fai - Lao PDR<br />
Station: Se Bang Fai Bridge-13<br />
Coordinate: N17.072 E104.985<br />
Observed year: 1989<br />
CCAM set: P00<br />
8000<br />
Discharge (million m 3 /year)<br />
6000<br />
4000<br />
2000<br />
0<br />
Observed<br />
Simulate<br />
1 4 7 10 13 16 19 22 25 28 31 34 37 40 43 46 49 52<br />
week<br />
Parameter<br />
Fraction of base flow 0.73<br />
Fraction of Runoff 1<br />
Diffusion 0.5<br />
Velocity 0.005<br />
RMSE 325.353<br />
<strong>Final</strong> technical report – AIACC AS07 121
Sub-Basin: Se Bang Hieng - Lao PDR<br />
Station: Ban Keng Done<br />
Coordinate: N16.185 E105.815<br />
Observed year: 1989<br />
CCAM set: P00<br />
12000<br />
Discharge (milion m 3 /year)<br />
10000<br />
8000<br />
6000<br />
4000<br />
2000<br />
0<br />
Observed<br />
Simulate<br />
1 4 7 10 13 16 19 22 25 28 31 34 37 40 43 46 49 52<br />
week<br />
Parameter<br />
Fraction of base flow 0.6<br />
Fraction of Runoff 1<br />
Diffusion 1<br />
Velocity 0.01<br />
RMSE 529.739<br />
<strong>Final</strong> technical report – AIACC AS07 122
Sub-Basin: Nam Chi - Thailand<br />
Station: Ban Chot<br />
Coordinate:<br />
Observed year: 1989<br />
CCAM set: P00<br />
6000<br />
Discharge (million m 3 /year)<br />
4000<br />
2000<br />
0<br />
Observed<br />
Simulate<br />
1 4 7 10 13 16 19 22 25 28 31 34 37 40 43 46 49 52<br />
week<br />
Parameter<br />
Fraction of base flow 0.5<br />
Fraction of Runoff 1<br />
Diffusion 1<br />
Velocity 0.015<br />
RMSE 244.755<br />
<strong>Final</strong> technical report – AIACC AS07 123
Sub-Basin: Nam Mun - Thailand<br />
Station: Kaeng Saphu Tai<br />
Coordinate: N15.240 E105.250<br />
Observed year: 1989<br />
CCAM set: P00<br />
20000<br />
Discharge (million m 3 /year)<br />
15000<br />
10000<br />
5000<br />
Observed<br />
Simulate<br />
0<br />
1 4 7 10 13 16 19 22 25 28 31 34 37 40 43 46 49 52<br />
week<br />
Parameter<br />
Fraction of base flow 0.45<br />
Fraction of Runoff 1<br />
Diffusion 1<br />
Velocity 0.05<br />
RMSE 741.520<br />
<strong>Final</strong> technical report – AIACC AS07 124
Sub-Basin: Se Done - Lao PDR<br />
Station: Souvanakhili<br />
Coordinate: N15.383 E105.817<br />
Observed year: 1989<br />
CCAM set: P00<br />
3000<br />
Discharge (million m 3 /year)<br />
2000<br />
1000<br />
0<br />
Observed<br />
Simulate<br />
1 4 7 10 13 16 19 22 25 28 31 34 37 40 43 46 49 52<br />
week<br />
Parameter<br />
Fraction of base flow 0.14<br />
Fraction of Runoff 1<br />
Diffusion 20<br />
Velocity 1<br />
RMSE 141.828<br />
<strong>Final</strong> technical report – AIACC AS07 125
Sub-Basin: Se Kong - Lao PDR<br />
Station: Attapeu<br />
Coordinate: N14.800 E106.833<br />
Observed year: 1989<br />
CCAM set: P00<br />
15000<br />
Discharge (million m3/year)<br />
10000<br />
5000<br />
Observed<br />
Simulate<br />
0<br />
1 4 7 10 13 16 19 22 25 28 31 34 37 40 43 46 49 52<br />
Week<br />
Parameter<br />
Fraction of base flow 0.8<br />
Fraction of Runoff 1<br />
Diffusion 1<br />
Velocity 0.05<br />
RMSE 303.894<br />
<strong>Final</strong> technical report – AIACC AS07 126
Appendix 3:<br />
Simulation Result of Hydrological Regime of major Sub-basins of Mekong<br />
River in Lao PDR and Thailand under Different Climate Scenarios<br />
The discharge calculation for each individual sub-basin was simulated at the mouth of<br />
each major tributary in Lao PDR and Thailand:<br />
<strong>Final</strong> technical report – AIACC AS07 127
Sub-Basin: Nam Ou - Lao PDR<br />
Station: Tributary mouth<br />
Coordinate: N20.05 E102.24<br />
15000<br />
Wet Year<br />
Discharge (million m3/year)<br />
10000<br />
5000<br />
C360<br />
C540<br />
C720<br />
0<br />
1 4 7 10 13 16 19 22 25 28 31 34 37 40 43 46 49 52<br />
Week<br />
Period<br />
Base line year<br />
Compare C-360 & C-540<br />
Compare C-360 & C-720<br />
Discharge Level<br />
11,458 million cubic meters / year<br />
+ 7.23 %<br />
+ 16.78 %<br />
15000<br />
Dry Year<br />
Discharge (million m3/year)<br />
10000<br />
5000<br />
C360<br />
C540<br />
C720<br />
0<br />
1 4 7 10 13 16 19 22 25 28 31 34 37 40 43 46 49 52<br />
Week<br />
Period<br />
Base line year<br />
Compare C-360 & C-540<br />
Compare C-360 & C-720<br />
Discharge Level<br />
9,035 million cubic meters / year<br />
- 15.56 %<br />
+ 24.38 %<br />
<strong>Final</strong> technical report – AIACC AS07 128
Sub-Basin: Nam Khan - Lao PDR<br />
Station: Tributary mount<br />
Coordinate: N19.87 E102.18<br />
1500<br />
Wet Year<br />
Discharge (million m3/year)<br />
1000<br />
500<br />
C360<br />
C540<br />
C720<br />
0<br />
1 4 7 10 13 16 19 22 25 28 31 34 37 40 43 46 49 52<br />
Week<br />
Period<br />
Base line year<br />
Compare C-360 & C-540<br />
Compare C-360 & C-720<br />
Discharge Level<br />
1,293 million cubic meters / year<br />
+ 6.65 %<br />
+ 6.93 %<br />
1500<br />
Dry Year<br />
Discharge (million m3/year)<br />
1000<br />
500<br />
C360<br />
C540<br />
C720<br />
0<br />
1 4 7 10 13 16 19 22 25 28 31 34 37 40 43 46 49 52<br />
Week<br />
Period<br />
Base line year<br />
Compare C-360 & C-540<br />
Compare C-360 & C-720<br />
Discharge Level<br />
946 million cubic meters / year<br />
-11.17 %<br />
+ 44.80 %<br />
<strong>Final</strong> technical report – AIACC AS07 129
Sub-Basin: Upper Nam Ngum - Lao PDR<br />
Station: Before Dam Entry<br />
Coordinate: N18.75 E102.77<br />
5000<br />
Wet Year<br />
Discharge (million m 3 /year)<br />
4000<br />
3000<br />
2000<br />
1000<br />
C360<br />
C540<br />
C720<br />
0<br />
1 4 7 10 13 16 19 22 25 28 31 34 37 40 43 46 49 52<br />
Week<br />
Period<br />
Base line year<br />
Compare C-360 & C-540<br />
Compare C-360 & C-720<br />
Discharge Level<br />
3,820 million cubic meters / year<br />
+ 14.77 %<br />
+ 8.44 %<br />
5000<br />
Dry Year<br />
Discharge (million m 3 /year)<br />
4000<br />
3000<br />
2000<br />
1000<br />
0<br />
C360<br />
C540<br />
C720<br />
1 3 5 7 9 11 13 15 17 19 21 23 25 27 29 31 33 35 37 39 41 43 45 47 49 51<br />
Week<br />
Period<br />
Base line year<br />
Compare C-360 & C-540<br />
Compare C-360 & C-720<br />
Discharge Level<br />
2,891 million cubic meters / year<br />
- 12.30 %<br />
+ 51.49 %<br />
<strong>Final</strong> technical report – AIACC AS07 130
Sub-Basin: Nam Ngum - Lao PDR<br />
Station: Tributary mouth<br />
Coordinate: N18.16 E103.07<br />
20000<br />
Wet Year<br />
Discharge (million m 3 /year)<br />
15000<br />
10000<br />
5000<br />
C360<br />
C540<br />
C720<br />
0<br />
1 4 7 10 13 16 19 22 25 28 31 34 37 40 43 46 49 52<br />
Week<br />
Period<br />
Base line year<br />
Compare C-360 & C-540<br />
Compare C-360 & C-720<br />
Discharge Level<br />
14,837 million cubic meters / year<br />
+ 6.83 %<br />
+ 11.79 %<br />
20000<br />
Dry Year<br />
Discharge (million m 3 /year)<br />
15000<br />
10000<br />
5000<br />
C360<br />
C540<br />
C720<br />
0<br />
1 4 7 10 13 16 19 22 25 28 31 34 37 40 43 46 49 52<br />
Week<br />
Period<br />
Base line year<br />
Compare C-360 & C-540<br />
Compare C-360 & C-720<br />
Discharge Level<br />
11,837 million cubic meters / year<br />
+ 4.70 %<br />
+ 46.63 %<br />
<strong>Final</strong> technical report – AIACC AS07 131
Sub-Basin: Nam Nhiep - Lao PDR<br />
Station: Tributary mouth<br />
Coordinate: N18.41 E103.59<br />
6000<br />
Wet Year<br />
Discharge (million m 3 /year)<br />
5000<br />
4000<br />
3000<br />
2000<br />
1000<br />
C360<br />
C540<br />
C720<br />
0<br />
1 4 7 10 13 16 19 22 25 28 31 34 37 40 43 46 49 52<br />
Week<br />
Period<br />
Base line year<br />
Compare C-360 & C-540<br />
Compare C-360 & C-720<br />
Discharge Level<br />
4,796 million cubic meters / year<br />
+ 4.70 %<br />
+ 46.63 %<br />
6000<br />
Dry Year<br />
Discharge (million m 3 /year)<br />
5000<br />
4000<br />
3000<br />
2000<br />
1000<br />
C360<br />
C540<br />
C720<br />
0<br />
1 4 7 10 13 16 19 22 25 28 31 34 37 40 43 46 49 52<br />
Week<br />
Period<br />
Base line year<br />
Compare C-360 & C-540<br />
Compare C-360 & C-720<br />
Discharge Level<br />
3,902 million cubic meters / year<br />
- 4.06 %<br />
+ 33.28 %<br />
<strong>Final</strong> technical report – AIACC AS07 132
Sub-Basin: Nam Theun - Lao PDR<br />
Station: Tributary mouth<br />
Coordinate: N18.33 E104.01<br />
50000<br />
Wet Year<br />
Discharge (million m 3 /year)<br />
40000<br />
30000<br />
20000<br />
10000<br />
C360<br />
C540<br />
C720<br />
0<br />
1 4 7 10 13 16 19 22 25 28 31 34 37 40 43 46 49 52<br />
Week<br />
Period<br />
Base line year<br />
Compare C-360 & C-540<br />
Compare C-360 & C-720<br />
Discharge Level<br />
39,427 million cubic meters / year<br />
- 5.68 %<br />
+ 18.75 %<br />
50000<br />
Dry Year<br />
Discharge (million m 3 /year)<br />
40000<br />
30000<br />
20000<br />
10000<br />
C360<br />
C540<br />
C720<br />
0<br />
1 4 7 10 13 16 19 22 25 28 31 34 37 40 43 46 49 52<br />
Week<br />
Period<br />
Base line year<br />
Compare C-360 & C-540<br />
Compare C-360 & C-720<br />
Discharge Level<br />
31,483 million cubic meters / year<br />
+ 11.03 %<br />
+ 30.47 %<br />
<strong>Final</strong> technical report – AIACC AS07 133
Sub-Basin: Se Bang Fai - Lao PDR<br />
Station: Tributary mouth<br />
Coordinate: N16.98 E104.83<br />
10000<br />
Wet Year<br />
Discharge (million m 3 /year)<br />
8000<br />
6000<br />
4000<br />
2000<br />
C360<br />
C540<br />
C720<br />
0<br />
1 4 7 10 13 16 19 22 25 28 31 34 37 40 43 46 49 52<br />
Week<br />
Period<br />
Base line year<br />
Compare C-360 & C-540<br />
Compare C-360 & C-720<br />
Discharge Level<br />
8,330 million cubic meters / year<br />
- 4.54 %<br />
+ 14.92 %<br />
10000<br />
Dry Year<br />
Discharge (million m 3 /year)<br />
8000<br />
6000<br />
4000<br />
2000<br />
C360<br />
C540<br />
C720<br />
0<br />
1 4 7 10 13 16 19 22 25 28 31 34 37 40 43 46 49 52<br />
Week<br />
Period<br />
Base line year<br />
Compare C-360 & C-540<br />
Compare C-360 & C-720<br />
Discharge Level<br />
6,412 million cubic meters / year<br />
+ 1.40 %<br />
+ 32.69 %<br />
<strong>Final</strong> technical report – AIACC AS07 134
Sub-Basin: Se Bang Hieng - Lao PDR<br />
Station: Tributary mouth<br />
Coordinate: N16.19 E105.32<br />
15000<br />
Wet Year<br />
Discharge (million m 3 /year)<br />
10000<br />
5000<br />
C360<br />
C540<br />
C720<br />
0<br />
1 4 7 10 13 16 19 22 25 28 31 34 37 40 43 46 49 52<br />
Week<br />
Period<br />
Base line year<br />
Compare C-360 & C-540<br />
Compare C-360 & C-720<br />
Discharge Level<br />
10,057 million cubic meters / year<br />
+ 0.04 %<br />
+ 27.95 %<br />
15000<br />
Dry Year<br />
Discharge (million m 3 /year)<br />
10000<br />
5000<br />
C360<br />
C540<br />
C720<br />
0<br />
1 4 7 10 13 16 19 22 25 28 31 34 37 40 43 46 49 52<br />
Week<br />
Period<br />
Base line year<br />
Compare C-360 & C-540<br />
Compare C-360 & C-720<br />
Discharge Level<br />
6,784 million cubic meters / year<br />
+ 10.60 %<br />
+ 51.21 %<br />
<strong>Final</strong> technical report – AIACC AS07 135
Sub-Basin: Se Done - Lao PDR<br />
Station: Tributary mouth<br />
Coordinate: N15.26 E105.84<br />
6000<br />
Wet Year<br />
Discharge (million m 3 /year)<br />
5000<br />
4000<br />
3000<br />
2000<br />
1000<br />
C360<br />
C540<br />
C720<br />
0<br />
1 4 7 10 13 16 19 22 25 28 31 34 37 40 43 46 49 52<br />
Week<br />
Period<br />
Base line year<br />
Compare C-360 & C-540<br />
Compare C-360 & C-720<br />
Discharge Level<br />
2,574 million cubic meters / year<br />
+ 13.30 %<br />
+ 100.05 %<br />
6000<br />
Dry Year<br />
Discharge (million m 3 /year)<br />
5000<br />
4000<br />
3000<br />
2000<br />
1000<br />
C360<br />
C540<br />
C720<br />
0<br />
1 4 7 10 13 16 19 22 25 28 31 34 37 40 43 46 49 52<br />
Week<br />
Period<br />
Base line year<br />
Compare C-360 & C-540<br />
Compare C-360 & C-720<br />
Discharge Level<br />
1,829 million cubic meters /<br />
year<br />
+ 2.91 %<br />
+ 53.43 %<br />
<strong>Final</strong> technical report – AIACC AS07 136
Sub-Basin: Se Kong - Lao PDR<br />
Station: Tributary mouth<br />
Coordinate: N13.67 E106.13<br />
70000<br />
Wet Year<br />
Discharge (million m 3 /year)<br />
60000<br />
50000<br />
40000<br />
30000<br />
20000<br />
10000<br />
0<br />
C360<br />
C540<br />
C720<br />
1 4 7 10 13 16 19 22 25 28 31 34 37 40 43 46 49 52<br />
Week<br />
Period<br />
Base line year<br />
Compare C-360 & C-540<br />
Compare C-360 & C-720<br />
Discharge Level<br />
37,506 million cubic meters / year<br />
+ 20.20 %<br />
+ 63.21 %<br />
Discharge (million m 3 /year)<br />
70000<br />
60000<br />
50000<br />
40000<br />
30000<br />
20000<br />
10000<br />
Dry Year<br />
C360<br />
C540<br />
C720<br />
0<br />
1 4 7 10 13 16 19 22 25 28 31 34 37 40 43 46 49 52<br />
Week<br />
Period<br />
Base line year<br />
Compare C-360 & C-540<br />
Compare C-360 & C-720<br />
Discharge Level<br />
35,138 million cubic meters / year<br />
-13.64 %<br />
+ 5.57 %<br />
<strong>Final</strong> technical report – AIACC AS07 137
Sub-Basin: Se Son - Lao PDR<br />
Station: Tributary mouth<br />
Coordinate: N13.58 E106.30<br />
25000<br />
Wet Year<br />
Discharge (million m 3 /year)<br />
20000<br />
15000<br />
10000<br />
5000<br />
C360<br />
C540<br />
C720<br />
0<br />
1 4 7 10 13 16 19 22 25 28 31 34 37 40 43 46 49 52<br />
Week<br />
Period<br />
Base line year<br />
Compare C-360 & C-540<br />
Compare C-360 & C-720<br />
Discharge Level<br />
14,279 million cubic meters / year<br />
+ 24.74 %<br />
+ 51.75 %<br />
25000<br />
Dry Year<br />
Discharge (million m 3 /year)<br />
20000<br />
15000<br />
10000<br />
5000<br />
C360<br />
C540<br />
C720<br />
0<br />
1 4 7 10 13 16 19 22 25 28 31 34 37 40 43 46 49 52<br />
Week<br />
Period<br />
Base line year<br />
Compare C-360 & C-540<br />
Compare C-360 & C-720<br />
Discharge Level<br />
13,303 million cubic meters / year<br />
- 11.60 %<br />
+ 1.84 %<br />
<strong>Final</strong> technical report – AIACC AS07 138
Sub-Basin: Se Pok - Lao PDR<br />
Station: Tributary mouth<br />
Coordinate: N13.50 E106.30<br />
25000<br />
Wet Year<br />
Discharge (million m 3 /year)<br />
20000<br />
15000<br />
10000<br />
5000<br />
C360<br />
C540<br />
C720<br />
0<br />
1 4 7 10 13 16 19 22 25 28 31 34 37 40 43 46 49 52<br />
Week<br />
Period<br />
Base line year<br />
Compare C-360 & C-540<br />
Compare C-360 & C-720<br />
Discharge Level<br />
13,050 million cubic meters / year<br />
+ 22.39 %<br />
+ 51.26 %<br />
25000<br />
Dry Year<br />
Discharge (million m 3 /year)<br />
20000<br />
15000<br />
10000<br />
5000<br />
C360<br />
C540<br />
C720<br />
0<br />
1 4 7 10 13 16 19 22 25 28 31 34 37 40 43 46 49 52<br />
Week<br />
Period<br />
Base line year<br />
Compare C-360 & C-540<br />
Compare C-360 & C-720<br />
Discharge Level<br />
12,382 million cubic meters / year<br />
- 15.29 %<br />
- 3.53 %<br />
<strong>Final</strong> technical report – AIACC AS07 139
Sub-Basin: Nam Songkhram - Thailand<br />
Station: Tributary mouth<br />
Coordinate: N17.68 E104.35<br />
15000<br />
Wet Year<br />
Discharge (million m 3 /year)<br />
10000<br />
5000<br />
C360<br />
C540<br />
C720<br />
0<br />
1 4 7 10 13 16 19 22 25 28 31 34 37 40 43 46 49 52<br />
Week<br />
Period<br />
Base line year<br />
Compare C-360 & C-540<br />
Compare C-360 & C-720<br />
Discharge Level<br />
12,270 million cubic meters / year<br />
+ 6.34 %<br />
+ 7.41 %<br />
15000<br />
Dry Year<br />
Discharge (million m 3 /year)<br />
10000<br />
5000<br />
C360<br />
C540<br />
C720<br />
0<br />
1 4 7 10 13 16 19 22 25 28 31 34 37 40 43 46 49 52<br />
Week<br />
Period<br />
Base line year<br />
Compare C-360 & C-540<br />
Compare C-360 & C-720<br />
Discharge Level<br />
11,750 million cubic meters / year<br />
+ 7.18 %<br />
+ 24.98 %<br />
<strong>Final</strong> technical report – AIACC AS07 140
Sub-Basin: Nam Chi - Thailand<br />
Station: Tributary mouth<br />
Coordinate: N15.26 E104.66<br />
10000<br />
Wet Year<br />
Discharge (million m 3 /year)<br />
8000<br />
6000<br />
4000<br />
2000<br />
C360<br />
C540<br />
C720<br />
0<br />
1 4 7 10 13 16 19 22 25 28 31 34 37 40 43 46 49 52<br />
Week<br />
Period<br />
Base line year<br />
Compare C-360 & C-540<br />
Compare C-360 & C-720<br />
Discharge Level<br />
6,473 million cubic meters / year<br />
+ 12.73 %<br />
+ 21.27 %<br />
10000<br />
Dry Year<br />
Discharge (million m 3 /year)<br />
8000<br />
6000<br />
4000<br />
2000<br />
C360<br />
C540<br />
C720<br />
0<br />
1 4 7 10 13 16 19 22 25 28 31 34 37 40 43 46 49 52<br />
Week<br />
Period<br />
Base line year<br />
Compare C-360 & C-540<br />
Compare C-360 & C-720<br />
Discharge Level<br />
7,788 million cubic meters / year<br />
- 10.24 %<br />
+ 14.43 %<br />
<strong>Final</strong> technical report – AIACC AS07 141
Sub-Basin: Nam Mun - Thailand<br />
Station: Tributary mouth<br />
Coordinate: N15.26 E105.45<br />
25000<br />
Wet Year<br />
Discharge (million m 3 /year)<br />
20000<br />
15000<br />
10000<br />
5000<br />
C360<br />
C540<br />
C720<br />
0<br />
1 4 7 10 13 16 19 22 25 28 31 34 37 40 43 46 49 52<br />
Week<br />
Period<br />
Base line year<br />
Compare C-360 & C-540<br />
Compare C-360 & C-720<br />
Discharge Level<br />
18,645 million cubic meters / year<br />
+ 10.02 %<br />
+ 34.06 %<br />
25000<br />
Dry Year<br />
Discharge (million m 3 /year)<br />
20000<br />
15000<br />
10000<br />
5000<br />
0<br />
C360<br />
C540<br />
C720<br />
1 3 5 7 9 11 13 15 17 19 21 23 25 27 29 31 33 35 37 39 41 43 45 47 49 51<br />
Week<br />
Period<br />
Base line year<br />
Compare C-360 & C-540<br />
Compare C-360 & C-720<br />
Discharge Level<br />
21,232 million cubic meters / year<br />
- 15.01 %<br />
+ 15.39 %<br />
<strong>Final</strong> technical report – AIACC AS07 142