of the Verde Island Passage, Philippines - weADAPT
of the Verde Island Passage, Philippines - weADAPT
of the Verde Island Passage, Philippines - weADAPT

Create successful ePaper yourself
Turn your PDF publications into a flip-book with our unique Google optimized e-Paper software.
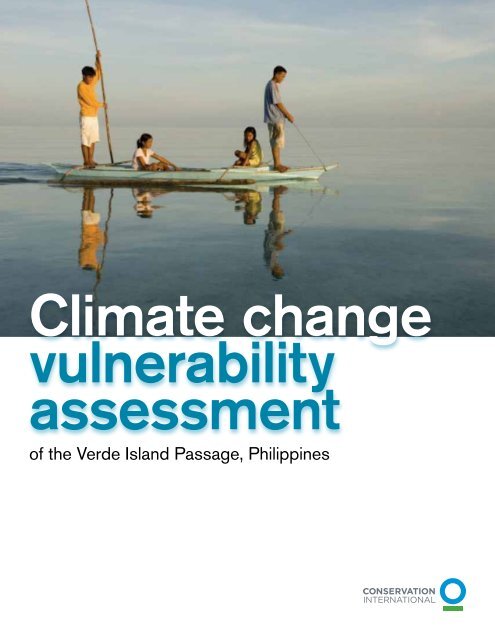
Climate change<br />
vulnerability<br />
assessment<br />
<strong>of</strong> <strong>the</strong> <strong>Verde</strong> <strong>Island</strong> <strong>Passage</strong>, <strong>Philippines</strong>
For more information on <strong>the</strong> <strong>Verde</strong> <strong>Island</strong> <strong>Passage</strong> Vulnerability Assessment Project, contact:<br />
Emily Pidgeon, PhD<br />
Director, Marine Climate Change Program<br />
Conservation International–Global Marine Division<br />
epidgeon@conservation.org<br />
Rowena Boquiren, PhD<br />
Socioeconomics and Policy Unit (SEPU) Leader<br />
Conservation International–<strong>Philippines</strong><br />
rboquiren@conservation.org<br />
Conservation International<br />
2011 Crystal Drive, Suite 500<br />
Arlington, VA 22202 USA<br />
Web: www.conservation.org<br />
This document should be cited as: R. Boquiren, G. Di Carlo,<br />
and M.C. Quibilan (Eds). 2010. Climate Change Vulnerability<br />
Assessment <strong>of</strong> <strong>the</strong> <strong>Verde</strong> <strong>Island</strong> <strong>Passage</strong>, <strong>Philippines</strong>.<br />
Technical report. Conservation International, Arlington,<br />
Virginia, USA.<br />
ii<br />
Photo credits<br />
©Teri Aquino<br />
©CI/photo by Haraldo Castro<br />
©Tim Carru<strong>the</strong>rs<br />
©Benjamin De Ridder, Marine Photobank<br />
©CI/photo by Giuseppe Di Carlo<br />
© Google Earth<br />
©Keith Ellenbogen<br />
©CI/photo by Michelle Encomienda<br />
©CI/photo by Jürgen Freund<br />
©Leonard J McKenzie<br />
©CI/photo by Miledel C. Quibilan<br />
©rembss, Flickr<br />
©Badi Samaniego<br />
©CI/photo by Sterling Zumbrunn<br />
Science Communication Team<br />
Tim Carru<strong>the</strong>rs and Jane Hawkey<br />
Integration & Application Network<br />
University <strong>of</strong> Maryland Center for<br />
Environmental Science<br />
www.ian.umces.edu
Preface<br />
The <strong>Verde</strong> <strong>Island</strong> <strong>Passage</strong>, in <strong>the</strong> sub-national area <strong>of</strong><br />
Luzon in <strong>the</strong> nor<strong>the</strong>rn <strong>Philippines</strong>, is located within <strong>the</strong><br />
globally significant Coral Triangle, an area considered<br />
<strong>the</strong> center <strong>of</strong> <strong>the</strong> world’s marine biodiversity. The <strong>Verde</strong><br />
<strong>Island</strong> <strong>Passage</strong> is a conservation corridor that spans<br />
five provinces: Batangas, Occidental Mindoro, Oriental<br />
Mindoro, Marinduque and Romblon. The abundant<br />
fish and charismatic megafauna support over 7 million<br />
people in those provinces, whose livelihoods include<br />
fishing, aquaculture, and tourism.<br />
It is projected that climate change will cause rising sea<br />
levels, higher ocean temperatures, and more acidic<br />
waters. As <strong>the</strong> ocean largely regulates <strong>the</strong> climate,<br />
changes in ocean temperatures and currents are<br />
already altering <strong>the</strong> frequency, intensity, and distribution<br />
<strong>of</strong> storms, floods, heat waves, and <strong>the</strong> amount and<br />
distribution <strong>of</strong> rainfall. The unique biodiversity <strong>of</strong> <strong>the</strong><br />
<strong>Verde</strong> <strong>Island</strong> <strong>Passage</strong> is at risk. In addition, <strong>the</strong> loss <strong>of</strong><br />
biodiversity directly impacts its local communities, as<br />
<strong>the</strong>ir livelihoods are dependent primarily on tourism,<br />
fisheries, and agriculture, all <strong>of</strong> which are dependent on<br />
<strong>the</strong>se threatened natural resources.<br />
In September 2008, Conservation International,<br />
in cooperation with several partners, conducted a<br />
vulnerability assessment to gauge <strong>the</strong> likely impacts<br />
<strong>of</strong> climate change on marine ecosystems <strong>of</strong> <strong>the</strong> <strong>Verde</strong><br />
<strong>Island</strong> <strong>Passage</strong> and <strong>the</strong> human communities that are<br />
dependent upon <strong>the</strong>m. The assessment evaluated <strong>the</strong><br />
vulnerability <strong>of</strong> <strong>the</strong> <strong>Verde</strong> <strong>Island</strong> <strong>Passage</strong> to climate<br />
change and determined <strong>the</strong> priority actions needed to<br />
ensure that its ecosystems and coastal societies can<br />
adapt to future climate conditions.<br />
This study brought toge<strong>the</strong>r experts on <strong>the</strong> <strong>Verde</strong> <strong>Island</strong><br />
<strong>Passage</strong> marine environment, climate scientists, social<br />
scientists, government <strong>of</strong>ficials, and local stakeholders,<br />
all working under a common agenda: <strong>the</strong> need to<br />
maintain and increase <strong>the</strong> resilience <strong>of</strong> biodiversity <strong>of</strong><br />
this area.<br />
This report contains <strong>the</strong> scientific studies that underpin<br />
<strong>the</strong> immediate and substantial actions needed<br />
to increase <strong>the</strong> adaptive capacity <strong>of</strong> <strong>Verde</strong> <strong>Island</strong><br />
<strong>Passage</strong>’s ecosystems and <strong>the</strong> people that depend on<br />
<strong>the</strong>m. Adapting to climate change is <strong>the</strong> only solution<br />
to ensure ecosystems and human societies can<br />
survive and maintain <strong>the</strong>ir wellbeing when exposed to<br />
climate change impacts. These studies will support<br />
<strong>the</strong> development <strong>of</strong> “climate-smart” plans for <strong>the</strong> local<br />
governments <strong>of</strong> <strong>the</strong> <strong>Verde</strong> <strong>Island</strong> <strong>Passage</strong>.<br />
Conservation International and it partners are<br />
committed to continue to support <strong>the</strong>ir efforts towards<br />
ensuring <strong>the</strong> biodiversity <strong>of</strong> <strong>the</strong> <strong>Verde</strong> <strong>Island</strong> <strong>Passage</strong><br />
is protected and can adapt to future conditions for <strong>the</strong><br />
benefit <strong>of</strong> <strong>the</strong> society and its future generations.<br />
Romeo B. Trono<br />
County Executive Director<br />
Conservation International–<strong>Philippines</strong><br />
iii
Acknowledgements<br />
This document is <strong>the</strong> result <strong>of</strong> a collective effort and<br />
would not have been possible without <strong>the</strong> contributions<br />
<strong>of</strong> many people and organizations. Conservation<br />
International would like to acknowledge <strong>the</strong> work <strong>of</strong> <strong>the</strong><br />
faculty and researchers <strong>of</strong> <strong>the</strong> Marine Science Institute,<br />
University <strong>of</strong> <strong>the</strong> <strong>Philippines</strong>–Diliman, and De La Salle<br />
University: Niva Gonzales, Rina Rosales, Miledel C.<br />
Quibilan, Sheila Vergara, Michelle Reyes, and Annabelle<br />
Trinidad.<br />
This work would not have been possible without <strong>the</strong><br />
kind support and contribution <strong>of</strong> <strong>the</strong> Presidential<br />
Task Force on Climate Change <strong>of</strong> <strong>the</strong> Government<br />
<strong>of</strong> <strong>the</strong> <strong>Philippines</strong>, <strong>the</strong> Provincial Government <strong>of</strong><br />
Batangas, <strong>the</strong> Provincial Governments <strong>of</strong> Occidental<br />
and Oriental Mindoro, <strong>the</strong> Provincial Government <strong>of</strong><br />
Marinduque, <strong>the</strong> Provincial Government <strong>of</strong> Romblon,<br />
and all <strong>the</strong>ir Municipal Governments, <strong>the</strong> Department <strong>of</strong><br />
Environment and Natural Resources (DENR), and <strong>the</strong><br />
Philippine Atmospheric, Geophysical and Astronomical<br />
Services Administration (PAGASA).<br />
We also express our gratitude to each <strong>of</strong> <strong>the</strong><br />
Climate Change Vulnerability Assessment Workshop<br />
participants and <strong>the</strong>ir home institutions, and to <strong>the</strong><br />
numerous staff at Conservation International who<br />
provided feedback and input in several stages <strong>of</strong> this<br />
project.<br />
iv
Table <strong>of</strong> contents<br />
Chapter 1: Vulnerability assessment <strong>of</strong> marine ecosystems and<br />
fisheries to climate change in <strong>the</strong> <strong>Verde</strong> <strong>Island</strong> <strong>Passage</strong> ................................1<br />
Executive summary........................................................................................................................2<br />
Introduction.......................................................................................................................................6<br />
Study area ......................................................................................................................................6<br />
Hazards...........................................................................................................................................8<br />
Exposure......................................................................................................................................... 13<br />
Sea surface temperature in <strong>the</strong> <strong>Verde</strong> <strong>Island</strong> <strong>Passage</strong> ................................................... 13<br />
Wave exposure........................................................................................................................... 13<br />
Coastal erosion.......................................................................................................................... 16<br />
Marine flooding........................................................................................................................... 20<br />
Exacerbating features <strong>of</strong> <strong>the</strong> <strong>Verde</strong> <strong>Island</strong> <strong>Passage</strong>......................................................... 21<br />
Sensitivity....................................................................................................................................... 22<br />
Habitat and data description.................................................................................................. 22<br />
Method <strong>of</strong> assessing sensitivity............................................................................................. 24<br />
Sea surface temperature impact........................................................................................... 26<br />
Storm impact .............................................................................................................................. 27<br />
Sea level rise impact................................................................................................................. 27<br />
Adaptive capacity......................................................................................................................... 30<br />
Vulnerability................................................................................................................................... 33<br />
Consequence <strong>of</strong> this habitat sensitivity to diversity......................................................... 33<br />
Consequence <strong>of</strong> this habitat sensitivity to fisheries......................................................... 35<br />
Vulnerable areas vs. ecologically critical or sensitive areas........................................... 40<br />
Recommendations.......................................................................................................................41<br />
Research and monitoring imperatives...................................................................................41<br />
Scenarios for adaptation......................................................................................................... 42<br />
Recommendations and next steps........................................................................................ 42<br />
Early response and immediate managment recommendations..................................... 44<br />
References..................................................................................................................................... 45<br />
Chapter 2: Human well-being and climate change in <strong>the</strong><br />
<strong>Verde</strong> <strong>Island</strong> <strong>Passage</strong>: vulnerability assessment for adaptation ............... 47<br />
Introduction.................................................................................................................................... 48<br />
Objective...................................................................................................................................... 48<br />
Methodology.................................................................................................................................. 49<br />
Results and discussion............................................................................................................. 52<br />
Pr<strong>of</strong>ile <strong>of</strong> <strong>the</strong> <strong>Verde</strong> <strong>Island</strong> <strong>Passage</strong>...................................................................................... 52<br />
Vulnerability assessment <strong>of</strong> human well-being.................................................................. 64<br />
Conclusions and recommendations.................................................................................... 75<br />
Fisheries ...................................................................................................................................... 75<br />
Tourism sector............................................................................................................................ 76<br />
Foreshore development .......................................................................................................... 76<br />
Health and food safety ............................................................................................................ 76<br />
References..................................................................................................................................... 78<br />
Chapter 3: Recommendations for adapting to climate change impacts........................ 79<br />
Chapter 4: Outreach and communication strategy ................................................................ 83<br />
Executive summary..................................................................................................................... 84<br />
Introduction.................................................................................................................................... 85<br />
About <strong>the</strong> workshops ............................................................................................................... 85<br />
Results............................................................................................................................................. 86<br />
Preliminary workshops ............................................................................................................. 86<br />
Vulnerability assessment workshop ..................................................................................... 87<br />
Recommendations...................................................................................................................... 92<br />
References..................................................................................................................................... 93<br />
v
chapter 1 • vulnerability assessment <strong>of</strong> marine ecosystems and fisheries to climate change<br />
Chapter 1:<br />
Vulnerability assessment <strong>of</strong><br />
marine ecosystems and fisheries<br />
to climate change in <strong>the</strong> <strong>Verde</strong><br />
<strong>Island</strong> <strong>Passage</strong><br />
Laura T. David 1, Lead Integrator<br />
Contributing Authors: Porfirio Alino 1, Vera Christine Horigue 1, Wilfredo Licuanan 2, Samuel Mamauag 1, Evangeline<br />
Magdaong 1, Eileen Penaflor 1, Riovie Ramos 1, Maricar Samson 1, Fernando Siringan 1, Leah Soria 1, Victor Ticzon 1,<br />
Cesar Villanoy 1<br />
1 Marine Science Institute, College <strong>of</strong> Science, University <strong>of</strong> <strong>the</strong> <strong>Philippines</strong>–Diliman, Quezon City, <strong>Philippines</strong><br />
2 De La Salle University, 2407 Taft Avenue, Manila, <strong>Philippines</strong><br />
1
climate change vulnerability assessment <strong>of</strong> <strong>the</strong> verde island passage, philippines<br />
Executive summary<br />
This report syn<strong>the</strong>sizes <strong>the</strong> five studies <strong>of</strong> <strong>the</strong><br />
“Vulnerability Assessment <strong>of</strong> Marine Biodiversity<br />
and Related Human Well-Being in <strong>the</strong> <strong>Verde</strong> <strong>Island</strong><br />
<strong>Passage</strong>” project funded by <strong>the</strong> Conservation<br />
International. Implemented by researchers from <strong>the</strong><br />
Marine Science Institute <strong>of</strong> <strong>the</strong> University <strong>of</strong> <strong>the</strong><br />
<strong>Philippines</strong> and De La Salle University, <strong>the</strong> research<br />
activities focused on <strong>the</strong> characterization <strong>of</strong> <strong>the</strong><br />
geological, physical and biological environment and<br />
fisheries <strong>of</strong> <strong>the</strong> <strong>Verde</strong> <strong>Island</strong> <strong>Passage</strong> (VIP). The<br />
objective was to determine <strong>the</strong> vulnerability <strong>of</strong> <strong>the</strong> VIP<br />
marine biodiversity to impacts <strong>of</strong> climate change, which<br />
included changes in ocean temperature, sea level rise,<br />
and increased frequency <strong>of</strong> more devastating typhoons.<br />
Rationale<br />
The <strong>Verde</strong> <strong>Island</strong> <strong>Passage</strong>, located in <strong>the</strong> Sulu-<br />
Sulawesi Seascape is <strong>the</strong> area <strong>of</strong> interest since it has<br />
been identified as a Marine Biodiversity Conservation<br />
Corridor as identified under Ong et al. 2002 and EO<br />
578. Based on <strong>the</strong> recent coral reef assessments<br />
by CI–<strong>Philippines</strong>, 319 coral species belonging to<br />
74 coral genera have been observed in <strong>the</strong> passage<br />
(CI 2009). Carpenter and Springer (2005) noted<br />
that more than half <strong>of</strong> <strong>the</strong> documented fish species<br />
worldwide overlap in this area <strong>of</strong> <strong>the</strong> <strong>Philippines</strong>.<br />
Fur<strong>the</strong>rmore, iconic species such as dolphins, whales,<br />
turtles, and whalesharks occur in <strong>the</strong> passage (Dolar<br />
2006). Moreover, <strong>of</strong> added significant value to <strong>the</strong><br />
project is <strong>the</strong> fact that <strong>the</strong> VIP is <strong>the</strong> area where <strong>the</strong><br />
State <strong>of</strong> <strong>the</strong> Coast has been piloted in <strong>the</strong> province <strong>of</strong><br />
Batangas hence <strong>the</strong>re exists an opportunity to scale up<br />
<strong>the</strong>se efforts and at <strong>the</strong> same integrate within an ICM<br />
approach.<br />
Description <strong>of</strong> approach<br />
The vulnerability analyses <strong>of</strong> <strong>the</strong> VIP to <strong>the</strong> potential<br />
impacts <strong>of</strong> climate change required considering its<br />
degree <strong>of</strong> physical and geological exposure, <strong>the</strong><br />
sensitivity <strong>of</strong> its coastal habitats, and <strong>the</strong>ir inherent<br />
adaptive capacity to cope with such an impact (IPCC<br />
2007). Because <strong>of</strong> <strong>the</strong> particular characteristics <strong>of</strong> <strong>the</strong><br />
VIP, <strong>the</strong> availability <strong>of</strong> data and related literature, and<br />
time constraints, <strong>the</strong> climate change impacts that were<br />
considered for biodiversity were limited to sea surface<br />
temperature rise, storminess, and sea level rise.<br />
The research activities on exposure included studying:<br />
• time series <strong>of</strong> heating stress;<br />
• wave and storm surge simulations;<br />
• historical coastal erosion;<br />
• likelihood <strong>of</strong> inundation; and,<br />
• additional naturally occurring exacerbating features.<br />
Sensitivity studies focused on qualifying impacts<br />
<strong>of</strong> increase in sea surface temperature (SST),<br />
storminess, and sea level rise to corals, seagrasses,<br />
and mangroves. While <strong>the</strong> ecological adaptive capacity<br />
was investigated using a change detection over a time<br />
series <strong>of</strong> remotely sensed images as a proxy for <strong>the</strong><br />
ability <strong>of</strong> <strong>the</strong> system to withstand an impact.<br />
Toge<strong>the</strong>r <strong>the</strong>se exposure, sensitivity, and adaptive<br />
capacity give insight to <strong>the</strong> <strong>Verde</strong> <strong>Island</strong> <strong>Passage</strong><br />
vulnerability to climate change. In particular, <strong>the</strong> study<br />
highlighted <strong>the</strong> effect <strong>of</strong> climate change to coral and<br />
reef fish diversity and consequently also to fisheries.<br />
Pertinent results<br />
A 0.15-0.30°C/decade sea surface temperature<br />
increase in <strong>the</strong> VIP region was seen over <strong>the</strong> last<br />
2 decades. In general in <strong>the</strong> VIP, coastal areas<br />
experienced less increase relative to areas <strong>of</strong>fshore.<br />
However, embayed areas were observed to be more<br />
susceptible to prolonged extreme heating events most<br />
likely due to longer residence time <strong>of</strong> warm water within<br />
bays as compared to open coasts.<br />
Analysis showed that <strong>the</strong> probable percentage loss<br />
<strong>of</strong> live hard coral cover due to increase in ocean<br />
temperature ranged from 3% to 22% across <strong>the</strong><br />
<strong>Verde</strong> <strong>Island</strong> <strong>Passage</strong>. The sites deemed to be highly<br />
vulnerable are those with high cover <strong>of</strong> Acropora<br />
sp. and pocilloporids. Sites with minimal losses are<br />
mostly dominated by <strong>the</strong> coral Porites sp. As such, <strong>the</strong><br />
municipalities <strong>of</strong> Mabini and Tingloy have <strong>the</strong> highest<br />
vulnerability with percentage loss <strong>of</strong> 11% to 22% and<br />
14% to 21% respectively. The municipality <strong>of</strong> Lubang<br />
had an estimated loss 8% to 15%.<br />
It should be noted however, that longer-term time series<br />
SST from HadISST1 (1900-2008 for <strong>the</strong> VIP) shows<br />
a lesser degree <strong>of</strong> increase <strong>of</strong> only a 0.06 oC/decade<br />
in <strong>the</strong> longer-term. In addition, <strong>the</strong> 10-yr smoo<strong>the</strong>d<br />
and de-trended annual HadISST1 also compares<br />
particularly well with <strong>the</strong> Pacific Decadal Oscillation<br />
(PDO) index for <strong>the</strong> same period with an observed<br />
lag <strong>of</strong> 5-10 years. This observation emphasizes <strong>the</strong><br />
telecommunication between <strong>the</strong> Pacific and <strong>the</strong> VIP<br />
region and suggests that use <strong>of</strong> <strong>the</strong> last 2-3 decades <strong>of</strong><br />
data to simulate future scenarios should be interpreted<br />
with caution. Specifically, all satellite-derived images<br />
go back in time only as far as <strong>the</strong> last PDO-shift in<br />
1977 from negative to positive. All synoptic data<br />
2
chapter 1 • vulnerability assessment <strong>of</strong> marine ecosystems and fisheries to climate change: executive summary<br />
available <strong>the</strong>refore belong to <strong>the</strong> PDO positive regime.<br />
In 2008, <strong>the</strong> early stage <strong>of</strong> a cool phase <strong>of</strong> <strong>the</strong> PDO<br />
was observed. Aside from <strong>the</strong> increase in temperature<br />
averages, <strong>the</strong> degree and frequency <strong>of</strong> anomalies might<br />
be what is crucial as <strong>the</strong> succession <strong>of</strong> effects would<br />
prevent its recovery rate and steady increases may<br />
cause more adaptive capacity.<br />
An average <strong>of</strong> two to three storms passed near <strong>the</strong><br />
<strong>Verde</strong> <strong>Island</strong> <strong>Passage</strong> corridor annually. There were no<br />
strong typhoons (Category 4-5) in <strong>the</strong> period before<br />
1975 but in recent years roughly more than half belong<br />
to <strong>the</strong> strong typhoon categories. Fortunately, <strong>the</strong> wave<br />
fetch within <strong>Verde</strong> <strong>Passage</strong> is not large because <strong>of</strong> <strong>the</strong><br />
narrow configuration <strong>of</strong> <strong>the</strong> passage thus waves do<br />
not develop into large waves during typical monsoon<br />
conditions or even during storm conditions. The only<br />
areas prone to surges in <strong>Verde</strong> <strong>Island</strong> <strong>Passage</strong> are<br />
those that are exposed to wide areas <strong>of</strong> water such<br />
as <strong>the</strong> coastlines facing <strong>the</strong> Sibuyan Sea (eastern<br />
Batangas, Quezon, and eastern Mindoro coasts) and<br />
those facing <strong>the</strong> South China Sea including Lubang<br />
<strong>Island</strong>.<br />
Storms bring about high sedimentation from <strong>the</strong><br />
uplands and potential erosion at <strong>the</strong> coast. Overall<br />
large sediment supply to <strong>the</strong> coast results in net land<br />
gain is observed on most <strong>of</strong> <strong>the</strong> delta plains during <strong>the</strong><br />
last 50 to 60 years. In Batangas, land progradation in<br />
delta plains coincide with periods <strong>of</strong> high annual rainfall,<br />
while erosion occurred during periods <strong>of</strong> decreased<br />
precipitation over <strong>the</strong> last 40 years. Long steep slopes<br />
have practically no forest cover, which also promotes<br />
higher sediment yield. In Batangas, where sugarcane<br />
is a major agricultural product, erosion is not arrested<br />
by any structure that would break <strong>the</strong> flow <strong>of</strong> surface<br />
run<strong>of</strong>f resulting in high rates <strong>of</strong> erosion. Areas such as<br />
Nasugbu, Balayan, Batangas, Boac, and Calapan that<br />
experienced rapid accretion in recent years, are also<br />
<strong>the</strong> most vulnerable to coastal inundation. However,<br />
coastal erosion in Batangas City and Calapan is<br />
instead attributed to improperly placed and designed<br />
engineering structures and removal <strong>of</strong> mangrove<br />
forests; and liquefaction due to tsunami associated with<br />
7.1M 1994 earthquake, respectively.<br />
Based on <strong>the</strong> monitoring <strong>of</strong> reefs east <strong>of</strong> <strong>the</strong><br />
VIP, estimated coral cover losses during tropical<br />
storm is about 8% to 21%. These projections are<br />
considered conservative. Diversity is already low in<br />
<strong>the</strong> municipalities surveyed, <strong>the</strong>reby making <strong>the</strong>m<br />
even more vulnerable to storm events based on <strong>the</strong><br />
estimates. The municipality <strong>of</strong> Nasugbu is deemed to be<br />
<strong>the</strong> most vulnerable <strong>of</strong> all <strong>the</strong> sites regardless <strong>of</strong> low or<br />
severe impact. Losses in coral genera will change from<br />
28 to 21.8% during severe impact.<br />
The four sites in <strong>the</strong> VIP with known seagrass<br />
distribution are analyzed to have low sensitivity to<br />
sediment perturbation caused by an increase in storm<br />
intensity and frequency. The projection may be different<br />
if analysis will include eutrophication caused by influx <strong>of</strong><br />
freshwater from increased storm/rainfall frequency.<br />
The VIP corridor is within a very tectonically active area<br />
where <strong>the</strong>re are numerous active faults and volcanoes<br />
and where earthquakes are very frequent. Liquefaction,<br />
subsidence and tsunami can cause extensive and rapid<br />
coastal inundation, thus, global sea-level rise would<br />
be amplified. On <strong>the</strong> o<strong>the</strong>r hand, land emergence<br />
or uplift can counter <strong>the</strong> effect <strong>of</strong> sea-level rise. The<br />
predominance <strong>of</strong> net land gain, during a period when<br />
sea level is supposed to be rising, can be due to uplift.<br />
However, <strong>the</strong>re are no tide gauge records in <strong>the</strong> VIP<br />
corridor that can be examined to test this idea.<br />
Reef area loss due to sea level rise for <strong>the</strong> VIP ranges<br />
from 0.38% to 7%. Note that <strong>the</strong>se only apply to <strong>the</strong><br />
deepest portion <strong>of</strong> <strong>the</strong> reef slope. Assuming that <strong>the</strong><br />
coral distribution and diversity are even for <strong>the</strong> entire<br />
reef area, diversity loss obtained using <strong>the</strong> species area<br />
curve estimated 0.60% to 0.80% loss. Specifically,<br />
Batangas City and Nasugbu are highly vulnerable with<br />
0.60% to 0.80% diversity loss while <strong>the</strong> rest <strong>of</strong> <strong>the</strong><br />
municipalities surveyed have relatively lower estimates<br />
<strong>of</strong> 0.60% to 0.70% diversity loss.<br />
If sensitivity assessment will be based on <strong>the</strong> areal<br />
extent <strong>of</strong> potential mangrove areas almost all areas<br />
included in this report will be inundated with 1m rise<br />
in sea level except for <strong>the</strong> municipalities <strong>of</strong> San Juan,<br />
Batangas and Calapan City, Oriental Mindoro.<br />
Overall, Calatagan, followed by Puerto Galera-Naujan<br />
appears stable in that changes to live coral and<br />
macrophyte cover are minimal through <strong>the</strong> years. The<br />
live coral cover <strong>of</strong> Batangas East and West Marinduque<br />
also appears stable. The most significant live coral<br />
cover loss can be seen for <strong>the</strong> islands <strong>of</strong> Lubang and<br />
Maricaban.<br />
Chlorophyll data within and around <strong>the</strong> VIP shows <strong>the</strong><br />
seasonality <strong>of</strong> <strong>the</strong> signal with higher signal during <strong>the</strong><br />
NE monsoon. Fur<strong>the</strong>r investigation <strong>of</strong> <strong>the</strong> NE signal<br />
shows <strong>the</strong> higher chlorophyll concentration in <strong>the</strong><br />
western side <strong>of</strong> <strong>the</strong> VIP. Sites within <strong>the</strong> VIP showed<br />
a positive chl anomaly during a strong La Niña (1999-<br />
2001) with a 1 year lag between <strong>the</strong> eastern and<br />
western part. This could have implications in <strong>the</strong> near<br />
future because PDO negative (in which we are in now)<br />
have been associated with more La Niñas.<br />
3
climate change vulnerability assessment <strong>of</strong> <strong>the</strong> verde island passage, philippines<br />
In an increasing sea surface temperature, most <strong>of</strong><br />
<strong>the</strong> fisheries target species will be affected through<br />
disruption in timing <strong>of</strong> reproduction, decreased<br />
reproductive output, shorter larval duration, lower recruit<br />
survivorship, and recruitment failure leading to changes<br />
in fisheries productivity. Impact on critical habitats such<br />
as coral reefs, seagrasses, and mangroves will affect<br />
<strong>the</strong> aforementioned attributes <strong>of</strong> <strong>the</strong> associated fauna<br />
that include high value target species (e.g., siganids,<br />
groupers, snappers). For sea level rise, some habitats<br />
such as mangroves will be inundated that will reduce<br />
available areas for recruitment <strong>of</strong> associated fauna that<br />
have fisheries value. In coral reefs, species on shallower<br />
parts (e.g., reef flats) will be affected compared to those<br />
on reef slopes. Increase in frequency and intensity <strong>of</strong><br />
storms can greatly affect recruitment <strong>of</strong> target species<br />
through reduction <strong>of</strong> suitable sites for recruitment and<br />
reduction in abundance and species diversity due to<br />
habitat loss and decreased habitat complexity.<br />
A total <strong>of</strong> 16 species <strong>of</strong> reef fishes listed in Pratchett<br />
et al. (2008) was observed in <strong>the</strong> VIP. Percentage<br />
loss <strong>of</strong> reef fish species ranged from 9% to 14%.<br />
The municipality <strong>of</strong> Nasugbu was deemed to have <strong>the</strong><br />
highest vulnerability as it could lose 16% <strong>of</strong> <strong>the</strong> 44<br />
observed fish species, followed by Looc, Calatagan,<br />
and San Juan with estimated losses <strong>of</strong> 14%, 12%, and<br />
10% respectively.<br />
The vulnerability assessment for <strong>the</strong> fisheries utilizes<br />
<strong>the</strong> information ga<strong>the</strong>red from <strong>the</strong> literature to identify<br />
<strong>the</strong> fisheries resources (target species, fishery stocks)<br />
that will be most affected (i.e., vulnerable vis-à-vis <strong>the</strong><br />
prospective climate impacts) by extreme changes in <strong>the</strong><br />
climate. Emphasis was placed upon knowledge <strong>of</strong> <strong>the</strong><br />
critical life stages (e.g., larvae, juveniles, reproductive<br />
stages) <strong>of</strong> <strong>the</strong> species as well as some information on<br />
<strong>the</strong>ir catch rates and habitat conditions. It has been<br />
acknowledged that changes in <strong>the</strong> climate (e.g., rising<br />
sea surface temperature, increase in storm frequency,<br />
storm surges) would possibly introduce greatest impact<br />
upon larval, juvenile and reproductive stages <strong>of</strong> target<br />
species affecting distributional patterns (e.g., Munday<br />
et al. 2008). Target species may also be influenced by<br />
changes in <strong>the</strong> climate indirectly through habitat loss<br />
and fragmentation (e.g., coral loss through bleaching<br />
events, inundation <strong>of</strong> mangroves areas) affecting <strong>the</strong>ir<br />
recruitment, survivorship and abundance (Pratchett et<br />
al. 2008). The associated habitats <strong>of</strong> <strong>the</strong> target species<br />
were determined as this will allow fur<strong>the</strong>r examination <strong>of</strong><br />
<strong>the</strong> conditions <strong>of</strong> <strong>the</strong>se habitats harboring <strong>the</strong> critical life<br />
stages. The presence <strong>of</strong> habitat types (e.g., seagrass<br />
beds, mangroves) that enhances <strong>the</strong> growth and<br />
survivorship and what drives <strong>the</strong> population dynamics <strong>of</strong><br />
<strong>the</strong> species potentially will serve as a gauge or index as<br />
what would be vulnerable to climate change.<br />
The fisheries that are most vulnerable are those<br />
involving fishes that need different habitats throughout<br />
<strong>the</strong>ir life stages. For example, Mabini and Lubang/Looc<br />
have grouper and snapper fisheries. These fishes make<br />
use <strong>of</strong> estuaries, mangroves, seagrasses, corals, and<br />
<strong>the</strong> pelagic realm during <strong>the</strong> different stages in <strong>the</strong>ir life.<br />
Key recommendations<br />
The fisheries ecosystem approach to management<br />
will need to be put in place as natural links to <strong>the</strong><br />
present conservation efforts with <strong>the</strong> tourism industry.<br />
Environmental concerns will not only marginalize fishers<br />
and <strong>the</strong>ir fishing grounds, exacerbate <strong>the</strong> impending<br />
climate change impacts but will jeopardize <strong>the</strong> future <strong>of</strong><br />
our next generations.<br />
• Adaptation mechanisms would require that <strong>the</strong><br />
present CRM programs need to be more tightly<br />
integrated through establishing knowledge based<br />
communities. The various CRM working groups<br />
would also need to engage with each o<strong>the</strong>r<br />
through inter-LGU arrangement joint fisheries law<br />
enforcement teams (FLET) and bay management<br />
councils or VIP level alliances can be formed.<br />
Coastal law enforcement will need to integrate<br />
ecosystem management and zoning policy<br />
considerations, e.g., foreshore management,<br />
infrastructure and human settlements regulations<br />
• Based on available literature on <strong>the</strong> interconnectivity<br />
<strong>of</strong> mangrove, seagrass and coral reef, protecting<br />
adjacent ecosystems may increase <strong>the</strong> resilience <strong>of</strong><br />
<strong>the</strong>se ecosystems to <strong>the</strong> impacts, including that <strong>of</strong><br />
climate change. Therefore, in sites that have shown<br />
significant adaptive capacity and at <strong>the</strong> same time<br />
in sites where <strong>the</strong> fisheries were found vulnerable,<br />
measures must be taken to reduce <strong>of</strong> prevailing<br />
threats such as illegal and destructive fishing,<br />
emerging pollution and habitat degradation from<br />
urban and industrial development. Where critical<br />
life stages are important it would be important to<br />
consider a combination <strong>of</strong> establishment <strong>of</strong> an<br />
expanded protection zone to serve both as a canary<br />
for improving adaptive management and (see also<br />
adaptive management below), and have regulated<br />
activities through close and open seasons and<br />
gear regulations in conjunction with safety nets and<br />
incentives for affected sectors.<br />
• In addition, given that sea level will accelerate in <strong>the</strong><br />
coming years and that storms are likely to increase<br />
in frequency and possibly streng<strong>the</strong>n, <strong>the</strong> natural<br />
buffers to sea level rise and impact <strong>of</strong> large waves,<br />
such as coral reefs and mangroves, should be<br />
protected and rehabilitated.<br />
• Deforestation and extensive agriculture in <strong>the</strong><br />
watersheds, long steep slopes, and presence <strong>of</strong><br />
numerous faults, high seismicity, and volcanoes all<br />
4
chapter 1 • vulnerability assessment <strong>of</strong> marine ecosystems and fisheries to climate change: executive summary<br />
promote a high sediment yield. These have likely<br />
played a large role in <strong>the</strong> degradation <strong>of</strong> coral<br />
reef ecosystems and in <strong>the</strong> decline <strong>of</strong> coastal and<br />
<strong>of</strong>fshore fisheries. In <strong>the</strong> formulation <strong>of</strong> mitigation<br />
and adaptation measures, this link between <strong>the</strong><br />
marine ecosystem and <strong>the</strong> watershed should be<br />
considered.<br />
• In some areas, this high sediment yield has resulted<br />
to rapid accretion. Instead <strong>of</strong> utilizing <strong>the</strong> newly<br />
prograded lands in <strong>the</strong> VIP for various development,<br />
<strong>the</strong>se can instead be used by <strong>the</strong> LGUs and<br />
national agencies as buffers to erosion and action<br />
<strong>of</strong> large waves. Greenbelts, <strong>of</strong> <strong>the</strong> appropriate<br />
assemblage, can be established in <strong>the</strong>se newly<br />
prograded lands. Wide mangrove plains will also<br />
reduce <strong>the</strong> level <strong>of</strong> nutrients and sediments entering<br />
<strong>the</strong> sea and create nursery habitats for fisheries.<br />
• Erosion along <strong>the</strong> coast is mostly caused about<br />
by human modifications such as inappropriate<br />
ports, quarrying, and removal <strong>of</strong> mangroves and<br />
seagrasses. Steps must be taken to position<br />
ports in such as way as not to impede longshore<br />
sediment drift and advocate constructing open<br />
ports that allow water to flow in between pilings.<br />
Stop stone mining and educate people from various<br />
strata <strong>of</strong> <strong>the</strong> functions <strong>of</strong> mangroves and coral reefs<br />
towards <strong>the</strong> protection <strong>of</strong> <strong>the</strong> beach.<br />
approach to <strong>the</strong> climate change adaptation measures.<br />
These would require <strong>the</strong> formulation <strong>of</strong> a research,<br />
development and extension program that incorporates<br />
an appropriate monitoring design for <strong>the</strong> impending<br />
potential impacts. It would require <strong>the</strong> participation <strong>of</strong><br />
<strong>the</strong> local higher education institutions to engage with<br />
<strong>the</strong> relevant stakeholders to build knowledge-based<br />
communities in <strong>the</strong> VIP where lessons learned and<br />
knowledge gained are regularly fed back, e.g., through<br />
<strong>the</strong> State <strong>of</strong> <strong>the</strong> Coasts report.<br />
Targeted research<br />
Complementary to <strong>the</strong> monitoring would be a targeted<br />
research, development and extension agenda that<br />
look at how <strong>the</strong> adaptive capacity <strong>of</strong> <strong>the</strong> coastal areas,<br />
<strong>the</strong>ir ecosystems and fisheries can cope with climate<br />
change. Long-term monitoring toge<strong>the</strong>r with simulation<br />
models that investigates how to enhance <strong>the</strong> adaptive<br />
capacity (e.g., abundance, coverage and range <strong>of</strong><br />
vulnerable ecosystems and habitats) will need to define<br />
<strong>the</strong> priority research questions and <strong>the</strong>ir interdisciplinary<br />
concerns. A network <strong>of</strong> sensors (e.g., <strong>the</strong>rmal sensors<br />
and wea<strong>the</strong>r stations) linked or akin to <strong>the</strong> ICE CREAM<br />
program will be useful for <strong>the</strong> VIP in mainstreaming<br />
climate change adaptation measures.<br />
Areas that suggest that adaptation measures are<br />
imperative shall be those which are crucial to marine<br />
biodiversity, <strong>the</strong> life histories <strong>of</strong> important fisheries<br />
species, and human well-being.<br />
For biodiversity and fisheries, <strong>the</strong>se areas would be<br />
high candidate sites for expanding sizes or establishing<br />
areas as marine protected areas (MPA). This will not<br />
only help in <strong>the</strong> conservation <strong>of</strong> existing flora and<br />
fauna but also in <strong>the</strong> replenishment <strong>of</strong> fisheries stocks<br />
by regulating fishing effort. In addition to MPA, it is<br />
imperative that adoption <strong>of</strong> access and use rights<br />
fisheries management interventions are put in place<br />
such as closed and open seasons, gear regulations and<br />
effort controls, combined with access incentives linked<br />
to stewardship (e.g., reserves related to enhancement<br />
and sea ranching <strong>of</strong> highly valued invertebrates<br />
species).<br />
For human well-being, <strong>the</strong>se areas would also be sites<br />
which deliver multiple services to <strong>the</strong> community not<br />
only as source <strong>of</strong> livelihood but also provide protection<br />
from climate-related hazards.<br />
Adaptive management<br />
Considering <strong>the</strong> constraints on <strong>the</strong> available information<br />
and <strong>the</strong> unfolding changes occurring in <strong>the</strong> VIP, it is<br />
imperative to incorporate an adaptive management<br />
5
climate change vulnerability assessment <strong>of</strong> <strong>the</strong> verde island passage, philippines<br />
Introduction<br />
The vulnerability analyses <strong>of</strong> <strong>the</strong> <strong>Verde</strong> <strong>Island</strong> <strong>Passage</strong><br />
(VIP) requires considering <strong>the</strong> components and<br />
measures <strong>of</strong> potential impacts to and adaptive capacity<br />
<strong>of</strong> <strong>the</strong> critical marine habitats and fisheries (Allison et al.<br />
2009, Worldfish Center 2009).<br />
increase sea<br />
surface<br />
temperature<br />
exposure<br />
sea level<br />
rise<br />
increased<br />
storm<br />
frequency<br />
and intensity<br />
The potential impact <strong>of</strong> climate change to an<br />
ecosystem includes <strong>the</strong> degree that it is exposed and<br />
its ecological and social-economic state which has<br />
an inherent sensitivity to a changing environment. The<br />
adaptive capacity <strong>of</strong> an ecosystem on <strong>the</strong> o<strong>the</strong>r hand<br />
would depend on <strong>the</strong>ir congenital capacity (including<br />
associated symbionts like <strong>the</strong>ir zooxan<strong>the</strong>llae) and<br />
survival from historical exposures. The focus <strong>of</strong> study<br />
presented here, given <strong>the</strong> time restrictions and budget<br />
constraints, is on sensitivity and exposure.<br />
Predictions <strong>of</strong> changes in temperature, precipitation<br />
and sea level as a result <strong>of</strong> climate change in <strong>the</strong><br />
<strong>Philippines</strong> are summarized by Hulme and Sheard<br />
(1999). These predictions were derived from climate<br />
experiments from several global climate models<br />
conducted for <strong>the</strong> Intergovernmental Panel on Climate<br />
Change (IPCC) and historical observed climate data.<br />
Some general climate predictions for <strong>the</strong> <strong>Philippines</strong><br />
include a temperature increase <strong>of</strong> about 0.1-0.3°C/<br />
decade, an enhanced seasonal precipitation variation<br />
(e.g., drier months become drier and wetter months<br />
become wetter) and a slight sea level increase <strong>of</strong> about<br />
30cm by 2045.<br />
The goal <strong>of</strong> this study is to estimate, using <strong>the</strong> best<br />
available information, oceanographic and climate<br />
change effects and its potential impacts on critical<br />
marine habitats, threatened species and fisheries in<br />
<strong>the</strong> VIP. Because <strong>of</strong> <strong>the</strong> particular characteristics <strong>of</strong> <strong>the</strong><br />
<strong>Passage</strong>, <strong>the</strong> availability <strong>of</strong> data and related literature,<br />
and time constraints, <strong>the</strong> climate change impacts that<br />
were considered for biodiversity were limited to sea<br />
surface temperature rise, storminess, and sea level rise<br />
(Figure 1).<br />
target<br />
species<br />
sensitivity<br />
gear<br />
quantity,<br />
distribution,<br />
and<br />
dependance<br />
on habitats<br />
potential impact<br />
and<br />
adaptive capacity<br />
vulnerability to<br />
climate change impacts<br />
Figure 1. Diagram <strong>of</strong> each <strong>of</strong> <strong>the</strong> elements considered and<br />
how <strong>the</strong>y relate to one ano<strong>the</strong>r in <strong>the</strong> assessment.<br />
Study area<br />
The <strong>Verde</strong> <strong>Island</strong> <strong>Passage</strong> is an important strait for<br />
water exchange between <strong>the</strong> South China Sea and <strong>the</strong><br />
Sibuyan Sea and eventually <strong>the</strong> Pacific. It also forms<br />
a natural boundary between basins. The shallowest<br />
and narrowest point <strong>of</strong> <strong>the</strong> passage is in <strong>the</strong> vicinity <strong>of</strong><br />
<strong>the</strong> <strong>Verde</strong> <strong>Island</strong> (Figure 2). Net flow in <strong>Verde</strong> <strong>Island</strong><br />
<strong>Passage</strong> is to <strong>the</strong> west during <strong>the</strong> nor<strong>the</strong>ast monsoon<br />
and to <strong>the</strong> east during <strong>the</strong> southwest monsoon (Figure<br />
3).<br />
The coasts along <strong>the</strong> <strong>Verde</strong> <strong>Island</strong> <strong>Passage</strong> corridor<br />
are geomorphologically varied. Cliffed rocky shorelines<br />
occur where steep mountain slopes adjoin <strong>the</strong> sea. In<br />
some areas, <strong>the</strong>se rocky coastlines are fringed with<br />
narrow sandy or gravelly beach and coral reefs. Narrow<br />
and gently sloping sandy coastal plains develop from<br />
small rivers draining <strong>the</strong> flanks <strong>of</strong> volcanoes. Large<br />
rivers, on <strong>the</strong> o<strong>the</strong>r hand, form broad and relatively flat<br />
sandy to muddy delta plains with or without associated<br />
mangroves.<br />
6
chapter 1 • vulnerability assessment <strong>of</strong> marine ecosystems and fisheries to climate change: introduction<br />
0<br />
-2000<br />
-4000<br />
14.0<br />
13.5<br />
Lubang<br />
Is.<br />
<strong>Verde</strong> Is.<br />
<strong>Passage</strong><br />
Tingloy Is.<br />
<strong>Verde</strong> Is.<br />
The <strong>Verde</strong> <strong>Island</strong> <strong>Passage</strong>, located in <strong>the</strong> Sulu-Sulawesi<br />
Seascape, has been identified as a Marine Biodiversity<br />
Conservation Corridor as identified under Ong et al.<br />
2002 and EO 578. Based on <strong>the</strong> recent coral reef<br />
assessments by CI–<strong>Philippines</strong>, 319 coral species<br />
belonging to 74 coral genera have been observed<br />
in <strong>the</strong> passage (CI 2009). Carpenter and Springer<br />
(2005) noted that more than half <strong>of</strong> <strong>the</strong> documented<br />
fish species worldwide overlap in this area <strong>of</strong> <strong>the</strong><br />
<strong>Philippines</strong>. Fur<strong>the</strong>rmore, iconic species such as<br />
dolphins, whales, turtles, and whalesharks occur in <strong>the</strong><br />
<strong>Passage</strong> (Dolar 2006).<br />
13.0<br />
119.6 119.8 120.0 120.2 120.4 120.6 120.8 121.0 121.2 121.4<br />
Figure 2. Bathymetry <strong>of</strong> <strong>the</strong> <strong>Verde</strong> <strong>Island</strong> <strong>Passage</strong>.<br />
120ºE 122ºE 120ºE 122ºE<br />
Surrounding VIP are 5 provinces: Batangas, Mindoro<br />
Occidental, Mindoro Oriental, Quezon, and Marinduque<br />
(Figure 4) with a total population <strong>of</strong> 7,800,175 (as <strong>of</strong><br />
2007).<br />
Figure 3. Schematic <strong>of</strong> seasonal circulation during <strong>the</strong><br />
nor<strong>the</strong>ast monsoon (left) and <strong>the</strong> southwest monsoon (right)<br />
around Mindoro (Han et al. 2009).<br />
1<br />
2<br />
33<br />
3<br />
5<br />
4<br />
32<br />
6 7<br />
8<br />
9 10 12<br />
11<br />
34<br />
31<br />
30<br />
29<br />
13<br />
35<br />
28<br />
14<br />
27<br />
15<br />
16<br />
17<br />
18<br />
19<br />
20<br />
21<br />
22<br />
23<br />
24<br />
26<br />
25<br />
N<br />
0 14 28 km<br />
Figure 4. The municipalities surrounding <strong>the</strong> VIP (clustered by Province) in clockwise order: Batangas Province (1-15; 34,<br />
35) Lubang(1), Looc(2), Lian(3), Calatagan(4), Balayan(5), Calaca(6), Lemery(7), Taal(8), San Luis(9), Bauan(10), Mabini(11),<br />
Tingloy (34), San Pascual(12), Batangas City(13), <strong>Verde</strong> <strong>Island</strong> (35), Lobo(14), San Juan(15); Quezon Province (16-20)<br />
Sariaya(16), Lucena(17), Pagbilao(18), Padre Burgos (19), Agdangan(20); MarinduqueProvince (21-24) MogPog(21),<br />
Boac(22), Gasan(23), Buenavista(24); Mindoro Oriental (25-31) Pinamalayan(25), Pola(26), Naujan(27), Calapan(28),<br />
Baco(29), San Teodoro(30), Puerto Galera(31); Mindoro Occidental (32, 33) Abra de Ilog(32), Paluan(33).<br />
7
climate change vulnerability assessment <strong>of</strong> <strong>the</strong> verde island passage, philippines<br />
Hazards<br />
Among <strong>the</strong> components <strong>of</strong> climate change that<br />
may affect marine biodiversity include temperature,<br />
storminess, precipitation, sea-level rise, air-sea CO 2<br />
concentration, changes in ocean circulation patterns,<br />
health <strong>of</strong> functionally linked neighboring ecosystems, as<br />
well as, human responses to climate change (Gilman<br />
et al. 2008). Knowledge <strong>of</strong> <strong>the</strong> extent or severities<br />
<strong>of</strong> vulnerability <strong>of</strong> coastal areas to <strong>the</strong>se threats are<br />
needed in <strong>the</strong> formulation <strong>of</strong> mitigation and adaptation<br />
measures.<br />
Increase in ocean temperature<br />
Philippine-wide sea surface temperature (SST) has<br />
experienced an average increase <strong>of</strong> about 0.025°C/<br />
year. However, <strong>the</strong> increase has not been spatially<br />
homogenous with areas in <strong>the</strong> nor<strong>the</strong>rn tip <strong>of</strong> Luzon and<br />
eastern Visayas increasing <strong>the</strong> fastest while <strong>the</strong> lowest<br />
increase is found in western Mindanao (Figure 5).<br />
latitude<br />
21ºN<br />
18ºN<br />
15ºN<br />
12ºN<br />
9ºN<br />
6ºN<br />
0.035<br />
0.03<br />
0.025<br />
0.02<br />
0.015<br />
14ºN<br />
13ºN<br />
12ºN<br />
120ºE 121ºE 122ºE 123ºE<br />
1985-2005 Trends (˚C/decade)<br />
0<br />
0.05 0.1 0.15 0.2 0.25 0.3 0.35 0.4<br />
Figure 6. SST increase (°C/year) in <strong>the</strong> <strong>Verde</strong> <strong>Island</strong> <strong>Passage</strong><br />
from 1985-2006.<br />
Overall, SST anomalies exhibited inter-annual variability.<br />
This was explored by comparing <strong>the</strong> Maximum SST<br />
calculated for each year with <strong>the</strong> long-term average<br />
annual maximum SST (also referred to as <strong>the</strong> BaseMax<br />
as defined by NOAA–CRW) (Figure 7). The BaseMax<br />
is calculated using <strong>the</strong> entire data set but without <strong>the</strong><br />
identified anomalous years 1987-88, 1992-93, 1998-<br />
99, 2001-02. Results show significantly warmer SST<br />
occurred in <strong>the</strong> VIP during transition from a strong<br />
El Niño to a strong La Niña (i.e., 1987 and 1998<br />
determined from Niño 3.4 data from <strong>the</strong> ENSO region<br />
in <strong>the</strong> middle <strong>of</strong> <strong>the</strong> Pacific). The annual variability is<br />
fur<strong>the</strong>r highlighted using spatially-explicit difference<br />
between <strong>the</strong> Maximum SST for <strong>the</strong> year and <strong>the</strong><br />
BaseMax (Figure 8). Again, 1987 and 1998 are seen<br />
as significantly warm years for <strong>the</strong> VIP, along with 1992,<br />
2001, and 2005.<br />
114ºE 117ºE 120ºE 123ºE 126ºE 129ºE<br />
longitude<br />
Figure 5 SST increase (°C/year) from 1985-2005 (taken<br />
from ICE-CREAM Proj.1 mid-term report).<br />
2.5<br />
2.0<br />
For <strong>the</strong> <strong>Verde</strong> <strong>Island</strong> <strong>Passage</strong>, <strong>the</strong> study on sea<br />
surface temperature utilized <strong>the</strong> 1985-2006 gapfilled,<br />
4 km resolution, weekly SST product developed<br />
by <strong>the</strong> National Oceanographic and Atmospheric<br />
Administration–Coral Reef Watch (NOAA–CRW). The<br />
NOAA AVHRR 22-year data showed a 0.15-0.30 oC/<br />
decade increase in <strong>the</strong> VIP region (Figure 6). In general<br />
in <strong>the</strong> VIP, coastal areas experienced less increase<br />
relative to areas <strong>of</strong>fshore. The only exception to this<br />
observation is <strong>the</strong> nor<strong>the</strong>ast side <strong>of</strong> Occidental Mindoro<br />
and <strong>the</strong> northwestern tip <strong>of</strong> Lubang <strong>Island</strong>. Offshore<br />
<strong>of</strong> Calatagan in western Batangas is also exceptional<br />
since it is <strong>the</strong> only site that shows near-zero increase in<br />
<strong>the</strong> last 22 years.<br />
SST anomaly<br />
1.5<br />
1.0<br />
0.5<br />
0<br />
-0.5<br />
-1.0<br />
-1.5<br />
-2.0<br />
-2.5<br />
Niño 3.4<br />
VIP<br />
Figure 7. Niño 3.4 region SST anomalies compared to VIP 5<br />
month running mean. Highlighted beyond <strong>the</strong> gray shading<br />
are anomalies > ENSO +0.5 C.<br />
8
chapter 1 • vulnerability assessment <strong>of</strong> marine ecosystems and fisheries to climate change: introduction<br />
I. 1985-1990<br />
II. 1991-1996<br />
III. 1997-2002<br />
IV. 2003-2005<br />
Maximum SST anomaly<br />
-1.4 -1.0 -0.6 -0.2 0.2 0.6 1.0 1.4 1.8<br />
Figure 8. Annual maximum SST anomaly: Max SST-basemax.<br />
Longer-term time series SST from HadISST1 (1900-<br />
2008 for <strong>the</strong> VIP) shows a lesser degree <strong>of</strong> increase <strong>of</strong><br />
only a 0.06°C/decade in <strong>the</strong> longer-term (Figure 9a).<br />
HadISST1 is an interpolated SST global product <strong>of</strong><br />
<strong>the</strong> UK Met Office Hadley Centre which makes use <strong>of</strong><br />
“both in situ SST observations from ships and buoys,<br />
and bias-adjusted SST from <strong>the</strong> satellite-borne AVHRR<br />
(inclusion started in 1982)” (Rayner et al. 2003).<br />
The 10-yr smoo<strong>the</strong>d and de-trended annual HadISST1<br />
(Figure 9b) also compares particularly well with <strong>the</strong><br />
Pacific Decadal Oscillation (PDO) index for <strong>the</strong> same<br />
period (Figure 9c) (http://jisao.washington.edu/pdo/<br />
PDO.latest) with an observed lag <strong>of</strong> 5-10 years.<br />
This observation emphasizes <strong>the</strong> telecommunication<br />
between <strong>the</strong> Pacific and <strong>the</strong> VIP region and suggests<br />
that use <strong>of</strong> <strong>the</strong> last 2-3 decades <strong>of</strong> data to simulate<br />
future scenarios should be interpreted with caution.<br />
Specifically, all satellite-derived images go back in time<br />
only as far as <strong>the</strong> last PDO-shift in 1977 from negative<br />
to positive. All synoptic data available <strong>the</strong>refore belong<br />
to <strong>the</strong> PDO positive regime. In 2008, <strong>the</strong> early stage<br />
<strong>of</strong> a cool phase <strong>of</strong> <strong>the</strong> PDO was observed. There are<br />
no long-term synoptic data or satellite-derived data to<br />
represent <strong>the</strong> this cool phase.<br />
Increase in cyclonicity<br />
High SST fuels creation <strong>of</strong> storms. The <strong>Philippines</strong>, in<br />
particular, lies at <strong>the</strong> western boundary <strong>of</strong> <strong>the</strong> Pacific<br />
and typically experiences more than 20 typhoons per<br />
year. Patterns <strong>of</strong> typhoon generation and propagation<br />
in <strong>the</strong> western North Pacific have been shown to be<br />
related to <strong>the</strong> ENSO cycle as well as to o<strong>the</strong>r large<br />
scale atmospheric circulation (Camargo et al. 2007).<br />
Analysis <strong>of</strong> western Pacific Typhoon track data that<br />
a)<br />
SS<br />
b)<br />
SST (detrended)<br />
c)<br />
annual PDO<br />
29.5<br />
29.0<br />
28.5<br />
28.0<br />
27.5<br />
0.20<br />
0.15<br />
0.10<br />
0.05<br />
0<br />
-0.05<br />
-0.10<br />
-0.15<br />
-0.20<br />
2.5<br />
2.0<br />
1.5<br />
1.0<br />
0.5<br />
0<br />
-0.5<br />
-1.0<br />
-1.5<br />
-2.0<br />
-2.5<br />
1900<br />
1906<br />
1912<br />
1918<br />
1924<br />
1930<br />
1936<br />
1942<br />
1948<br />
1954<br />
1960<br />
1966<br />
1972<br />
1978<br />
1984<br />
1990<br />
1996<br />
2002<br />
2008<br />
smoo<strong>the</strong>d detrended annual SST<br />
1900<br />
1905<br />
1910<br />
1915<br />
1920<br />
1925<br />
1930<br />
1935<br />
1940<br />
1945<br />
1950<br />
1955<br />
1960<br />
1965<br />
1970<br />
1975<br />
1980<br />
1985<br />
1990<br />
annual mean PDO index<br />
smoo<strong>the</strong>d annual mean PDO index<br />
Figure 9. HadISST1 data for <strong>the</strong> VIP: a) annual mean SST;<br />
b) 10-yr smoo<strong>the</strong>d and detrended annual HadISST1; and c)<br />
Pacific Decadal Oscillation (PDO) index (1900-2008).<br />
1995<br />
2000<br />
2005<br />
1.0<br />
0.8<br />
0.6<br />
0.4<br />
0.2<br />
0<br />
-0.2<br />
-0.4<br />
-0.6<br />
-0.8<br />
-1.0<br />
smoo<strong>the</strong>d annual PDO<br />
9
climate change vulnerability assessment <strong>of</strong> <strong>the</strong> verde island passage, philippines<br />
passed through <strong>the</strong> <strong>Philippines</strong> indicate a southward<br />
shift in <strong>the</strong> typhoon trajectories in <strong>the</strong> past decade<br />
(Anglo 2005) and an increased relative frequency <strong>of</strong><br />
typhoons generated in <strong>the</strong> South China Sea (Ho et al.<br />
2004) (Figure 10). Several investigators however, have<br />
indicated <strong>the</strong> high natural variability <strong>of</strong> tropical storms<br />
and typhoons, which makes it difficult to detect long<br />
term changes that can be attributed to climate change.<br />
The <strong>Verde</strong> <strong>Island</strong> <strong>Passage</strong> lies within <strong>the</strong> track <strong>of</strong> most<br />
<strong>of</strong> <strong>the</strong> typhoons in <strong>the</strong> western Pacific and it is during<br />
<strong>the</strong>se events that sea conditions can become rough.<br />
Historical typhoon track data (Figure 11a) show that<br />
160 typhoons passed to within 200 km <strong>of</strong> <strong>the</strong> VIP<br />
from 1952-2008 (Japan Meteorology Agency 2009)<br />
amounting to about 11% <strong>of</strong> <strong>the</strong> total tropical cyclones<br />
in <strong>the</strong> Western Pacific since <strong>the</strong> 1950s. The typhoon<br />
track data within 200 km from VIP are shown in (Figure<br />
11b). The color <strong>of</strong> <strong>the</strong> data points represent year with<br />
blue as <strong>the</strong> oldest (1952) and dark red as <strong>the</strong> most<br />
recent (2008), and <strong>the</strong> size is scaled according to<br />
<strong>the</strong> storm category. It can be seen that <strong>the</strong>re were no<br />
strong typhoons (Category 4-5) in <strong>the</strong> period before<br />
1975 and for <strong>the</strong> most recent years (dark red points),<br />
roughly more than half belong to <strong>the</strong> strong typhoon<br />
categories.<br />
a)<br />
b)<br />
latitude<br />
latitude<br />
16ºN<br />
15ºN<br />
14ºN<br />
16ºN<br />
15ºN<br />
14ºN<br />
13ºN<br />
12ºN<br />
11ºN<br />
119ºE 120ºE 121ºE 122ºE 123ºE 124ºE<br />
longitude<br />
2005<br />
2000<br />
1995<br />
1990<br />
1985<br />
1980<br />
From <strong>the</strong> JWTC dataset which starts after WWII, an<br />
average <strong>of</strong> two to three storms passed near <strong>the</strong> <strong>Verde</strong><br />
<strong>Island</strong> <strong>Passage</strong> corridor annually. However, <strong>the</strong>re were<br />
some years when at least six typhoons crossed <strong>the</strong><br />
area. The highest occurrence was in 1993 with eight<br />
storms (Figure 12).<br />
13ºN<br />
12ºN<br />
11ºN<br />
1975<br />
1970<br />
1065<br />
1960<br />
1955<br />
119ºE 120ºE 121ºE 122ºE 123ºE 124ºE<br />
longitude<br />
latitude<br />
40ºN<br />
20ºN<br />
0ºN<br />
100ºE 120ºE 140ºE 160ºE<br />
longitude<br />
Figure 10. Number <strong>of</strong> tropical cyclones are increasing in <strong>the</strong><br />
Pacific and significantly passing through <strong>the</strong> middle <strong>of</strong> <strong>the</strong><br />
<strong>Philippines</strong> (Anglo 2005).<br />
1.0<br />
0.8<br />
0.6<br />
0.4<br />
0.2<br />
0<br />
-0.2<br />
-0.4<br />
-0.6<br />
-0.8<br />
-1.0<br />
Figure 11 a) Plot <strong>of</strong> typhoon tracks from 1950- 2009; and b)<br />
Storm track data from 1952-2008 within 200 km from <strong>Verde</strong><br />
<strong>Island</strong>. Size <strong>of</strong> points scaled to storm category (2-5) while<br />
color is scaled to year. (Data source: Japan Meteorology<br />
Agency 2009).<br />
frequency<br />
8<br />
6<br />
4<br />
2<br />
0<br />
1940 1950 1960 1970 1980 1990 2000 2010<br />
year<br />
Figure 12. Storm frequency within a 200 km radius from<br />
Calapan, Mindoro. Data is from JWTC.<br />
10
chapter 1 • vulnerability assessment <strong>of</strong> marine ecosystems and fisheries to climate change: introduction<br />
Changes in rainfall<br />
PAGASA precipitation records from Calapan,<br />
Mindoro and Ambulong, Batangas for <strong>the</strong> period<br />
1961 to 2004 show that annual rainfall fluctuates<br />
from 1000 to 3500 mm (Figure 13). The two records<br />
display similar seasonal fluctuations but opposing<br />
long-term precipitation trends over <strong>the</strong> 43-year<br />
period. Annual rainfall has increased in Calapan, but<br />
Ambulong shows an overall decrease. This highlights<br />
<strong>the</strong> spatial heterogeneity <strong>of</strong> rainfall and <strong>the</strong> need for<br />
more monitoring stations. More specifically, <strong>the</strong>re is<br />
a need for meteorological stations distributed along<br />
representative coastal areas <strong>of</strong> <strong>the</strong> VIP.<br />
Sea level rise<br />
The Global Sea Level Observing System has two sites<br />
in <strong>the</strong> <strong>Philippines</strong> (i.e., Manila and Legaspi). Both <strong>of</strong><br />
<strong>the</strong>se coastal data show a relative sea-level increase<br />
<strong>of</strong> between 20cm and 40cm since <strong>the</strong> 1960s (Figure<br />
14). This observed rise is most likely a compounded<br />
3500<br />
3000<br />
consequence <strong>of</strong> excessive land reclamation, possible<br />
subsidence due to groundwater extraction and residual<br />
rise in sea-level due to warmer oceans.<br />
Altimetry data from <strong>the</strong> satellites TOPEX–Poseidon<br />
(1992-2005) and JASON–1 (2001-present) gives a<br />
time series <strong>of</strong> <strong>of</strong>fshore sea level on ei<strong>the</strong>r side <strong>of</strong> <strong>Verde</strong><br />
passage (Figure 15). Both sides have undergone<br />
changes fluctuating around mean sea level with <strong>the</strong><br />
eastern side <strong>of</strong> <strong>the</strong> passage being more variable.<br />
Since 2005, <strong>the</strong>re seems to be a more steady positive<br />
increase <strong>of</strong> about 1.0 mm/yr on <strong>the</strong> east and 0.5 mm/yr<br />
on <strong>the</strong> west.<br />
These <strong>of</strong>fshore altimetry observations however are not<br />
enough to determine site-specific relative sea level rise.<br />
Unfortunately, <strong>the</strong>re are no long-term tide gauge data<br />
along <strong>the</strong> VIP. This poses a problem for local decision<br />
development planning.<br />
a)<br />
10<br />
8<br />
6<br />
west<br />
4<br />
annual rainfall (mm)<br />
2500<br />
2000<br />
1500<br />
1000<br />
mean sea level (mm)<br />
2<br />
0<br />
-2<br />
-4<br />
-6<br />
-8<br />
Figure 13. Annual rainfall from 1961 to 2004 for Calapan,<br />
Mindoro and Ambulong, Batangas. Data is from PAGASA.<br />
relative sea level (cm)<br />
500<br />
0<br />
740<br />
720<br />
700<br />
680<br />
Calapan, Mindoro<br />
Ambulong, Batangas<br />
1960 1965 1970 1975 1980 1985 1990 1995 2000 2005<br />
year<br />
b)<br />
mean sea level (mm)<br />
-10<br />
10<br />
east<br />
8<br />
6<br />
4<br />
2<br />
0<br />
-2<br />
-4<br />
-6<br />
-8<br />
-10<br />
Figure 15. SSH time series from satellite altimetry.<br />
660<br />
1900 1920 1940 1960 1980 2000<br />
year<br />
Figure 14. Relative annual-mean sea-level for Manila, South<br />
Harbour, (blue; 1901-1997; 14.58°N, 120.93°E)<br />
and Legaspi (red; 1947-1997; 13.15°N, 123.75°E) in <strong>the</strong><br />
<strong>Philippines</strong>. (http://www.cru.uea.ac.uk/~mikeh/research/<br />
philippines.pdf)<br />
11
climate change vulnerability assessment <strong>of</strong> <strong>the</strong> verde island passage, philippines<br />
Ocean acidification<br />
Increasing dissolved CO 2<br />
in ocean water results to<br />
a decrease in ocean pH. This has been observed<br />
in Manoa Lua-Pacific time series (Figure 16a). The<br />
decrease in pH is projected to cause harm in marine<br />
life ocean fisheries and mariculture (Cooley and Doney<br />
2009, Pew Center 2009).<br />
The problem is that <strong>the</strong>re are no available long-term<br />
data for <strong>the</strong> <strong>Philippines</strong> and <strong>the</strong>refore it is not part <strong>of</strong><br />
any future prediction scenarios (Figure 16b).<br />
a)<br />
400<br />
375<br />
350<br />
atmospheric CO 2<br />
(ppmv)<br />
seawater pCO 2<br />
(uatm)<br />
seawater pH<br />
8.38<br />
8.33<br />
8.28<br />
CO 2<br />
8.18<br />
pH<br />
325<br />
8.13<br />
300<br />
8.08<br />
b)<br />
275<br />
8.03<br />
1900 1920 1940 1960 1980 2000<br />
year<br />
Figure 16. a) Observed decrease in ocean pH. Figure credit:<br />
Richard A. Feely, Pacific Marine Environmental Laboratory,<br />
National Oceanic and Atmospheric Administration, USA,<br />
with atmospheric data from Pieter Tans and seawater data<br />
from David Karl. Adapted from Feely (2008) in Levinson and<br />
Lawrimore (eds), Bull. Am. Meteorol. Soc, 89(7): S58; and<br />
b) Ocean acidification model 2040 from http://colli239.fts.<br />
educ.msu.edu/p=19864.<br />
12
chapter 1 • vulnerability assessment <strong>of</strong> marine ecosystems and fisheries to climate change: exposure<br />
Exposure<br />
SST in <strong>the</strong> <strong>Verde</strong> <strong>Island</strong> <strong>Passage</strong><br />
From <strong>the</strong> satellite-determined 2009 coral cover in<br />
<strong>the</strong> <strong>Verde</strong> <strong>Island</strong> <strong>Passage</strong> (VIP), representative sites<br />
were chosen for <strong>the</strong>rmal stress analysis. For a total <strong>of</strong><br />
10 sites, accumulated hotspots and degree heating<br />
months were calculated. Accumulated hotspots<br />
pertain to <strong>the</strong> number <strong>of</strong> times in a given year that <strong>the</strong><br />
temperature reached at least 1 degree higher than<br />
maximum mean monthly climatological sea surface<br />
temperature (SST). Degree heating months pertain to<br />
number <strong>of</strong> times <strong>the</strong> accumulated hotspots lasted for at<br />
least one month in a given year.<br />
Results show that 1998 was definitely a warm year<br />
for all <strong>of</strong> <strong>the</strong> sites. Lubang in particular, located in<br />
<strong>the</strong> western extent <strong>of</strong> <strong>the</strong> VIP has also constantly<br />
experienced warm events through <strong>the</strong> years (Figure<br />
17). Surviving live corals in <strong>the</strong>se areas could be<br />
already adapted to warm anomalies and are <strong>the</strong>refore<br />
good candidates for protection if <strong>the</strong> aim is to have at<br />
least one remaining surviving site in <strong>the</strong> VIP in case <strong>of</strong><br />
continued ocean warming. In contrast Naujan-Gloria<br />
and Marinduque located in <strong>the</strong> eastern extent seems to<br />
be <strong>the</strong> least prone to warm anomalies (except for <strong>the</strong><br />
1998 event).<br />
DHMs show areas where hotspots lasted for at least<br />
one month in a given year (Figure 18). This prolonged<br />
heating is an index <strong>of</strong> likely mass bleaching occurrences<br />
in <strong>the</strong> last 20 years. Sites in <strong>the</strong> middle <strong>of</strong> <strong>the</strong> passage<br />
seem to suffer more frequent DHMs. Interestingly,<br />
although Lubang intermittently experience warm<br />
anomalies, it was <strong>the</strong> only one that did not suffer from<br />
a DHM event during <strong>the</strong> 1998 event. It did however,<br />
experience a DHM event in 1985 when none <strong>of</strong> <strong>the</strong><br />
o<strong>the</strong>r sites did so. In contrast, sites on <strong>the</strong> eastern<br />
VIP (Batangas East, Marinduque, and Naujan-Gloria)<br />
experienced DHM at no o<strong>the</strong>r time but <strong>the</strong> 1998 event.<br />
1985-1989<br />
Max DHM<br />
1985-1989<br />
1990-1994<br />
1995-1999<br />
2000-2005<br />
Figure 18. Degree Heating Months from 1985-2005 for 10<br />
representative sites in <strong>the</strong> VIP.<br />
The embayments <strong>of</strong> east Calumpan, west Batangas<br />
Bay, and Naujan-Gloria suffered <strong>the</strong> highest occurrence<br />
<strong>of</strong> DHM in 1998. In general, <strong>the</strong>refore it seems that<br />
reefs in more embayed areas may be more susceptible<br />
to prolonged extreme heating events most likely due<br />
to longer residence time <strong>of</strong> warm water within bays as<br />
compared to open coasts.<br />
Wave exposure<br />
Wave and storm surge models were used to simulate<br />
conditions during natural low (non-storm events) and<br />
high (storm events) energy conditions. The wave model<br />
was based on third-generation SWAN (Simulating<br />
WAves Nearshore) while <strong>the</strong> storm surge used <strong>the</strong><br />
2-dimensional Delft3D Flow model, both developed by<br />
Delft University <strong>of</strong> Technology (DELFT3D Hydraulics).<br />
Both models were computed on a horizontal orthogonal<br />
curvilinear grid. The wave model made use <strong>of</strong> coarse<br />
and high resolution nested grids in order to obtain<br />
wave and wind conditions in <strong>the</strong> open boundary <strong>of</strong> <strong>the</strong><br />
high resolution grid. The coarse grid model covers <strong>the</strong><br />
nor<strong>the</strong>rn coast <strong>of</strong> Lubang <strong>Island</strong> (western boundary)<br />
extending to <strong>the</strong> sou<strong>the</strong>rn tip <strong>of</strong> Masbate. The high<br />
resolution grid model occupies <strong>of</strong>fshore <strong>of</strong> Lubang<br />
<strong>Island</strong> (western boundary) extending to <strong>Verde</strong> <strong>Island</strong><br />
<strong>Passage</strong> up to <strong>the</strong> sou<strong>the</strong>rn tip <strong>of</strong> Quezon and eastern<br />
coast <strong>of</strong> Mindoro (sou<strong>the</strong>rn boundary). Finer grids were<br />
nested to <strong>the</strong> high resolution grid to investigate wave<br />
energy propagation in specific areas such as Balayan<br />
Bay and Batangas Bay. Wave and wind forcings<br />
imposed at <strong>the</strong> open boundaries were obtained from<br />
<strong>the</strong> available typhoon track analysis (JMA) and archive<br />
forecast data (www.buoywea<strong>the</strong>r.com derived from<br />
WAVEWATCH III <strong>of</strong> NOAA).<br />
1990-1994<br />
1995-1999<br />
2000-2005<br />
Figure 17. Accumulated HOTSPOTS from 1985-2005 for<br />
10 representative sites in <strong>the</strong> VIP.<br />
13
climate change vulnerability assessment <strong>of</strong> <strong>the</strong> verde island passage, philippines<br />
Historical data <strong>of</strong>f Lubang <strong>Island</strong> shows a strong<br />
correlation between winds and waves in <strong>the</strong> study<br />
area (Figure 19). Wind speeds are generally stronger<br />
(8-10 ms -1 ) during <strong>the</strong> nor<strong>the</strong>ast monsoon months<br />
(November-March). Southwest monsoon (June-<br />
October) wind speeds are weaker (
chapter 1 • vulnerability assessment <strong>of</strong> marine ecosystems and fisheries to climate change: exposure<br />
80 knots. Even during this high intensity event, winds<br />
within <strong>the</strong> <strong>Verde</strong> <strong>Passage</strong> move across <strong>the</strong> passage<br />
thus fetch is limited and waves do not become fully<br />
developed. The maximum significant wave heights<br />
were about 10m and were found in <strong>the</strong> area east and<br />
nor<strong>the</strong>ast <strong>of</strong> Marinduque.<br />
For <strong>the</strong> first period, <strong>the</strong> center <strong>of</strong> <strong>the</strong> storm can be<br />
seen in <strong>the</strong> area west <strong>of</strong> Marinduque with relatively low<br />
significant wave heights (Figure 22a). Within <strong>the</strong> <strong>Verde</strong><br />
<strong>Passage</strong>, waves can still be significant (8m) although<br />
smaller in magnitude compared to <strong>the</strong> waves in <strong>the</strong><br />
Sibuyan Sea. An estimate <strong>of</strong> <strong>the</strong> amount <strong>of</strong> wave energy<br />
available at <strong>the</strong> coast to stir up sediments and infer<br />
erosion potential is <strong>the</strong> plot <strong>of</strong> bottom orbital velocity<br />
(Figure 22b). Note that <strong>the</strong> largest values <strong>of</strong> orbital<br />
velocity are found in areas with shallow gently sloping<br />
bathymetry such as along <strong>the</strong> coast <strong>of</strong> Tayabas Bay and<br />
<strong>the</strong> nor<strong>the</strong>rn coast <strong>of</strong> Lubang.<br />
For <strong>the</strong> second period used was after a period <strong>of</strong> 6<br />
hours, <strong>the</strong> typhoon has moved westwards and <strong>the</strong><br />
center can be found west <strong>of</strong> Puerto Galera. Maximum<br />
significant wave heights can still be found in <strong>the</strong><br />
northwestern Sibuyan Sea along <strong>the</strong> coast <strong>of</strong> Batangas<br />
and Quezon (Figure 23a). Wave heights within <strong>the</strong><br />
VIP although quite large, are still much lower than <strong>the</strong><br />
maximum significant wave heights.<br />
Surprisingly <strong>the</strong> areas with high bottom orbital velocities<br />
are essentially <strong>the</strong> same as <strong>the</strong> model results 6 hours<br />
earlier (Figure 23b). These areas have two things in<br />
common; shallow gently sloping bathymetries and wide<br />
expanse <strong>of</strong> water facing <strong>the</strong> coast.<br />
With almost 160 typhoons going through within 200 km<br />
from <strong>Verde</strong> <strong>Island</strong> since 1952, it becomes necessary<br />
to integrate <strong>the</strong> effects <strong>of</strong> all <strong>the</strong>se typhoons to assess<br />
<strong>the</strong> vulnerability with regards to storminess. This was<br />
a) b)<br />
20'<br />
9<br />
20'<br />
0.9<br />
14ºN<br />
8<br />
14ºN<br />
0.8<br />
7<br />
0.7<br />
40'<br />
6<br />
40'<br />
0.6<br />
latitude<br />
20'<br />
5<br />
4<br />
latitude<br />
20'<br />
0.5<br />
0.4<br />
13ºN<br />
3<br />
13ºN<br />
0.3<br />
2<br />
0.2<br />
40'<br />
1<br />
40'<br />
0.1<br />
120ºE 30' 121ºE 30' 122ºE 30'<br />
longitude<br />
120ºE 30' 121ºE 30' 122ºE 30'<br />
longitude<br />
Figure 22. Simulations for a category 5 typhoon when storm was still on <strong>the</strong> eastern side <strong>of</strong> <strong>the</strong> VIP. a) Significant wave height<br />
during typhoon with center west <strong>of</strong> Marinduque, and b) Bottom orbital velocity during typhoon with center west <strong>of</strong> Marinduque.<br />
a) b)<br />
20'<br />
9<br />
20'<br />
0.9<br />
14ºN<br />
8<br />
14ºN<br />
0.8<br />
7<br />
0.7<br />
40'<br />
6<br />
40'<br />
0.6<br />
latitude<br />
20'<br />
5<br />
4<br />
latitude<br />
20'<br />
0.5<br />
0.4<br />
13ºN<br />
3<br />
13ºN<br />
0.3<br />
2<br />
0.2<br />
40'<br />
1<br />
40'<br />
0.1<br />
120ºE 30' 121ºE 30' 122ºE 30'<br />
longitude<br />
120ºE 30' 121ºE 30' 122ºE 30'<br />
longitude<br />
Figure 23. Simulations for a category 5 typhoon when storm was still on <strong>the</strong> western side <strong>of</strong> <strong>the</strong> VIP. a) Significant wave<br />
height (m) during a typhoon with <strong>the</strong> center located near Puerto Galera, and b) Bottom orbital velocity (ms -1 ) from wave model<br />
forced by typhoon with center west <strong>of</strong> Puerto Galera.<br />
15
climate change vulnerability assessment <strong>of</strong> <strong>the</strong> verde island passage, philippines<br />
done by getting <strong>the</strong> frequency <strong>of</strong> storm track data<br />
points along a grid over <strong>the</strong> VIP and running wave<br />
simulations for storm locations at <strong>the</strong> center <strong>of</strong> each<br />
grid. The resulting wave fields were <strong>the</strong>n averaged<br />
weighted by <strong>the</strong>ir frequency. The resulting average<br />
wave heights are shown in Figure 24 . Note that <strong>the</strong><br />
highest average wave heights are found in <strong>the</strong> Sibuyan<br />
Sea to <strong>the</strong> east <strong>of</strong> <strong>Verde</strong> <strong>Passage</strong> covering <strong>the</strong> eastern<br />
coast <strong>of</strong> Batangas, <strong>the</strong> nor<strong>the</strong>ast coast <strong>of</strong> Mindoro and<br />
<strong>the</strong> western coast <strong>of</strong> Marinduque. The next highest<br />
wave heights are found in areas to <strong>the</strong> east <strong>of</strong> Lubang<br />
latitude<br />
20'<br />
14ºN<br />
40'<br />
20'<br />
13ºN<br />
40'<br />
120ºE 30' 121ºE 30' 122ºE 30'<br />
longitude<br />
6<br />
5<br />
4<br />
3<br />
2<br />
1<br />
or <strong>the</strong> western part <strong>of</strong> <strong>the</strong> <strong>Verde</strong> <strong>Passage</strong>. In general,<br />
<strong>the</strong> areas where <strong>the</strong> largest waves are found are also<br />
<strong>the</strong> areas where wave fetch is longer (i.e., more wide<br />
open ocean area) thus waves have sufficient time and<br />
distance for it to fully develop.<br />
Coastal erosion<br />
The coastal response to rising sea level is controlled by<br />
<strong>the</strong> balance between <strong>the</strong> underlying lithology, coastal<br />
gradient, sediment supply, and exposure to coastal<br />
processes such as tides and waves. Continuing rise in<br />
sea level will cause coastal erosion or enhance that are<br />
already occurring. Low lying coastal plains will likewise<br />
be affected by seawater inundation, flooding, and storm<br />
surges, which will cause drastic changes to coastal<br />
habitats, infrastructures, and livelihood. The possible<br />
contribution <strong>of</strong> sediment supply and wave processes to<br />
shoreline changes was explored.<br />
Only wide coastal plains were included in <strong>the</strong> work<br />
because changes in shoreline positions <strong>the</strong>re are<br />
amenable to analysis using satellite images. Where<br />
rivers are small or absent, <strong>the</strong> changes in shoreline<br />
position cannot be resolved using <strong>the</strong> resolution <strong>of</strong><br />
available satellite images.<br />
Figure 24. Average wave height field calculated from storm<br />
frequency and location <strong>of</strong> historical storms within <strong>the</strong> <strong>Verde</strong><br />
<strong>Passage</strong>.<br />
Lian River—Nasugbu<br />
The sandy linear coast fronting Nasugbu Bay, from Wawa to<br />
San Diego Point, is about 5 km long and has an associated<br />
coastal plain that is more than 250 m wide (Figure 25). The<br />
satellite images show a more seaward shoreline position than<br />
that <strong>of</strong> <strong>the</strong> 1979 topographic map. Sometime between 1979<br />
and 1992, Lian river shifted its course about 1.2 km northward<br />
from its previous position. Maximal progradation <strong>of</strong> 250 m has<br />
occurred within <strong>the</strong> area <strong>of</strong> <strong>the</strong> new river mouth. Progradation<br />
decreases away from <strong>the</strong> river mouth.<br />
Figure 25. Changes in shoreline position<br />
along Lian-Nasugbu coast.<br />
16
chapter 1 • vulnerability assessment <strong>of</strong> marine ecosystems and fisheries to climate change: exposure<br />
Figure 26. Changes in shoreline position along Banabang-Molino-<br />
Balayan coast.<br />
Banabang-Molino River—Balayan<br />
Banabang-Molino is one <strong>of</strong> <strong>the</strong> watersheds<br />
draining Balayan (Figure 26). The satellite<br />
images show a net land gain <strong>of</strong> about<br />
100 meters just near its river mouth. The<br />
coast east <strong>of</strong> Balayan, on <strong>the</strong> o<strong>the</strong>r hand,<br />
which is relatively straight and dissected<br />
by several small rivers, shows both erosion<br />
and progradation brought about by human<br />
modifications. Between 1953 and 1992,<br />
Dacanlao River appears to have shifted<br />
from a slightly meandering to a straight<br />
channel—from a NE-SW orientation to a<br />
more north-south position. This change in<br />
channel course is probably man-made and<br />
is probably related to land modifications<br />
during <strong>the</strong> establishment <strong>of</strong> <strong>the</strong> Calaca<br />
power plant. Progradation by as much as<br />
80 meters appears to have occurred at <strong>the</strong><br />
river mouth. However, this progradation<br />
is likely to due to <strong>the</strong> river straightening. Before 2002, coastal modifications were made <strong>of</strong>f <strong>the</strong> power plant<br />
complex. These coastal modifications led to ~200 m erosion and ~200 m progradation west and east <strong>of</strong> <strong>the</strong><br />
power plant, respectively.<br />
Figure 27. Changes in shoreline position along Pansipit-Lemery<br />
coast.<br />
Pansipit River—Lemery<br />
Pansipit River, which drains Taal Lake,<br />
is located nor<strong>the</strong>ast <strong>of</strong> Balayan Bay.<br />
Downstream, Pansipit River splits into<br />
two with one <strong>of</strong> <strong>the</strong> distributaries passing<br />
through <strong>the</strong> built-up area <strong>of</strong> Lemery (Figure<br />
27). The coastal plain is relatively wide<br />
at about 1.2 km. Progradation <strong>of</strong> about<br />
80 m occurred between <strong>the</strong> 1950s and<br />
1992. The nor<strong>the</strong>rn river mouth also shifted<br />
towards <strong>the</strong> northwest. Erosion, reaching<br />
40 m in front <strong>of</strong> <strong>the</strong> built-up area, ensued<br />
between 1992 and 2002. The following<br />
years from 2002 to 2009, <strong>the</strong> area has<br />
again prograded by as much as 80 meters.<br />
Overall, from 1950s to present, <strong>the</strong><br />
Pansipit River coastal plain shows a net<br />
land gain <strong>of</strong> as much as 150 m.<br />
17
climate change vulnerability assessment <strong>of</strong> <strong>the</strong> verde island passage, philippines<br />
Kampumpong River—Batangas City<br />
Between 1947 to 2009, erosion <strong>of</strong> about 200 m occurred<br />
along <strong>the</strong> mouth <strong>of</strong> Kampungpong River in Batangas City<br />
(Figure 28). Topographic maps reflecting conditions prior to<br />
1947 indicate that mangroves covered this area. However, a<br />
Google Earth® image indicates that <strong>the</strong> mangrove is no longer<br />
<strong>the</strong>re. Removal <strong>of</strong> <strong>the</strong> mangrove is likely linked to <strong>the</strong> erosion.<br />
Large constructions and expansions <strong>of</strong> piers along <strong>the</strong> coast <strong>of</strong><br />
Batangas City also took place in recent years. These include<br />
<strong>the</strong> oil refineries <strong>of</strong> Caltex and Shell located north and south <strong>of</strong><br />
<strong>the</strong> river mouth, respectively; <strong>the</strong> expanded Batangas pier and<br />
a large excavated land near Santa Clara prior to 2009. These<br />
coastal modifications would have altered <strong>the</strong> pathways <strong>of</strong><br />
sediments resulting to erosion.<br />
Figure 28. Changes in shoreline position<br />
along Kampumpong-Batangas City coast.<br />
Abra de Ilog<br />
The river mouth and flanks <strong>of</strong> Abra de<br />
Ilog, from 1953 to 2001, show a net land<br />
gain <strong>of</strong> about 300 m and erosion <strong>of</strong> ~150<br />
m between 2001 and 2009 (Figure 29).<br />
Erosion is probably due to <strong>the</strong> construction<br />
<strong>of</strong> a pier about 2 km east <strong>of</strong> <strong>the</strong> river<br />
mouth. Pebble picking activities is most<br />
likely contributing to, if not <strong>the</strong> main cause,<br />
<strong>of</strong> <strong>the</strong> erosion west <strong>of</strong> <strong>the</strong> river mouth.<br />
Figure 29. Changes in shoreline position along Abra de Ilog coast.<br />
18
chapter 1 • vulnerability assessment <strong>of</strong> marine ecosystems and fisheries to climate change: exposure<br />
Figure 30. Changes in shoreline position along Malaylay-Baco<br />
coast.<br />
Malaylay-Baco<br />
Erosion <strong>of</strong> as much as 300-m occurred<br />
along <strong>the</strong> Baco-Malaylay delta between<br />
1953 and 2001 (Figure 30). From 2001<br />
to 2009, this coastline remained stable.<br />
The erosion prior to 2001 may have been<br />
triggered by liquefaction caused by <strong>the</strong><br />
magnitude 7.1 earthquake on a segment<br />
<strong>of</strong> Lubang Fault, south <strong>of</strong> <strong>Verde</strong> <strong>Island</strong><br />
on November 15, 1994. This earthquake<br />
also generated a tsunami that inundated<br />
<strong>the</strong> nor<strong>the</strong>astern coast <strong>of</strong> Mindoro from<br />
Puerto Galera to Pinamalayan, Baco<br />
islands, and <strong>Verde</strong> <strong>Island</strong> (Phil. Insti. Vol.<br />
Seis. 1994). The tsunami also traveled<br />
northwards affecting Batangas Bay and<br />
Lobo (Imamura et al. 1995). Coastal<br />
lowlands along <strong>the</strong> Calapan Bay including<br />
Malaylay, Baco, Wawa, and Baco islands<br />
were hardest hit by <strong>the</strong> tsunami <strong>of</strong> at least<br />
6 m high, flooding areas 50 to 200 m landward. Highest wave run-up <strong>of</strong> as high as 8.5 m occurred in Baco<br />
<strong>Island</strong>. The steep coastal gradient also facilitated <strong>the</strong> strong rundown that caused beach erosion <strong>of</strong> about 20<br />
m. On <strong>the</strong> o<strong>the</strong>r hand, in <strong>the</strong> gently sloping delta plains <strong>of</strong> <strong>the</strong> Malaylay-Wawa coast, aggradation occurred.<br />
Strong incoming waves scoured sands along <strong>the</strong> foreshore area and deposited <strong>the</strong> sediments inland forming<br />
a ridge, which was preserved because <strong>of</strong> <strong>the</strong> weakened backflow in relatively flat areas. The rest <strong>of</strong> Calapan,<br />
San Teodoro, and Puerto Galera experienced tsunami ranging from 2 to 3 m high. Low run-up heights <strong>of</strong> 0.5<br />
m, 0.9, and 1.2 were respectively observed in Pola, Pinamalayan, and Naujan (Phil. Insti. Vol. Seis. 1994).<br />
Figure 31. Changes in shoreline position along Mag-asawang Tubig-<br />
Naujan coast.<br />
Mag-asawang Tubig<br />
From 1950s to 2009, <strong>the</strong>re was a net<br />
land loss at <strong>the</strong> mouth and net land gain<br />
along <strong>the</strong> flanks <strong>of</strong> <strong>the</strong> Mag-asawang<br />
Tubig River in Naujan, Oriental Mindoro<br />
(Figure 31). This trend is possibly due<br />
to river switching upstream which may<br />
have been induced by differences in<br />
river discharge and amount <strong>of</strong> sediment<br />
load. The 1977 topographic map<br />
shows that Mag-asawang Tubig directly<br />
drained into <strong>the</strong> <strong>Verde</strong> <strong>Island</strong> <strong>Passage</strong><br />
just north <strong>of</strong> Bgy. Estrella in Naujan. But<br />
recent Google Earth® images indicate<br />
that at present, Mag-asawang Tubig<br />
joins <strong>the</strong> Bucayao River upstream,<br />
before emptying to <strong>the</strong> <strong>Verde</strong> <strong>Island</strong><br />
<strong>Passage</strong> through <strong>the</strong> Silonay River in<br />
Calapan.<br />
19
climate change vulnerability assessment <strong>of</strong> <strong>the</strong> verde island passage, philippines<br />
Coastal erosion in Batangas City and Calapan<br />
is attributed to improperly placed and designed<br />
engineering structures and removal <strong>of</strong> mangrove<br />
forests; and liquefaction due to tsunami associated<br />
with 7.1M 1994 earthquake, respectively. Overall, a<br />
net land gain is observed on most <strong>of</strong> <strong>the</strong> delta plains<br />
during <strong>the</strong> last 50 to 60 years. This net land gain is<br />
probably due to <strong>the</strong> large sediment supply to <strong>the</strong> coast<br />
that is still able to <strong>of</strong>fset <strong>the</strong> effect <strong>of</strong> sea level rise.<br />
Typically, sediment yield increases during high river<br />
discharge events. In Batangas, land progradation in<br />
delta plains coincide with periods <strong>of</strong> high annual rainfall,<br />
while erosion occurred during periods <strong>of</strong> decreased<br />
precipitation over <strong>the</strong> last 40 years. In Mindoro, periods<br />
<strong>of</strong> high precipitation over <strong>the</strong> last decade may have<br />
resulted in high discharge events and rain-induced<br />
landslides that in turn caused recent shifts in <strong>the</strong> course<br />
<strong>of</strong> Mag-asawang Tubig River. Consequently, new lands<br />
are being formed along <strong>the</strong> new river mouth in Calapan<br />
while <strong>the</strong> old river mouth in Naujan is undergoing<br />
erosion. The episode <strong>of</strong> net erosion from 1990s to<br />
early 2000 coincides as well with a period when more<br />
storms passed through <strong>the</strong> region; <strong>the</strong> years 1993 and<br />
1995 had 8 and 7 storms, respectively.<br />
The observed net land gain in most <strong>of</strong> <strong>the</strong> shorelines<br />
along <strong>the</strong> VIP corridor may be beneficial to <strong>the</strong><br />
remaining mangrove areas along this corridor such<br />
that it can possibly <strong>of</strong>fset <strong>the</strong> effect <strong>of</strong> sea level rise<br />
(Siringan et al., this report). Newly accreted lands may<br />
be a potential landward progression area for mangroves<br />
given <strong>the</strong> right condition for its recruitment, settlement<br />
and survival.<br />
Marine flooding<br />
Changes in shoreline positions, over <strong>the</strong> last 50 years<br />
<strong>of</strong> coastal plains within <strong>the</strong> <strong>Verde</strong> <strong>Island</strong> <strong>Passage</strong> (VIP)<br />
corridor were established through time-series analysis<br />
<strong>of</strong> maps and remotely sensed images. The likelihood<br />
to marine inundation resulting from a 1-m, 2-m, or 3-m<br />
sea-level rise was estimated from <strong>the</strong> 30-m Advanced<br />
Space-borne Thermal Emission and Reflection<br />
Radiometer (ASTER) data sets. The spatial resolution<br />
<strong>of</strong> <strong>the</strong> images limits <strong>the</strong> analysis only to coastal plains<br />
that cover more than 30 m. In rocky coasts, which are<br />
typically associated with narrow beaches, <strong>the</strong> extent <strong>of</strong><br />
inundation is no longer evident.<br />
The low-lying coastal plains <strong>of</strong> Batangas are <strong>the</strong><br />
most vulnerable to inundation by a 1 meter rise <strong>of</strong> sea<br />
level. Based on pixel counts alone, <strong>the</strong> land that will<br />
be inundated is about 175 ha in Nasugbu, 795 ha in<br />
Calatagan, 199 ha in Balayan, and 122 ha in Batangas<br />
City. Sea level rise <strong>of</strong> 1 m will predominantly affect <strong>the</strong><br />
mangrove and fishpond areas. Two and 3-m (Figure<br />
32) rises <strong>of</strong> sea level were also mapped. Areas such<br />
Figure 32. Shaded in red are <strong>the</strong> areas to be inundated by a<br />
3-m rise <strong>of</strong> sea level.<br />
as Nasugbu, Balayan, Batangas, Boac, and Calapan<br />
that experienced rapid accretion in recent years, are <strong>the</strong><br />
most vulnerable to coastal inundation.<br />
Table 1 summarizes <strong>the</strong> areas that will likely be<br />
inundated given a 1-m, 2-m, and 3-m sea level rise.<br />
Built-up areas in Balayan and Lemery are vulnerable<br />
even to just 1 and 2-m rise in sea level. Two to 3-m<br />
rise in sea level will inundate rice fields and coconut<br />
plantations that are about 5 to 10 kilometers fur<strong>the</strong>r<br />
inland, especially in Nasugbu and Calapan.<br />
Table 1. Area (ha) to be inundated given a 1-m, 2-m, 3-m sea level rise<br />
(SLR).<br />
Batangas<br />
Nasugbu<br />
Lian<br />
Calatagan<br />
Canda, Balayan, Calaca<br />
Lemery, Taal, San Luis<br />
Bauan, Mabini, Tingloy<br />
San Nicolas, Batangas City<br />
Lobo<br />
San Juan<br />
Mindoro<br />
Lubang<br />
Paluan<br />
Abra de Ilog<br />
Puerto Galera, San Teodoro, Baco, <strong>Verde</strong><br />
Calapan<br />
Naujan<br />
Pola, Pinamalayan<br />
Marinduque<br />
1-m SLR 2-m SLR 3-m SLR<br />
175.08<br />
140.86<br />
795.21<br />
199.09<br />
154.64<br />
203.22<br />
122.31<br />
62.28<br />
92.8<br />
413.37<br />
242.28<br />
119.79<br />
208.25<br />
110.02<br />
217.39<br />
86.85<br />
236.75<br />
519.24<br />
373.6<br />
1227.12<br />
552.34<br />
286.13<br />
358.38<br />
242.91<br />
97.2<br />
152.2<br />
681.39<br />
493.92<br />
220.86<br />
364.58<br />
204.43<br />
303.16<br />
141.93<br />
414.59<br />
1049.88<br />
676.18<br />
1700.25<br />
902.26<br />
504.29<br />
532.62<br />
440.37<br />
152.28<br />
267.31<br />
1069.02<br />
837.36<br />
402.84<br />
652.76<br />
527.17<br />
533.92<br />
262.35<br />
649.67<br />
20
chapter 1 • vulnerability assessment <strong>of</strong> marine ecosystems and fisheries to climate change: exposure<br />
Exacerbating features <strong>of</strong> <strong>the</strong> VIP<br />
The <strong>Verde</strong> <strong>Island</strong> <strong>Passage</strong> (VIP) corridor is within a<br />
very tectonically active area where <strong>the</strong>re are numerous<br />
active faults and volcanoes and where earthquakes are<br />
very frequent (Figure 33). Several volcanoes are also<br />
present in <strong>the</strong> area including Mt. Taal and Mt. Banahaw<br />
which are both classified as active.<br />
Consequent vertical land movements and tsunamis<br />
generated from <strong>the</strong>se earthquakes can modify <strong>the</strong><br />
vulnerability <strong>of</strong> coasts to sea-level rise due to global<br />
warming. Liquefaction, subsidence and tsunami can<br />
cause extensive and rapid coastal inundation, thus,<br />
global sea-level rise would be amplified. On <strong>the</strong> o<strong>the</strong>r<br />
hand, land emergence or uplift can counter <strong>the</strong> effect<br />
<strong>of</strong> sea-level rise. The predominance <strong>of</strong> net land gain,<br />
during a period when sea level is supposed to be rising,<br />
can be due to uplift. However, <strong>the</strong>re are no tide gauge<br />
records in <strong>the</strong> VIP corridor that can be examined to test<br />
this idea. Relatively loose pyroclastic materials which<br />
abound upstream, are easily mobilized downstream<br />
even by normal river flow. Landslides triggered by<br />
earthquakes help in supplying more sediment to <strong>the</strong><br />
coast.<br />
At <strong>the</strong> upstream end <strong>of</strong> <strong>the</strong> rivers, long steep slopes<br />
have practically no forest cover, which also promotes<br />
higher sediment yield. Siltation caused by massive<br />
deforestation elsewhere in <strong>the</strong> <strong>Philippines</strong> cause not<br />
only shift in species composition but also mortality <strong>of</strong><br />
seagrasses. In Batangas, where sugarcane is a major<br />
agricultural product, erosion is not arrested by any<br />
structure that would break <strong>the</strong> flow <strong>of</strong> surface run<strong>of</strong>f<br />
resulting in high rates <strong>of</strong> erosion. In rice fields, surface<br />
run<strong>of</strong>f passes through a series <strong>of</strong> paddies which<br />
promote settling <strong>of</strong> sediments before <strong>the</strong> water reaches<br />
a river <strong>the</strong>reby lowering <strong>the</strong> sediment load a bit.<br />
Shape = Magnitude<br />
14ºN<br />
> 7<br />
5 - 7<br />
3 - 5<br />
latitude<br />
Color = Depth (km)<br />
38 - 75<br />
75 - 177<br />
13ºN<br />
117 - 154<br />
154 - 199<br />
> 199<br />
120ºE 121ºE 122ºE<br />
longitude<br />
Figure 33. Tectonic and earthquake epicenter map <strong>of</strong> <strong>the</strong> <strong>Verde</strong> <strong>Island</strong> <strong>Passage</strong><br />
Corridor. The active faults mapped by Phil. Insti. Vol. Seis. are <strong>the</strong> following:<br />
1-Philippine Fault Zone; 2-WMVF; 3-Lubang Fault; 4-Central Mindoro Fault;<br />
5-Aglubang River Fault; 6-Sou<strong>the</strong>rn Mindoro Fault; and, 7-Central Marinduque<br />
Fault. Earthquake epicenters were compiled by <strong>the</strong> NEIC-USGS.<br />
21
climate change vulnerability assessment <strong>of</strong> <strong>the</strong> verde island passage, philippines<br />
Sensitivity<br />
Habitat and data description<br />
Coral<br />
Coral reefs are <strong>the</strong> most dominant habitat in <strong>the</strong> VIP,<br />
with a total reef area <strong>of</strong> around 7,031 hectares <strong>of</strong> which<br />
about 1,767 hectares are covered by live coral (Table<br />
2). Based on <strong>the</strong> satellite images, <strong>the</strong> reefs are fringing<br />
and generally narrow. The coral reef areas are mostly<br />
shallow, particularly on inshore areas near <strong>the</strong> bay<br />
heads. Although, some reefs still occur in deep areas<br />
particularly in <strong>the</strong> bay mouths (e.g., Bauan municipality<br />
in Batangas). The reefs are well developed on <strong>the</strong> west<br />
side <strong>of</strong> <strong>the</strong> VIP, particularly in Calatagan (including <strong>the</strong><br />
municipalities <strong>of</strong> Lian, Calatagan, and Nasugbu) and<br />
Lubang (including municipalities <strong>of</strong> Lubang and Looc,<br />
and Ambil <strong>Island</strong>) areas. On a per province basis, reef<br />
areas are more extensive in Batangas, compared to<br />
Mindoro Occidental, Mindoro Oriental, and Marinduque.<br />
Data used for <strong>the</strong> analysis were obtained from <strong>the</strong> 2007<br />
to 2008 surveys <strong>of</strong> <strong>the</strong> municipalities surrounding <strong>the</strong><br />
<strong>Verde</strong> <strong>Island</strong> <strong>Passage</strong>. These data sets were originally<br />
collected from various researchers that were contracted<br />
by Conservation International–<strong>Philippines</strong> to conduct<br />
marine protected area site identification and monitoring<br />
assessments. A total <strong>of</strong> 41 survey stations belonging<br />
to eight (8) municipalities were considered in this<br />
assessment. Table 3 presents <strong>the</strong> municipalities and<br />
survey stations that were included in this study.<br />
Each site indicated in Table 3, were used as replicates<br />
to compute for <strong>the</strong> percentage cover <strong>of</strong> live hard corals<br />
per municipality. Data used were obtained with <strong>the</strong> use<br />
<strong>of</strong> video or phototransect methods.<br />
Overall status <strong>of</strong> <strong>the</strong> coral communities in <strong>the</strong> <strong>Verde</strong><br />
<strong>Island</strong> <strong>Passage</strong> fell under <strong>the</strong> poor category with<br />
24% mean cover <strong>of</strong> live hard corals (Table 4). The<br />
municipalities <strong>of</strong> Mabini, Looc, and Nasugbu had<br />
<strong>the</strong> highest live hard cover but still fell under <strong>the</strong> fair<br />
category (Gomez et al. 1994) with percent cover values<br />
<strong>of</strong> 33.8%, 29.4%, and 29.3% respectively. Batangas<br />
Table 2. Area (ha) <strong>of</strong> coastal habitat in <strong>the</strong> <strong>Verde</strong> <strong>Island</strong> <strong>Passage</strong>.<br />
Live corals Mixed Overgrown Abiotics Total<br />
Bay area LC+DCA+RCK DCA+RCK S+R area<br />
Lubang <strong>Island</strong><br />
Calatagan<br />
East Calumpan<br />
Batangas Bay West<br />
Batangas Bay East<br />
Maricaban <strong>Island</strong><br />
West Marinduque<br />
Wawa-Paluan<br />
Puerto Galera-Naujan<br />
Naujan-Gloria<br />
572<br />
560<br />
16<br />
2<br />
172<br />
20<br />
7<br />
121<br />
248<br />
49<br />
1118<br />
802<br />
7<br />
0<br />
168<br />
10<br />
10<br />
104<br />
174<br />
68<br />
LC–live corals; DCA–dead coral with algae; RCK–rock; S–sand; R–rubble<br />
759<br />
670<br />
0<br />
0<br />
60<br />
2<br />
0<br />
27<br />
48<br />
3<br />
189<br />
146<br />
23<br />
8<br />
93<br />
35<br />
1<br />
147<br />
565<br />
27<br />
2638<br />
2178<br />
46<br />
10<br />
493<br />
67<br />
18<br />
399<br />
1035<br />
147<br />
Table 3. Study sites and municipalities considered in <strong>the</strong> vulnerability<br />
assessment <strong>of</strong> <strong>the</strong> coral and reef fish communities in <strong>the</strong> <strong>Verde</strong> <strong>Island</strong><br />
<strong>Passage</strong>.<br />
Municipality Study sites Survey date Researchers<br />
Batangas<br />
Calatagan<br />
Looc<br />
Lubang<br />
Mabini<br />
Nasugbu<br />
San Juan<br />
Tingloy<br />
Grotto<br />
Napayong<br />
Pitong Gatang<br />
Promontory/ Matuko Pt.<br />
East Sta. Ana<br />
Gulod<br />
Karitonan/ Carretunan<br />
South Bagong Silang<br />
Talisay<br />
Tanagan<br />
West Bagong Silang<br />
West Sta Ana<br />
Antipolo<br />
East Tabajin<br />
Nagbati<br />
Pandan<br />
Tagbanan<br />
West Tabajin<br />
Ambil<br />
Balagin<br />
East Vigo<br />
Nagtalon<br />
Tagbak<br />
West Vigo<br />
Cazador Pt.<br />
Ligaya North<br />
Ligaya South<br />
Mainit School<br />
Fuego Point<br />
Sunset cove<br />
Catmon<br />
Hugom<br />
Imelda<br />
Kalubkub/ Calubcub<br />
Laiya Aplaya<br />
Laiya Ibabao<br />
Puting Buhangin<br />
Tikalaan<br />
Bonito <strong>Island</strong><br />
Devil’s Pt.<br />
Malahibong Manok<br />
Oct-08<br />
May-07<br />
Oct-08<br />
Oct-08<br />
Oct-08<br />
Aug-08<br />
Aug-08<br />
Oct-08<br />
CI–Hilomen et al.<br />
CI–Menez and Cabansag<br />
CI–Menez et al.<br />
CI–Menez et al.<br />
CI–Hilomen et al.<br />
CI–Menez and Cabansag<br />
CI–Menez and Cabansag<br />
CI–Hilomen et al.<br />
Table 4. Percentage cover <strong>of</strong> living hard coral (LHC) per municipality in <strong>the</strong><br />
<strong>Verde</strong> <strong>Island</strong> <strong>Passage</strong>.<br />
Municipality Year Sites % LHC cover<br />
Batangas City<br />
Calatagan<br />
Looc<br />
Lubang<br />
Mabini<br />
Nasugbu<br />
San Juan<br />
Tingloy<br />
Mean<br />
2008<br />
2007<br />
2008<br />
2008<br />
2008<br />
2008<br />
2008<br />
2008<br />
City had <strong>the</strong> lowest percentage <strong>of</strong> live hard corals with<br />
only 12.9%. The municipalities <strong>of</strong> Calatagan, Lubang,<br />
San Juan, and Tingloy fell under <strong>the</strong> poor category<br />
with covers <strong>of</strong> 24.2%, 24.8%, 19.6%, and 19.2%<br />
respectively.<br />
4<br />
8<br />
6<br />
6<br />
3<br />
2<br />
8<br />
3<br />
12.9<br />
24.2<br />
29.4<br />
24.8<br />
33.8<br />
29.3<br />
19.6<br />
19.2<br />
24.2<br />
22
chapter 1 • vulnerability assessment <strong>of</strong> marine ecosystems and fisheries to climate change: sensitivity<br />
Seagrass<br />
Table 5 lists <strong>the</strong> number <strong>of</strong> species and species<br />
composition in areas around VIP where seagrass<br />
assessment reports were available for this study.<br />
Most <strong>of</strong> <strong>the</strong> seagrass areas included in this study<br />
have 8 species except for Puerto Galera which has<br />
10 species due to <strong>the</strong> presence <strong>of</strong> Halophila minor<br />
and H. spinulosa. In a study conducted by Tiquio and<br />
Cayabyab (2008) in Calatagan, <strong>the</strong>y reported that <strong>the</strong><br />
species diversity in this area is comparable with<br />
Cagayancillo, and Balabac, Palawan, however it is less<br />
extensive than those areas studied in Palawan. In terms<br />
<strong>of</strong> abundance, <strong>the</strong>y reported that Calatagan seagrass<br />
meadows are less dense than Cagayancillo but denser<br />
than Tubbataha and Balabac.<br />
In an assessment conducted in Lubang <strong>Island</strong>s,<br />
Occidental Mindoro (Genito et al. 2009), results<br />
showed that <strong>the</strong> percentage seagrass cover in <strong>the</strong>se<br />
areas ranged from low to moderate with 46% <strong>of</strong> <strong>the</strong><br />
surveyed sites showing moderate cover, but mostly on<br />
<strong>the</strong> low-end values <strong>of</strong> <strong>the</strong> range. Thalassia hemprichii<br />
and Cymodocea rotundata were noted in almost<br />
Table 5. Number <strong>of</strong> species and species composition in Lian and<br />
Calatagan, Batangas; Puerto Galera, Oriental Mindoro; and Lubang,<br />
Occidental Mindoro.<br />
Municipality No. <strong>of</strong> species Species composition<br />
Batangas<br />
Lian<br />
Batangas<br />
Calatagan<br />
Oriental Mindoro<br />
Puerto Galera<br />
Occidental Mindoro<br />
Lubang<br />
8<br />
8<br />
10<br />
8<br />
Ea, Th, Cr, Cs, Hp, Hu, Ho, Si<br />
(Talim Bay CRM Plan)<br />
Ea, Th, Cr, Cs, Hp, Hu, Ho, Si<br />
(Tiquio and Cayabyab, 2008)<br />
Ea, Th, Cr, Cs, Hp, Hu, Hm, Ho,<br />
Hs, Si (Fortes, 1997)<br />
Ea, Th, Cr, Cs, Hp, Hu, Ho, Si<br />
(Genito et al, 2009)<br />
all <strong>of</strong> <strong>the</strong> sites surveyed. According to this report,<br />
<strong>the</strong> multispecies meadows in <strong>the</strong>se islands were<br />
comparable with areas in Palawan and Guimaras.<br />
Most <strong>of</strong> <strong>the</strong> seagrass meadows that surround <strong>the</strong><br />
VIP are in constant threat from overexploitation <strong>of</strong> its<br />
associated organisms (i.e., sea cucumber, sea urchin),<br />
coastal developments (i.e., resort establishment) and<br />
even mangrove afforestation (i.e., Calatagan).<br />
Mangrove<br />
The total area <strong>of</strong> mangrove forests surrounding <strong>the</strong><br />
VIP in Batangas and Oriental Mindoro is 1,494.16<br />
ha, 716.16 ha in Batangas, and 778 ha in Oriental<br />
Mindoro. Most <strong>of</strong> <strong>the</strong>se mangrove areas are <strong>of</strong> <strong>the</strong><br />
riverine and fringing types dominated by species <strong>of</strong><br />
Rhizophora and Avicennia. However, most <strong>of</strong> <strong>the</strong>se<br />
mangrove areas are near coastal communities and<br />
are being affected by anthropogenic activities such<br />
as conversion to fishponds, and resort and port<br />
establishment.<br />
Table 6 and Figure 34 present a summary <strong>of</strong> available<br />
information on <strong>the</strong> condition <strong>of</strong> mangrove forests in<br />
<strong>the</strong> provinces <strong>of</strong> Batangas and Oriental Mindoro. The<br />
only information available for analysis were <strong>the</strong> type <strong>of</strong><br />
mangrove forest and substrate, areal extent, dominant<br />
species and issues and problems affecting <strong>the</strong>se<br />
mangrove areas. No available information on <strong>the</strong> density<br />
and o<strong>the</strong>r parameters that will characterize <strong>the</strong> present<br />
mangrove cover in <strong>the</strong>se areas were accessible at <strong>the</strong><br />
time <strong>of</strong> data collection.<br />
Ea–Enhalus acoroides, Th–Thalassia hemprichii, Cr–Cymodocea rotundata, Cs–Cymodocea serrulata,<br />
Hp–Halodule pinifolia, Hu–Halodule uninervis, Hm–Halophila minor, Ho–Halophila ovalis,<br />
Hs–Halophila spinulosa, Si–Syringodium isoetifolium<br />
Table 6. Available information on <strong>the</strong> status <strong>of</strong> mangrove forests in Batangas and Oriental Mindoro.<br />
Province/ Type <strong>of</strong> Type <strong>of</strong> Area<br />
municipality mangrove forest substrate (ha) Issues and concerns<br />
Batangas<br />
Balayan<br />
Batangas City<br />
Calatagan<br />
Lian<br />
San Juan<br />
Oriental Mindoro<br />
Calapan City<br />
Naujan<br />
Baco<br />
Pola<br />
fringing/riverine<br />
fringing/riverine<br />
fringing<br />
fringing/riverine<br />
fringing/riverine<br />
riverine/fringing<br />
riverine/fringing<br />
fringing/riverine<br />
no data<br />
sandy/clay loam<br />
sandy/clay loam/muddy<br />
coralline/stony/rocky/muddy<br />
sandy/clay loam<br />
coralline/sandy/clay loam/muddy<br />
sandy/clay loam/muddy<br />
sandy/clay loam/muddy<br />
sandy/clay loam/muddy<br />
no data<br />
19.09<br />
23.64<br />
244.98<br />
79.99<br />
348.46<br />
332.00<br />
165.00<br />
134.00<br />
147.00<br />
• conversion to fishponds; establishment <strong>of</strong> resorts; presence <strong>of</strong> coastal<br />
communities; illegal cutting<br />
• development <strong>of</strong> industries and ports; presence <strong>of</strong> coastal communities;<br />
conversion to fishponds<br />
• conversion to fishponds and saltbeds; establishment <strong>of</strong> resorts; presence <strong>of</strong><br />
coastal communities; illegal cutting; existing tenurial instruments<br />
• conversion to fishponds; presence <strong>of</strong> coastal communities; illegal cutting<br />
• conversion to fishponds; presence <strong>of</strong> coastal communities; illegal cutting;<br />
gleaning activities<br />
• presence <strong>of</strong> coastal communities; conversion to fishponds; presence <strong>of</strong><br />
piggeries; illegal cutting<br />
• presence <strong>of</strong> coastal communities; conversion to fishponds; illegal cutting<br />
• presence <strong>of</strong> coastal communities/ conversion to fishponds; illegal cutting<br />
• illegal cutting; conversion to o<strong>the</strong>r uses<br />
23
climate change vulnerability assessment <strong>of</strong> <strong>the</strong> verde island passage, philippines<br />
Figure 34. Dominant species present in mangrove areas included in this study<br />
along <strong>the</strong> VIP (Af- Aegiceras floridum, Am- Avicennia marina, Ao- A. <strong>of</strong>ficinalis,<br />
Nf- Nypa fruticans, Ra- Rhizophora apiculata, Rm- R. mucronata, Rs- R. stylosa,<br />
Sa- Sonneratia alba, Sc- Sonneratia caseolaris).<br />
Method <strong>of</strong> assessing sensitivity<br />
Coral<br />
Percentage <strong>of</strong> live hard coral cover and number<br />
<strong>of</strong> observed coral genera <strong>of</strong> each survey site per<br />
municipality were collated for <strong>the</strong> analysis. Percentage<br />
<strong>of</strong> live coral cover per municipality was calculated by<br />
getting <strong>the</strong> average <strong>of</strong> <strong>the</strong> percentage coral cover<br />
<strong>of</strong> all <strong>the</strong> reefs surveyed in that municipality. The<br />
number <strong>of</strong> genera was determined based on what was<br />
encountered along <strong>the</strong> survey transects in each <strong>of</strong> <strong>the</strong>se<br />
towns. Total number <strong>of</strong> genera was obtained by pooling<br />
all <strong>the</strong> occurrences <strong>of</strong> <strong>the</strong> coral genera per municipality.<br />
Dominant genera were based on <strong>the</strong> occurrences <strong>of</strong><br />
<strong>the</strong> coral genera per site in each municipality. Very little<br />
species level data is available for almost all reefs in<br />
<strong>the</strong> <strong>Philippines</strong>. The authors also had to rely on reports<br />
(some <strong>of</strong> which were still unfinished at <strong>the</strong> time this<br />
analysis was made) and thus were in no position to<br />
assess <strong>the</strong> relative importance <strong>of</strong> <strong>the</strong> o<strong>the</strong>r factors such<br />
as proximity to human settlements and activities that<br />
might be relevance to <strong>the</strong> sensitivity <strong>of</strong> particular coral<br />
communities to climate change.<br />
A total <strong>of</strong> 61 coral genera were observed along <strong>the</strong><br />
survey transects during <strong>the</strong> assessments (Table 7).<br />
The municipality <strong>of</strong> Mabini had <strong>the</strong> highest number<br />
<strong>of</strong> observed coral genera, with 45 genera present.<br />
Nasugbu municipality on <strong>the</strong> o<strong>the</strong>r hand, had <strong>the</strong> lowest<br />
number <strong>of</strong> observed coral genera with only 28 genera<br />
noted. Around 39 to 44 coral genera were observed<br />
in <strong>the</strong> remaining municipalities <strong>of</strong> Batangas City,<br />
Calatagan, Looc, Lubang, San Juan, and Tingloy. The<br />
reefs assessed were mostly dominated with <strong>the</strong> coral<br />
Porites sp., followed by Acropora<br />
sp., Diploastrea heliopora, Montipora<br />
sp., Goniastrea sp., Echinopora sp.,<br />
Pocillopora sp., and Seriatopora sp.<br />
In <strong>the</strong> subsequent analyses, <strong>the</strong><br />
above data on generic composition<br />
was only considered in <strong>the</strong><br />
assessing <strong>the</strong> impact <strong>of</strong> sea surface<br />
temperature increase on coral cover.<br />
Hence, <strong>the</strong> projections on cover<br />
loss due to storms and sea level rise<br />
assumed coral genera were equally<br />
sensitive to <strong>the</strong>se factors since<br />
no “dose”-response function was<br />
available for coral communities.<br />
Impacts <strong>of</strong> climate change (e.g.,<br />
temperature increases, sea-level rise,<br />
storminess) on coral diversity were<br />
analyzed in two stages, beginning<br />
with <strong>the</strong> estimation <strong>of</strong> coral cover<br />
loss described earlier. The inverted<br />
species-area curve based on <strong>the</strong> Calamianes study by<br />
Veron and Fenner (2000) was <strong>the</strong>n used to estimate<br />
<strong>the</strong> loss <strong>of</strong> coral diversity from <strong>the</strong> projected coral cover<br />
(=area <strong>of</strong> habitat) loss (Figure 35). This species-area<br />
diversity loss (%)<br />
Table 7. Total number <strong>of</strong> coral genera observed per municipality in <strong>the</strong><br />
<strong>Verde</strong> <strong>Island</strong> <strong>Passage</strong>.<br />
Municipality Sites # genera Dominent genera<br />
Batangas City<br />
Calatagan<br />
Looc<br />
Lubang<br />
Mabini<br />
Nasugbu<br />
San Juan<br />
Tingloy<br />
100<br />
90<br />
80<br />
70<br />
60<br />
50<br />
40<br />
30<br />
20<br />
10<br />
4<br />
8<br />
6<br />
6<br />
3<br />
2<br />
8<br />
3<br />
39<br />
44<br />
41<br />
39<br />
45<br />
28<br />
42<br />
41<br />
Porites<br />
Porites, Diploastrea, Galaxea<br />
Porites, Acropora, Montipora, Echinopora<br />
Porites, Acropora, Seriatopora<br />
Porites, Acropora, Montipora<br />
Porites<br />
Porites, Diploastrea, Goniastrea<br />
Acropora, Pocillopora, Porites<br />
y = 0.0066e 4.5855x<br />
R 2 = 0.9585<br />
0<br />
0 10 20 30 40 50 60 70 80 90 100<br />
area loss (%)<br />
Figure 35. Inverted species-area curve based on <strong>the</strong><br />
Calamianes (Veron and Fenner 2000). Coral diversity loss<br />
was determined by calculating <strong>the</strong> y-value using <strong>the</strong> formula<br />
shown above.<br />
24
chapter 1 • vulnerability assessment <strong>of</strong> marine ecosystems and fisheries to climate change: sensitivity<br />
curve was used since it is <strong>the</strong> only published account<br />
available for <strong>the</strong> <strong>Philippines</strong>. However, <strong>the</strong> estimates<br />
computed from <strong>the</strong>se are considered conservative<br />
because <strong>the</strong> Veron and Fenner’s curve is based<br />
on beta/between-reef diversity while <strong>the</strong> current<br />
application is seeks to estimate changes in alpha/<br />
within-reef diversity. The latter is typically much higher<br />
locally.<br />
Coral diversity loss due to sea surface temperature<br />
increase was estimated by obtaining <strong>the</strong> percentage <strong>of</strong><br />
coral genera that will be lost by removing <strong>the</strong> <strong>the</strong>rmally<br />
sensitive coral genera listed in Pratchett et al. (2008)<br />
(Table 8). Lower range estimates were obtained by<br />
removing <strong>the</strong> top 10 most vulnerable genera from <strong>the</strong><br />
total genera present per municipality. Whereas, higher<br />
range estimates were calculated by removing all <strong>the</strong><br />
vulnerable coral genera based on <strong>the</strong> list to <strong>the</strong> total<br />
genera present in each municipality. This decision is<br />
arbitrary since, again, no dose-response curve for coral<br />
communities and bleaching is available and thus we<br />
based <strong>the</strong> cut-<strong>of</strong>f on observations <strong>of</strong> vulnerable taxa<br />
made in western Batangas during <strong>the</strong> 1998 bleaching<br />
event, apparently <strong>the</strong> worst one for <strong>the</strong> VIP (Arceo et<br />
al. 2001). The estimates based on projected cover<br />
loss and <strong>the</strong> species-area curve served as <strong>the</strong> lower<br />
range estimates <strong>of</strong> diversity loss, whereas <strong>the</strong> direct<br />
vulnerabilities served as <strong>the</strong> higher range estimates.<br />
Table 8. Coral genera <strong>the</strong>rmally sensitive to bleaching events.<br />
Acropora sp.<br />
Stylophora sp.<br />
Mycedium sp.<br />
Isopora sp.<br />
Montastrea sp.<br />
Hydnophora sp.<br />
Coeloseris sp.<br />
Cyphastrea sp.<br />
Pocillopora sp.<br />
Montipora sp.<br />
Source: Pratchett et al. 2008.<br />
Leptoria sp.<br />
Echinophyllia sp.<br />
Lobophyllia sp.<br />
Acanthastrea sp.<br />
Goniopora sp.<br />
Pectinia sp.<br />
Galaxea sp.<br />
Goniastrea sp.<br />
Seriatopora sp.<br />
Porites sp.<br />
Favia sp.<br />
Echinopora sp.<br />
Favites sp.<br />
Pavona sp.<br />
Merulina sp.<br />
Turbinaria sp.<br />
Astreopora sp.<br />
The assumptions <strong>of</strong> Pratchett et al. (2008) were based<br />
on <strong>the</strong> numerous studies on <strong>the</strong> hierarchy <strong>of</strong> bleaching<br />
susceptibilities <strong>of</strong> coral genera. Impacts <strong>of</strong> climateinduced<br />
coral bleaching are less selective compared<br />
to increased storminess and Acanthaster planci outbreaks.<br />
Thermal sensitivities <strong>of</strong> coral genera have<br />
been attributed to physiological and morphological<br />
attributes such as colony integration, tissue thickness<br />
and sensitivities <strong>of</strong> symbiotic zooxan<strong>the</strong>llae. Moreover,<br />
differences in depth and habitats, history <strong>of</strong> <strong>the</strong>rmal<br />
stresses and hydrodynamics also play crucial roles in<br />
coral bleaching susceptibility.<br />
Seagrass and mangrove<br />
The sensitivity assessment <strong>of</strong> mangrove and seagrass<br />
areas surrounding <strong>the</strong> VIP was conducted using<br />
available secondary information from municipal<br />
and provincial agriculture <strong>of</strong>fices, coastal resource<br />
management plans and assessment reports from<br />
various institutions. Using <strong>the</strong> most relevant information,<br />
<strong>the</strong> status and sensitivity <strong>of</strong> mangroves and seagrasses<br />
to climate change were assessed based on likely<br />
response to <strong>the</strong> climate change component that will<br />
have greatest impact on <strong>the</strong>se ecosystems. In particular,<br />
mangroves’ sensitivity to increasing sea level rise was<br />
assessed based on <strong>the</strong> effects <strong>of</strong> flooding and <strong>the</strong> most<br />
available areas for recruitment and settlement. The<br />
vulnerability <strong>of</strong> <strong>the</strong>se areas was assessed using McLeod<br />
and Salm (2006) vulnerability conditions (Table 9).<br />
Seagrass’ sensitivity and vulnerability to increasing sea<br />
surface temperature and storm frequency and intensity<br />
were assessed using information from Campbell et al.<br />
(2006), Duarte et al. (1997), and Terrados et al. (1998).<br />
In particular, seagrass response to <strong>the</strong>rmal stress,<br />
sediment perturbation, and eutrophication were given<br />
emphasis to assess <strong>the</strong> vulnerability <strong>of</strong> this ecosystem<br />
to climate change. However, since <strong>the</strong> available data<br />
did not include information on <strong>the</strong> zonation <strong>of</strong> species<br />
within a meadow, <strong>the</strong> sensitivity assessment was<br />
species-specific.<br />
25
climate change vulnerability assessment <strong>of</strong> <strong>the</strong> verde island passage, philippines<br />
Table 9. An assessment <strong>of</strong> mangrove vulnerability to sea-level rise based on environmental conditions.<br />
Vulnerability Local conditions Explanation<br />
Most<br />
vulnerable<br />
Least<br />
vulnerable<br />
low relief islands<br />
lack <strong>of</strong> rivers<br />
carbonate settings<br />
areas subsiding due to tectonic<br />
movements, groundwater extraction, or<br />
underground mining<br />
micro-tidal sediment-starved environments<br />
(small Caribbean islands) (Ellison 1993)<br />
mangroves blocked by coastal development<br />
or steep topography<br />
mangroves in deep sediment on high<br />
islands<br />
riverine mangroves<br />
macro-tidal sediment rich environments<br />
(mangroves in nor<strong>the</strong>rn Australia)<br />
mangroves with room to move landward<br />
(backed by low-lying areas, salt flats,<br />
undeveloped areas)<br />
mangroves in remote areas<br />
mangroves surrounded by flourishing dense<br />
mangrove forests<br />
• low rates <strong>of</strong> sediment and peat accretion, particularly vulnerable to sea-level rise because <strong>the</strong>y are subject to drought<br />
and wave erosion<br />
• expected to experience increased flooding, inundation and salinization <strong>of</strong> soils and freshwater (Shea et al. 2001)<br />
• lack <strong>of</strong> sediment and freshwater<br />
• <strong>of</strong>ten associated with atolls and islands, where landward migration to escape sea-level rise may not be possible<br />
• sediments are mostly locally derived<br />
• will experience higher sea-level rise and inundation<br />
• lack <strong>of</strong> sediment will lead to decreased geographic distribution and species diversity <strong>of</strong> mangroves (Houghton et al.<br />
2001)<br />
• unable to move inland when sea level rises<br />
• structurally stronger than mangroves in shallow sediment on low islands (Gillison 1980) and less vulnerable to storm<br />
surges than low islands (UNEP 1994)<br />
• high islands will be better adapted to survive predicted climate changes due to <strong>the</strong>ir larger surface areas, freshwater<br />
availability, better soils, and more diverse resources (Shea et al. 2001)<br />
• receive large amounts <strong>of</strong> sediment from o<strong>the</strong>r areas (Woodr<strong>of</strong>fe and Grindrod 1991)<br />
• most productive mangrove habitats due to high nutrient concentrations associated with sediment trapping (Ewel et al.<br />
1998)<br />
• access to sediment and strong tidal currents to redistribute sediment (Woodr<strong>of</strong>fe and Grindrod 1991)<br />
• have <strong>the</strong> opportunity to expand inland when sea level rises<br />
• have limited anthropogenic stresses and not blocked by coastal communities from moving landward<br />
• have steady supply <strong>of</strong> propagules and seeds<br />
Source: McLeod and Salm 2006.<br />
Sea surface temperature impact<br />
Coral<br />
Increasing sea surface temperatures have been<br />
documented as a cause <strong>of</strong> coral bleaching. Seasurface<br />
temperature (SST) vulnerability estimates <strong>of</strong><br />
coral communities were computed by subtracting <strong>the</strong><br />
percentage covers <strong>of</strong> <strong>the</strong> taxa that are susceptible<br />
to temperature increases. Lower range estimates<br />
were calculated by removing <strong>the</strong> percentage cover<br />
<strong>of</strong> Acropora sp., whereas <strong>the</strong> higher range estimates<br />
were calculated by removing <strong>the</strong> percentage cover<br />
<strong>of</strong> Acropora sp. and pocilloporids (Pocillopora sp.,<br />
Seriatopora sp,. and Stylophora sp.). Acroporids and<br />
pocilloporids are deemed to be <strong>the</strong> most <strong>the</strong>rmally<br />
sensitive due to <strong>the</strong> low <strong>the</strong>rmal thresholds <strong>of</strong> <strong>the</strong>se<br />
families, <strong>the</strong>ir symbionts, and o<strong>the</strong>r factors. There have<br />
also been observations <strong>of</strong> high mortalities in Lian,<br />
Batangas where <strong>the</strong> first coral bleaching cases in <strong>the</strong><br />
1998 bleaching (<strong>the</strong> worse one on record) where first<br />
observed (Arceo et al. 2001) and is <strong>the</strong> only place<br />
where it has been studied in <strong>the</strong> entire VIP region.<br />
Although analyses <strong>of</strong> past <strong>the</strong>rmal events suggest<br />
this part <strong>of</strong> <strong>the</strong> VIP is more prone to temperature<br />
fluctuations, <strong>the</strong> response <strong>of</strong> acroporids and<br />
pocilloporids were similar in o<strong>the</strong>r parts <strong>of</strong> <strong>the</strong> country<br />
(Arceo et al. 2001).<br />
Analysis showed that <strong>the</strong> percentage loss <strong>of</strong> live<br />
hard coral cover ranged from 3% to 22% across <strong>the</strong><br />
<strong>Verde</strong> <strong>Island</strong> <strong>Passage</strong>. The sites deemed to be highly<br />
vulnerable are those with high cover <strong>of</strong> <strong>the</strong> taxa listed<br />
above. Sites with minimal losses are mostly dominated<br />
by <strong>the</strong> coral Porites sp. As such, <strong>the</strong> municipalities<br />
<strong>of</strong> Mabini and Tingloy have <strong>the</strong> highest vulnerability<br />
with percentage loss <strong>of</strong> 11% to 22% and 14% to<br />
21% respectively. The municipality <strong>of</strong> Lubang had an<br />
estimated loss 8% to 15% (Table 10).<br />
Table 10. Percentage (%) cover and percentage loss <strong>of</strong> coral cover during<br />
elevated sea surface temperatures (SST) in <strong>the</strong> eight municipalities<br />
surveyed in <strong>the</strong> <strong>Verde</strong> <strong>Island</strong> <strong>Passage</strong>.<br />
% living hard coral<br />
before<br />
Cover<br />
Municipality Sites bleaching low high loss (%)<br />
Batangas City<br />
Calatagan<br />
Looc<br />
Lubang<br />
Mabini<br />
Nasugbu<br />
San Juan<br />
Tingloy<br />
4<br />
8<br />
6<br />
6<br />
3<br />
2<br />
8<br />
3<br />
12.9<br />
24.2<br />
29.4<br />
24.8<br />
33.8<br />
29.3<br />
19.6<br />
19.2<br />
12.2<br />
23.5<br />
28.0<br />
22.8<br />
29.9<br />
27.6<br />
19.0<br />
16.5<br />
11.6<br />
22.3<br />
26.8<br />
21.2<br />
26.4<br />
26.8<br />
18.5<br />
15.1<br />
6-10<br />
3-8<br />
5-9<br />
8-15<br />
11-22<br />
6-9<br />
3-6<br />
14-21<br />
Seagrass<br />
Campbell et al. in 2006 studied <strong>the</strong> acute<br />
photosyn<strong>the</strong>tic response <strong>of</strong> 7 tropical species <strong>of</strong><br />
seagrasses to <strong>the</strong>rmal stress and <strong>the</strong>ir ability to<br />
recover from this stress. As mentioned in this article,<br />
temperatures rising above <strong>the</strong> tolerable limit <strong>of</strong> 35°C<br />
inhibit plants' ability to produce carbon and bring about<br />
increased respiration and breakdown <strong>of</strong> photosyn<strong>the</strong>tic<br />
enzymes. Although tropical species <strong>of</strong> seagrasses<br />
may have adopted to high temperature as some <strong>of</strong> <strong>the</strong><br />
26
chapter 1 • vulnerability assessment <strong>of</strong> marine ecosystems and fisheries to climate change: sensitivity<br />
meadows are more exposed to extreme temperatures<br />
than meadows in temperate region, <strong>the</strong> photosyn<strong>the</strong>tic<br />
responses <strong>of</strong> most seagrass species (as shown in this<br />
article)may likely suffer from short term or episodic<br />
exposure to seawater temperature ranging from 40<br />
to 45°C. Of <strong>the</strong> species studied by Campbell et al.<br />
(2006), Cymodocea rotundata, C. serrulata, Halodule<br />
uninervis, and Thalassia hemprichii were more tolerant<br />
to <strong>the</strong>rmal stress than o<strong>the</strong>r species. Using this study<br />
to determine <strong>the</strong> sensitivity <strong>of</strong> seagrasses in areas that<br />
surround VIP to increasing SST, <strong>the</strong> four areas included<br />
in this report may be least sensitive to increase in SST<br />
due to <strong>the</strong> presence <strong>of</strong> species which are tolerant to<br />
<strong>the</strong>rmal stress (Table 5), however, this projection may<br />
fur<strong>the</strong>r be refined when available data on seagrass<br />
densities and zonation <strong>of</strong> species will be considered.<br />
Of <strong>the</strong> two habitats assessed to be sensitive to<br />
increase in temperature, corals are deemed more<br />
sensitive. Indeed globally, documentations <strong>of</strong> positive<br />
sea surface temperature (SST) anomalies have been<br />
associated with mass coral bleaching, mortality<br />
(Hoegh-Guldberg 1999, Wilkinson 2004), and coral<br />
disease outbreak (Bruno et al. 2007).<br />
Storm impact<br />
Coral<br />
Analysis <strong>of</strong> <strong>the</strong> impacts <strong>of</strong> typhoons was based on <strong>the</strong><br />
study by Licuanan (unpublished report) in Pagbilao,<br />
Quezon. Based on <strong>the</strong> monitoring <strong>of</strong> reefs in Pagbilao,<br />
Quezon (just to <strong>the</strong> east <strong>of</strong> <strong>the</strong> VIP) estimated coral<br />
cover losses during tropical storm Caloy was 12.5%<br />
for sheltered sites and 37.5% for exposed sites. These<br />
estimates were <strong>the</strong>n used to calculate <strong>the</strong> change <strong>of</strong> <strong>the</strong><br />
percentage coral cover during low to severe impacts<br />
since no function relating storm strength and cover<br />
loss is available. Coral cover in Quezon is comparable<br />
to <strong>the</strong> sites in <strong>the</strong> VIP, as are <strong>the</strong> reefs—which are<br />
generally narrow fringing type. Both areas are within <strong>the</strong><br />
<strong>Philippines</strong>’ typhoon belt.<br />
Table 11 presents <strong>the</strong> changes in percentage covers <strong>of</strong><br />
live hard corals when a typhoon similar to Caloy passed<br />
by <strong>the</strong> VIP. The municipalities <strong>of</strong> Mabini, Looc, and<br />
Table 11. Estimated percentage (%) cover <strong>of</strong> live hard corals during low to<br />
severe impacts <strong>of</strong> typhoons.<br />
% living hard coral<br />
before low severe<br />
Municipality Sites impact impact impact<br />
Batangas City<br />
Calatagan<br />
Looc<br />
Lubang<br />
Mabini<br />
Nasugbu<br />
San Juan<br />
Tingloy<br />
All municipalities<br />
4<br />
8<br />
6<br />
6<br />
3<br />
2<br />
8<br />
3<br />
12.9<br />
24.2<br />
29.4<br />
24.8<br />
33.8<br />
29.3<br />
19.6<br />
19.2<br />
24.2<br />
11.3<br />
21.2<br />
25.7<br />
21.7<br />
29.5<br />
25.6<br />
17.2<br />
16.8<br />
21.2<br />
8.1<br />
15.1<br />
18.4<br />
15.5<br />
21.1<br />
18.3<br />
12.3<br />
12.0<br />
15.2<br />
Nasugbu coral covers will remain in <strong>the</strong> fair category<br />
if <strong>the</strong> effect <strong>of</strong> <strong>the</strong> storm is low. However, if <strong>the</strong> impact<br />
is severe <strong>the</strong> status <strong>of</strong> <strong>the</strong> coral communities in <strong>the</strong>se<br />
municipalities will become poor. Five out <strong>of</strong> <strong>the</strong> eight <strong>the</strong><br />
municipalities’ surveyed have poor coral covers, <strong>the</strong>reby<br />
increasing <strong>the</strong>ir vulnerability in <strong>the</strong> event <strong>of</strong> a severe<br />
impact. Batangas City for example after severe impact<br />
will have <strong>the</strong> lowest coral cover <strong>of</strong> 8.1% from 12.9%.<br />
Note that Caloy was merely a tropical storm and not <strong>of</strong><br />
typhoon strength. Hence projected losses stated here<br />
are considered conservative.<br />
Seagrass<br />
Increase in storm intensity and frequency will likely<br />
cause changes in sediment morphology and dynamics<br />
as well as salinity levels in seagrass meadows.<br />
Sediment perturbation caused by strong typhoons<br />
increases mortality <strong>of</strong> seagrasses due to uprooting,<br />
dislocation and burial <strong>of</strong> seagrass modules.<br />
Of <strong>the</strong> tropical species, Enhalus acoroides is <strong>the</strong><br />
most resistant to sediment perturbation, followed by<br />
Halophila ovalis, Halodule uninervis, Cymodocea<br />
serrulata, Thalassia hemprichii, Cymodocea rotundata,<br />
and Syringodium isoetifolium (Duarte et al. 1997,<br />
Terrados et al. 1998).<br />
The four sites in <strong>the</strong> VIP with known seagrass<br />
distribution are analyzed to have low sensitivity to<br />
sediment perturbation caused by an increase in storm<br />
intensity and frequency. The projection may be different<br />
if analysis will include eutrophication caused by influx<br />
<strong>of</strong> freshwater from increased storm/rainfall frequency.<br />
As observed in a lot <strong>of</strong> areas around <strong>the</strong> <strong>Philippines</strong>,<br />
seagrasses are overgrown by algae when <strong>the</strong> flow<br />
<strong>of</strong> water is impeded or when <strong>the</strong>re is an increase in<br />
freshwater input.<br />
Sea level rise impact<br />
Coral<br />
For <strong>the</strong> effects <strong>of</strong> sea level rise (SLR), area loss was<br />
computed using <strong>the</strong> following formula:<br />
% area loss<br />
(a´/sinA) - (a/sinA)<br />
a/sinA<br />
x 100<br />
Wherein, a is <strong>the</strong> maximum depth <strong>of</strong> <strong>the</strong> reef community<br />
before sea level rise; a´ is <strong>the</strong> maximum depth <strong>of</strong> <strong>the</strong><br />
reef community after sea level rise; and, A is <strong>the</strong> angle<br />
<strong>of</strong> <strong>the</strong> reef slope. The angle <strong>of</strong> <strong>the</strong> reef slope was<br />
measured as <strong>the</strong> elevation from <strong>the</strong> horizontal.<br />
This formula, however, only applies to deep coral<br />
communities along <strong>the</strong> reef slope. It is assumed that<br />
in <strong>the</strong> event <strong>of</strong> sea level rise, <strong>the</strong> coral communities<br />
located at <strong>the</strong> bottom <strong>of</strong> <strong>the</strong> reef slope will drown even<br />
27
climate change vulnerability assessment <strong>of</strong> <strong>the</strong> verde island passage, philippines<br />
if factors o<strong>the</strong>r than depth may control <strong>the</strong> lower extent<br />
<strong>of</strong> reefs in particular sites (note that <strong>the</strong> entire study is<br />
based on secondary data aggregated to <strong>the</strong> town level).<br />
Coral reefs in <strong>the</strong> <strong>Philippines</strong> are generally shallower<br />
around high islands such as Luzon and Mindanao<br />
where water clarity is also lower mostly due to human<br />
activities on land. Exceptions are <strong>the</strong> sparsely populated<br />
areas facing <strong>the</strong> Pacific Ocean.<br />
Table 12 presents <strong>the</strong> estimated area following sea<br />
level rise. Reef area loss for <strong>the</strong> VIP ranges from<br />
0.38% to 7%. Note that <strong>the</strong>se only apply to <strong>the</strong> deepest<br />
portion <strong>of</strong> <strong>the</strong> reef slope. Specifically, Batangas City<br />
and Nasugbu are highly vulnerable and have estimated<br />
0.38% to 7% area loss. Whereas, <strong>the</strong> rest <strong>of</strong> <strong>the</strong><br />
municipalities surveyed are still vulnerable but have<br />
lower estimates <strong>of</strong> 0.25% to 4% area loss.<br />
Table 12. Estimated area and diversity losses in <strong>the</strong> event <strong>of</strong> sea level<br />
rise. Area loss estimates were based on <strong>the</strong> 5 cm (low) and 88 cm (high)<br />
sea level rise scenarios. Diversity loss was computed using <strong>the</strong> species<br />
area curve.<br />
% area % diversity<br />
Municipality loss loss<br />
Batangas City<br />
Calatagan<br />
Looc<br />
Lubang<br />
Mabini<br />
Nasugbu<br />
San Juan<br />
Tingloy<br />
0.38-7<br />
0.25-4<br />
0.25-4<br />
0.25-4<br />
0.25-4<br />
0.38-7<br />
0.25-4<br />
0.25-4<br />
0.60-0.80<br />
0.60-0.70<br />
0.60-0.70<br />
0.60-0.70<br />
0.60-0.70<br />
0.60-0.80<br />
0.60-0.70<br />
0.60-0.70<br />
Mangrove<br />
Table 13 presents <strong>the</strong> vulnerability assessment <strong>of</strong><br />
mangrove areas along <strong>the</strong> VIP, <strong>the</strong> study is delimited<br />
with <strong>the</strong> availability <strong>of</strong> information on mangroves in<br />
<strong>the</strong>se areas. The 1 mm per year accretion rate observed<br />
by Fujimoto et al. (1995) in Abatan River, Bohol was<br />
used as <strong>the</strong>re is no o<strong>the</strong>r available information on rates<br />
<strong>of</strong> accretion in o<strong>the</strong>r parts <strong>of</strong> <strong>the</strong> country.<br />
If sensitivity assessment will be based on <strong>the</strong> areal<br />
extent <strong>of</strong> potential mangrove areas and <strong>the</strong> projected 1,<br />
2- and 3-m rise in sea level (Siringan et al., this report),<br />
almost all areas included in this report will be inundated<br />
with 1-m rise in sea level except for <strong>the</strong> municipalities <strong>of</strong><br />
San Juan, Batangas and Calapan City, Oriental Mindoro<br />
(Figure 36). For Batangas province, <strong>the</strong> mangrove<br />
forests in San Juan will be <strong>the</strong> least vulnerable, followed<br />
by Calatagan, Lian, Nasugbu. For Oriental Mindoro,<br />
Calapan City will be <strong>the</strong> least vulnerable, followed by<br />
Naujan, Pola, and Baco. However as stated earlier<br />
most <strong>of</strong> <strong>the</strong>se mangrove areas have been converted<br />
to fishponds, resorts and o<strong>the</strong>r land uses and are near<br />
coastal communities, hence progression landward may<br />
be hindered.<br />
Balayan and Batangas City were seen as <strong>the</strong> most<br />
vulnerable mangrove areas due to its small size in<br />
terms <strong>of</strong> area covered and <strong>the</strong> presence <strong>of</strong> coastal<br />
developments (fishponds, ports, industries) which may<br />
be a barrier to <strong>the</strong> settlement and growth <strong>of</strong> mangroves.<br />
The dikes <strong>of</strong> active and abandoned fishponds for<br />
example, would impede <strong>the</strong> settlement <strong>of</strong> seeds and<br />
propagules to <strong>the</strong>se ponds and <strong>the</strong> normal hydrology<br />
in <strong>the</strong> area that could promote growth <strong>of</strong> mangroves is<br />
also altered. With all <strong>the</strong>se barriers, even if <strong>the</strong>re will be<br />
a 1mm per year accretion rate, <strong>of</strong>fsetting <strong>the</strong> impact <strong>of</strong><br />
sea level rise may be difficult unless some measures<br />
are made to relieve <strong>the</strong> stress. An example would be<br />
<strong>the</strong> restoration <strong>of</strong> abandoned fishponds into its natural<br />
mangrove forest. A number <strong>of</strong> publications have already<br />
laid down protocols and steps on restoration <strong>of</strong> ponds<br />
into mangrove forests (i.e., Lewis and Marshall 1997,<br />
Stevenson et al. 1999, Samson and Rollon 2008,<br />
Primavera and Esteban 2008, Lewis 2009).<br />
Table 13. Vulnerability <strong>of</strong> mangrove areas along <strong>the</strong> <strong>Verde</strong> <strong>Island</strong> <strong>Passage</strong> to projected sea level rise (SLR) and rate <strong>of</strong> accretion.<br />
Area (ha) to be inundated Dominant Degree <strong>of</strong> vulnerability<br />
given a 50-year SLR projection Mangrove mangrove given 1mm/year<br />
Municipality 1-m 2-m 3-m area (ha) species1 Issues affecting mangrove area accretion rate2<br />
Nasugbu<br />
Calatagan<br />
Balayan<br />
Lemery<br />
Batangas<br />
Lobo<br />
Abra de Ilog<br />
Calapan<br />
Naujan<br />
Lubang<br />
Boac<br />
64.26<br />
235.8<br />
165.06<br />
101.88<br />
92.97<br />
20.88<br />
34.56<br />
69.66<br />
90.63<br />
426.51<br />
45.81<br />
366.84<br />
369.72<br />
439.92<br />
222.48<br />
137.52<br />
36.36<br />
77.58<br />
160.65<br />
182.97<br />
701.91<br />
92.52<br />
848.97<br />
765.45<br />
761.85<br />
427.95<br />
307.26<br />
70.65<br />
191.88<br />
511.92<br />
446.58<br />
1096.38<br />
199.98<br />
no data<br />
244.98<br />
19.09<br />
no data<br />
23.64<br />
no data<br />
no data<br />
332.0<br />
165.0<br />
no data<br />
no data<br />
no data<br />
Am, Ao, Ra, Rs, Nf<br />
Am, Ra, Rs,Nf<br />
no data<br />
no data<br />
no data<br />
Af, Am, Ao, Sa<br />
Af, Am, Am, Sa, Sc<br />
no data<br />
no data<br />
no data<br />
conversion to fishponds and saltbeds; establishment <strong>of</strong><br />
resorts; presence <strong>of</strong> coastal communities; illegal cutting;<br />
existing tenurial instruments<br />
conversion to fishponds; establishment <strong>of</strong> resorts; presence<br />
<strong>of</strong> coastal communities; illegal cutting<br />
no data<br />
development <strong>of</strong> industries and ports; presence <strong>of</strong> coastal<br />
communities; conversion to fishponds<br />
no data<br />
no data<br />
presence <strong>of</strong> coastal communities; conversion to fishponds;<br />
presence <strong>of</strong> piggeries; illegal cutting<br />
presence <strong>of</strong> coastal communities; conversion to fishponds;<br />
illegal cutting<br />
no data<br />
no data<br />
no data<br />
LV<br />
MV<br />
no data<br />
MV<br />
no data<br />
no data<br />
LV<br />
LV<br />
no data<br />
no data<br />
Source: McLeod,E. and R. V. Salm. 2006. Managing Mangroves for Resilience to Climate Change. IUCN, Gland, Switzerland. 64pp.<br />
28<br />
1 Af–Aegiceras floridum, Am–Avicennia marina, Ao–A. <strong>of</strong>ficinalis, Nf–Nypa fruticans, Ra–Rhizophora apiculata, Rm–R. mucronata, Rs–R. stylosa, Sa–Sonneratia alba, Sc–Sonneratia caseolaris<br />
2 MV–most vulnerble; LV–least vulnerable
chapter 1 • vulnerability assessment <strong>of</strong> marine ecosystems and fisheries to climate change: sensitivity<br />
al., this report), mangrove areas<br />
around <strong>the</strong> VIP are vulnerable to any<br />
rise in sea level and o<strong>the</strong>r impacts<br />
that may be brought about by this<br />
factor. Though some municipalities<br />
have considerable large areas <strong>of</strong><br />
mangroves (i.e., Calatagan and<br />
San Juan, Batangas; Calapan City,<br />
Oriental Mindoro), most <strong>of</strong> <strong>the</strong>se<br />
areas are near coastal communities<br />
which according to McLeod and<br />
Salm (2006) will be unable to<br />
progress landward due to present<br />
anthropogenic developments.<br />
Figure 36. Effect <strong>of</strong> sea level rise on existing mangrove stands (based on<br />
number <strong>of</strong> species present).<br />
Gilman et al. (2008), based on<br />
<strong>the</strong>ir analysis <strong>of</strong> available evidence,<br />
predicted that <strong>of</strong> all climate-related<br />
changes, sea level rise will have great<br />
impact on <strong>the</strong> remaining mangrove<br />
ecosystems.<br />
If <strong>the</strong> impacts <strong>of</strong> flooding due to sea level rise and<br />
<strong>the</strong> presence <strong>of</strong> species which are least sensitive<br />
to changing water quality, i.e., Avicennia marina,<br />
Rhizophora stylosa (Alongi 2008), will be considered,<br />
most <strong>of</strong> <strong>the</strong> areas studied will have low sensitivity to<br />
flooding except for <strong>the</strong> municipalities <strong>of</strong> Puerto Galera<br />
and Baco, Oriental Mindoro (Figure 37). Aside from<br />
<strong>the</strong>ir greater ability to cope with changes in water<br />
quality, <strong>the</strong> species <strong>of</strong> A. marina and R. stylosa have<br />
higher rates <strong>of</strong> colonization potential.<br />
Using <strong>the</strong> vulnerability assessment conditions<br />
presented by McLeod and Salm (2006) in Table 9<br />
and <strong>the</strong> projected sea level rise in VIP (Siringan et<br />
The projections presented here are conservative<br />
because interactions between climate change impacts<br />
are not considered. Increase in ocean temperature, sea<br />
level rise, and more frequent typhoons acting toge<strong>the</strong>r<br />
are likely to have greater impacts than <strong>the</strong> sum <strong>of</strong> <strong>the</strong>ir<br />
individual impacts. As an example, sea level rise is likely<br />
to liberate sediments from <strong>the</strong> inundated lands, and<br />
drowned mangroves and seagrasses. These sediments,<br />
in turn, will reduce water transparency (for one) fur<strong>the</strong>r<br />
aggravating <strong>the</strong> drowning <strong>of</strong> <strong>the</strong> lower reef slope. Even<br />
more sediments will be liberated by strong waves and<br />
heavy rainfall generated by storms and typhoons. (Also<br />
consider possible changes in rainfall patterns, this is a<br />
gap area).<br />
Figure 37. Effect <strong>of</strong> flooding due to sea level rise on existing mangrove stands<br />
(based on presence <strong>of</strong> flood resistant species).<br />
Ano<strong>the</strong>r reason why <strong>the</strong> projections<br />
presented here should be considered<br />
conservative is because <strong>the</strong>y were<br />
made with <strong>the</strong> implicit assumption<br />
that <strong>the</strong> impacts <strong>of</strong> human activities<br />
are already incorporated in <strong>the</strong><br />
baseline data used and will remain at<br />
current levels in <strong>the</strong> future. However,<br />
<strong>the</strong> coasts <strong>of</strong> <strong>the</strong> VIP host rapidly<br />
growing populations and are subject<br />
to increasing development. There is<br />
already evidence from Lian, Batangas<br />
and Puerto Galera, Oriental Mindoro<br />
<strong>of</strong> eutrophication resulting from<br />
agriculture and urban sewage,<br />
respectively (please cite reference).<br />
This leads to algal blooms that will<br />
have detrimental impact on <strong>the</strong> reef.<br />
Also, <strong>the</strong> impact <strong>of</strong> garbage on VIP<br />
waters has not been studied.<br />
29
climate change vulnerability assessment <strong>of</strong> <strong>the</strong> verde island passage, philippines<br />
Adaptive capacity<br />
The adaptive capacity <strong>of</strong> an ecosystem would depend<br />
on <strong>the</strong>ir historical stress experience and <strong>the</strong>ir natural<br />
ability to withstand an impact. This was explored using<br />
1) change detection analysis for 10 representative<br />
sites in <strong>the</strong> <strong>Verde</strong> <strong>Island</strong> <strong>Passage</strong>, and 2) time series <strong>of</strong><br />
pelagic primary productivity.<br />
Coastal habitat<br />
Changes in coastal habitat were done using latest<br />
available cloud-free Landsat images: <strong>the</strong> oldest<br />
available (1991-92); after <strong>the</strong> 1998 massive bleaching<br />
(2001-02); and <strong>the</strong> latest available (2007/2009).<br />
Each <strong>of</strong> <strong>the</strong> images were pre-processed for<br />
atmospheric correction using dark pixel subtraction and<br />
subsequently land masked. A new set <strong>of</strong> spectral layers<br />
were <strong>the</strong>n created using <strong>the</strong> following band ratios: B1-<br />
B2; B4-B3; B5-B4; B5-B2. This was done to eliminate/<br />
minimize <strong>the</strong> shadow effect <strong>of</strong> clouds and mountain<br />
shading. PCA images were <strong>the</strong>n density sliced to<br />
collect ROI's representative <strong>of</strong> <strong>the</strong> known habitats, i.e.,<br />
Live Corals; Mixed Live with Dead Coral-Rock (DCA-<br />
Rck); Algae overgrown DCA-Rck and Macrophyte<br />
Bed; and Sand-Rubble) on <strong>the</strong> reef. Between 30 to 80<br />
points per habitat were collected and used as training<br />
pixels for supervised parallelepiped classification.<br />
Generation <strong>of</strong> class statistics (area coverage per<br />
microhabitat) was conducted in selected areas <strong>of</strong> VIP.<br />
It should be noted, however, that <strong>the</strong> 2009 images<br />
have <strong>the</strong> inherent problem <strong>of</strong> presence <strong>of</strong> stripping.<br />
This results in an over/under estimate <strong>of</strong> total cover.<br />
Correction was done by multiplying <strong>the</strong> % cover from<br />
<strong>the</strong> 2009 data multiplied by <strong>the</strong> more reliable 1991-<br />
1992 total coverage data. The same was done for <strong>the</strong><br />
2001-2002 images. Percent covers <strong>of</strong> live coral; mixed<br />
live and dead coral/rock; algae dominated/macrophyte<br />
beds; and sandy areas are highlighted in Table 14.<br />
Calatagan, followed by Puerto Galera-Naujan appear<br />
stable in that changes to live coral and macrophyte<br />
cover are minimal through <strong>the</strong> years, and this appears<br />
consistent with limited monitoring data from a people’s<br />
organization in Calatagan. The live coral cover <strong>of</strong><br />
Batangas East and West Marinduque also appears<br />
stable. The most significant live coral cover loss can<br />
be seen for <strong>the</strong> islands <strong>of</strong> Lubang and Maricaban.<br />
Coral cover loss (1991/92 to 2002) and <strong>the</strong>n recovery<br />
(2002 to 2009) was observed for Naujan-Gloria. In<br />
several sites (Lubang <strong>Island</strong>, Naujan-Gloria, and West<br />
Marinduque), shifts in dominant substrate type from<br />
loose, to dead coralline/rocky substrate was observed.<br />
Processes underlying such shifts are usually biological<br />
and physical in nature, operating in a predominantly<br />
local scale.<br />
In Lubang <strong>Island</strong> and West Marinduque, <strong>the</strong> increase<br />
in relative cover <strong>of</strong> dead coralline algae/rock from 2002<br />
to 2009 could be <strong>the</strong> result <strong>of</strong> rubble aggregation<br />
and lithification. This type <strong>of</strong> substrate shift was<br />
also observed in Ngaderrak Reef in <strong>the</strong> Republic <strong>of</strong><br />
Palau (Ticzon et al. 2008), where rubble areas were<br />
consolidated and cemented by coralline algae and <strong>the</strong><br />
encrusting sponge Clathria. However, this process<br />
<strong>of</strong> lithification in Lubang <strong>Island</strong> and West Marinduque<br />
could have been limited in areas <strong>of</strong> low wave energy,<br />
and minimal anthropogenic disturbance. This would<br />
allow for loose rubble to aggregate and provide time<br />
for biological processes to initiate <strong>the</strong> process <strong>of</strong><br />
cementation.<br />
A different process is believed to be behind a similar<br />
shift in dominant substrate type in <strong>the</strong> Naujan-Gloria<br />
reefs. Characterized by strong wave action and steep<br />
Table 14. Change in coastal habitat cover through time. Size <strong>of</strong> <strong>the</strong> circle<br />
depicts extent <strong>of</strong> total coastal habitat cover in hectares (small = tens;<br />
medium = more than a hundred; large = beyond 1000 hectares).<br />
Lubang <strong>Island</strong><br />
Calatagan<br />
East Calumpan<br />
Batangas Bay West<br />
Batangas East<br />
Maricaban <strong>Island</strong><br />
West Marinduque<br />
Wawa-Paluan<br />
Pto. Galera-Naujan<br />
Naujan-Gloria<br />
1991/1992 2002 2009<br />
Blues–corals, maroons–mixed live/dead coral and rock, greens–algal covered substrate or macrophyte<br />
beds, yellow–sandy areas.<br />
30
chapter 1 • vulnerability assessment <strong>of</strong> marine ecosystems and fisheries to climate change: adaptive capacity<br />
slopes, erosion <strong>of</strong> loose substrate to <strong>the</strong> deeper<br />
section <strong>of</strong> <strong>the</strong> shelf is seen as <strong>the</strong> primary reason in<br />
<strong>the</strong> increase in percent cover <strong>of</strong> dead coralline/rocky<br />
substrate in this section <strong>of</strong> <strong>the</strong> VIP, specifically from<br />
Barangay Calima to Mag-Asawang Tubig, in Pola. The<br />
erosion <strong>of</strong> loose substrate exposed <strong>the</strong> underlying bed<br />
rock in some areas, contributing to <strong>the</strong> increased cover<br />
<strong>of</strong> DCA/Rock. However, <strong>the</strong> image also shows that <strong>the</strong><br />
increase in relative cover <strong>of</strong> DCA/Rock is due to coral<br />
mortality, which consistently occurred in this section <strong>of</strong><br />
<strong>the</strong> VIP from 1992 to 2009.<br />
Pelagic primary productivity<br />
In temperate regions, primary productivity has been<br />
shown to be affected by changes in precipitation<br />
pattern (Mallin et al. 1993), and changes in intensity <strong>of</strong><br />
storm (Vinayachandran and Ma<strong>the</strong>w 2003). Moreover,<br />
<strong>the</strong> northward shift <strong>of</strong> warm-water plankton, <strong>the</strong> retreat<br />
<strong>of</strong> cold-water plankton and <strong>the</strong> altered timing <strong>of</strong> spring<br />
plankton production are already seen to affect higher<br />
trophic levels (MCCIP 2008). The primary productivity<br />
adaptive capacity in <strong>the</strong> VIP is explored by describing<br />
<strong>the</strong> behavior <strong>of</strong> chlorophyll a signal through time using<br />
SeaWIFs monthly dataset with a 9 km resolution<br />
(September 1998-March 2009).<br />
Chlorophyll data within and around <strong>the</strong> VIP shows<br />
<strong>the</strong> seasonality <strong>of</strong> <strong>the</strong> signal with higher signal during<br />
<strong>the</strong> NE monsoon (Figure 38). This is because during<br />
<strong>the</strong> nor<strong>the</strong>ast monsoon, winds through <strong>the</strong> passage<br />
are funneled by <strong>the</strong> topography and coastline <strong>of</strong> <strong>the</strong><br />
strait resulting in very strong wind jets. Such wind jets<br />
have been described as <strong>the</strong> driving force behind <strong>the</strong><br />
dipole eddy that sometimes forms <strong>of</strong>f Lubang <strong>Island</strong><br />
in <strong>the</strong> South China Sea (Pullen et al. 2008). The<br />
strong nor<strong>the</strong>ast monsoon winds through <strong>the</strong> strait<br />
may also enhance mixing resulting in <strong>the</strong> transport<br />
<strong>of</strong> nutrients towards <strong>the</strong> surface thus enhancing<br />
productivity. This is supported by both satellite and<br />
ship-based measurements showing elevated chlorophyll<br />
concentrations in <strong>the</strong> area west <strong>of</strong> <strong>the</strong> <strong>Verde</strong> <strong>Island</strong><br />
(PhilEx, unpub data).<br />
Fur<strong>the</strong>r investigation <strong>of</strong> <strong>the</strong> NE signal shows <strong>the</strong> higher<br />
chlorophyll concentration in <strong>the</strong> western side <strong>of</strong> <strong>the</strong><br />
VIP (Figure 39). Long-term anomalies show all clusters<br />
having negative chl anomaly in 1998, hence chl also<br />
decreased in <strong>the</strong> VIP during <strong>the</strong> 1998 high <strong>the</strong>rmal<br />
anomaly that is responsible for mass coral bleaching<br />
(Figure 40). The 2 clusters within <strong>the</strong> VIP showed a<br />
positive chl anomaly during <strong>the</strong> following strong La Niña<br />
Figure 38. SeaWiFs derived monthly surface chlorophyll in and around <strong>the</strong> VIP from September<br />
1998-March 2009 clustered into 9 distinct classes. Signature time-series for each cluster are shown above.<br />
Peaks pertain to elevated chlorophyll concentrations during <strong>the</strong> NE monsoon.<br />
31
climate change vulnerability assessment <strong>of</strong> <strong>the</strong> verde island passage, philippines<br />
(1999-2001) with a 1 year lag between <strong>the</strong> eastern and<br />
western part. This could have implications in <strong>the</strong> near<br />
future because PDO negative (in which we are in now)<br />
have been associated with more La Niñas. During <strong>the</strong><br />
prolonged weak El Niño from 2003-2006 no significant<br />
anomalies were observed. In 2007-08, <strong>the</strong>re was again<br />
a positive chl anomaly during La Niña. Then, in 2008<br />
just as <strong>the</strong> La Niña was weakening, <strong>the</strong>re was a PDO<br />
was shift from a warm phase to a cold phase and a<br />
negative chl anomaly was observed.<br />
Figure 39. Average signal during <strong>the</strong> NE monsoon (Dec-Feb) in surface<br />
chl (mg/m 3 ). Values are standardized (normalized by mean and st dev) for<br />
comparison (Dec 1997-Feb 2009).<br />
Figure 40. Anomaly signals for <strong>the</strong> NE monsoon (Dec-Feb) in<br />
surface chl (mg/m 3 ).<br />
32
chapter 1 • vulnerability assessment <strong>of</strong> marine ecosystems and fisheries to climate change: vulnerability<br />
Vulnerability<br />
Measuring vulnerability requires various hierarchical<br />
scales <strong>of</strong> analyses and perspectives vis-à-vis <strong>the</strong><br />
impending impact on <strong>the</strong> socio-ecological system.<br />
Measuring <strong>the</strong>ir eventual interactive effects would<br />
require a nuanced perspective. By putting in a matrix<br />
or geographic overlay <strong>of</strong> how each aspect interacts is<br />
useful as a first order analyses. But putting into context<br />
<strong>the</strong> different weights and importance factors <strong>of</strong> <strong>the</strong><br />
climate change impacts and <strong>the</strong>ir functionality would<br />
have give varying impacts at a habitat level vis-à-vis<br />
<strong>the</strong>ir species level concerns.<br />
Consequence <strong>of</strong> this habitat sensitivity<br />
to diversity<br />
Coral diversity<br />
The number <strong>of</strong> observed coral genera and reef fish<br />
abundance and species richness <strong>of</strong> each survey site per<br />
municipality were collated for <strong>the</strong> analysis. The number<br />
<strong>of</strong> observed coral genera per municipality was obtained<br />
by pooling all <strong>the</strong> occurrences <strong>of</strong> coral genera per<br />
municipality. Species richness <strong>of</strong> reef fish assemblages<br />
per municipality was also obtained by pooling all <strong>the</strong><br />
observed reef fishes during <strong>the</strong>se surveys. Reef fish<br />
abundances values were obtained by getting <strong>the</strong> total<br />
number <strong>of</strong> individuals per municipality.<br />
Based on <strong>the</strong> percentage loss <strong>of</strong> coral cover due to<br />
increase in ocean temperature, coral diversity loss<br />
was estimated to range from 0.7% to 1.6% across<br />
<strong>the</strong> VIP using <strong>the</strong> species-area curve for Calamianes.<br />
Specifically, diversity loss in <strong>the</strong> municipalities <strong>of</strong><br />
Mabini, Tingloy and Lubang ranged from 1.0% to<br />
1.6%, 1.1% to 1.6% and 0.9 to 1.2% respectively<br />
(Table 15). The remaining municipalities <strong>of</strong> Batangas<br />
City, Calatagan, Looc, Nasugbu and San Juan are<br />
deemed to lose 0.7% to 0.9% <strong>of</strong> <strong>the</strong>ir coral diversity.<br />
However, using Pratchett et al. (2008) as basis,<br />
diversity loss across <strong>the</strong> VIP ranged from 10% to<br />
as high as 75%. The municipality <strong>of</strong> Nasugbu was<br />
considered as highly vulnerable as it could lose 21%<br />
to 75% <strong>of</strong> its coral diversity. This is attributed to <strong>the</strong><br />
low number <strong>of</strong> coral genera occurring in its reef areas.<br />
Whereas, <strong>the</strong> municipality <strong>of</strong> Tingloy and Batangas City<br />
were considered to be vulnerable since it could lose<br />
10% to 41% and 15% to 49% <strong>of</strong> its coral diversity,<br />
respectively. O<strong>the</strong>r municipalities such as Calatagan,<br />
Looc, Lubang, Mabini, and San Juan have estimated<br />
losses <strong>of</strong> 13% to 59%.<br />
It should be noted however, that not all <strong>of</strong> <strong>the</strong> identified<br />
coral genera (27) were present in each municipality.<br />
As explained earlier, <strong>the</strong> lower estimates based on<br />
Pratchett et al. (2008) was obtained by deducting <strong>the</strong><br />
top ten (10) genera from <strong>the</strong> total number <strong>of</strong> genera<br />
present. Whereas, <strong>the</strong> higher estimates was obtained<br />
by removing all <strong>of</strong> <strong>the</strong> genera that were indicated in <strong>the</strong><br />
list in Pratchett et al. 2008.<br />
Table 16 presents <strong>the</strong> changes in <strong>the</strong> occurrence <strong>of</strong><br />
coral genera when a storm similar to Caloy passed by<br />
<strong>the</strong> VIP. Coral diversity loss estimates during tropical<br />
storm Caloy in Pagbilao, Quezon ranged from 7%<br />
for low impact to 22% for severe impact. Diversity<br />
is already low in <strong>the</strong> municipalities surveyed, <strong>the</strong>reby<br />
making <strong>the</strong>m even more vulnerable based on <strong>the</strong><br />
estimates. The municipalities <strong>of</strong> Calatagan and Mabini<br />
are <strong>the</strong> least to be affected during low impact as <strong>the</strong>y<br />
have <strong>the</strong> highest diversity among all <strong>the</strong> sites surveyed.<br />
However, if <strong>the</strong> impact is severe, coral diversity in <strong>the</strong>se<br />
municipalities will be less ranging from 30 to 35 genera<br />
only. The municipality <strong>of</strong> Nasugbu is deemed to be <strong>the</strong><br />
most vulnerable <strong>of</strong> all <strong>the</strong> sites regardless <strong>of</strong> low or<br />
severe impact. Losses in coral genera will change from<br />
28 to 21.8% during severe impact. This is attributed<br />
to <strong>the</strong> very low occurrences <strong>of</strong> coral genera in <strong>the</strong><br />
municipality.<br />
Following sea level rise and assuming that <strong>the</strong> coral<br />
distribution and diversity are even for <strong>the</strong> entire reef<br />
area, diversity loss obtained using <strong>the</strong> species area<br />
curve estimated 0.60% to 0.80% loss. Specifically,<br />
Batangas City and Nasugbu are highly vulnerable with<br />
Table 15. Percentage (%) loss <strong>of</strong> coral diversity during elevated sea<br />
surface temperatures in <strong>the</strong> eight municipalities surveyed in <strong>the</strong> VIP.<br />
Diversity loss (%)<br />
# sp-area Pratchett<br />
Municipality Sites genera curve et al. 2008<br />
Batangas City<br />
Calatagan<br />
Looc<br />
Lubang<br />
Mabini<br />
Nasugbu<br />
San Juan<br />
Tingloy<br />
4<br />
8<br />
6<br />
6<br />
3<br />
2<br />
8<br />
3<br />
39<br />
44<br />
41<br />
39<br />
45<br />
28<br />
42<br />
41<br />
0.8-0.9<br />
0.7-0.9<br />
0.8-0.9<br />
0.9-1.2<br />
1.0-1.6<br />
0.8-0.9<br />
0.7-0.8<br />
1.1-1.6<br />
15-49<br />
18-57<br />
15-54<br />
21-59<br />
13-53<br />
21-75<br />
17-57<br />
10-41<br />
Table 16. Estimated percentage (%) <strong>of</strong> diversity <strong>of</strong> live hard corals during<br />
low to severe impacts <strong>of</strong> typhoons.<br />
Before Low Severe<br />
Municipality Sites impact impact impact<br />
Batangas City<br />
Calatagan<br />
Looc<br />
Lubang<br />
Mabini<br />
Nasugbu<br />
San Juan<br />
Tingloy<br />
All municipalities<br />
4<br />
8<br />
6<br />
6<br />
3<br />
2<br />
8<br />
3<br />
39<br />
44<br />
41<br />
39<br />
45<br />
28<br />
42<br />
41<br />
63<br />
36.3<br />
40.9<br />
38.1<br />
36.3<br />
41.9<br />
26.0<br />
39.1<br />
38.1<br />
58.6<br />
30.4<br />
34.3<br />
32.0<br />
30.4<br />
35.1<br />
21.8<br />
32.8<br />
32.0<br />
49.1<br />
33
climate change vulnerability assessment <strong>of</strong> <strong>the</strong> verde island passage, philippines<br />
0.60% to 0.80% diversity loss while <strong>the</strong> rest <strong>of</strong> <strong>the</strong><br />
municipalities surveyed have relatively lower estimates<br />
<strong>of</strong> 0.60% to 0.70% diversity loss.<br />
Reef fish diversity<br />
Recent studies <strong>of</strong> Wilkinson (2000a and 2000b) have<br />
shown that climate-induced coral bleaching has had<br />
major effects on <strong>the</strong> biological and physical structure<br />
<strong>of</strong> coral reef habitats. Numerous studies (e.g., Shibuno<br />
et al. 1999, McClanahan et al. 2002a, Munday 2004a,<br />
Sano 2004, Graham et al. 2006, Pratchett et al. 2006)<br />
have documented consequent changes in <strong>the</strong> species<br />
composition and abundance <strong>of</strong> associated reef fish<br />
assemblages. Changes in <strong>the</strong> topographic complexity<br />
and loss <strong>of</strong> coral cover affect reef fishes by reducing<br />
viable coral growths that provide shelter and protection<br />
and food source which ultimately affect settlement,<br />
recruitment and overall biological diversity.<br />
The municipality <strong>of</strong> Mabini had <strong>the</strong> highest number <strong>of</strong><br />
reef fishes observed within <strong>the</strong> belt transects with 151<br />
species (Table 18). Mabini is closely followed by <strong>the</strong><br />
municipalities <strong>of</strong> Lubang, Tingloy and Batangas City<br />
with 147, 142, and 139 species, respectively. The<br />
municipalities <strong>of</strong> Looc and Nasugbu, despite having<br />
higher percentages <strong>of</strong> live hard coral cover, only<br />
harbored 87 and 44 reef fish species, respectively.<br />
San Juan and Calatagan fell in <strong>the</strong> middle with 100<br />
and 113 species. Lubang municipality had <strong>the</strong> highest<br />
estimated reef fish abundance with more than 2,000<br />
reef fish individuals, whereas <strong>the</strong> municipality <strong>of</strong><br />
Nasugbu had <strong>the</strong> lowest reef fish abundance with only<br />
171 individuals. The municipality <strong>of</strong> Looc despite having<br />
less than a hundred reef fish species still had more<br />
than 1000 reef fish individuals. Mabini municipality on<br />
<strong>the</strong> o<strong>the</strong>r hand, only had more than 1,200 individuals<br />
despite having <strong>the</strong> highest species richness. The<br />
remaining municipalities, Batangas City, Calatagan, San<br />
Juan, and Tingloy had reef fish abundances <strong>of</strong> more<br />
than 1,400 individuals. The Fish Visual Census (FVC)<br />
method was used to assess <strong>the</strong> reef fish assemblages.<br />
Reef fish species richness was accounted by pooling<br />
all <strong>the</strong> observed species in <strong>the</strong> belt transects during <strong>the</strong><br />
surveys. Fish abundance was estimated by pooling total<br />
fish abundance (number <strong>of</strong> individuals/1000m 2 ) per<br />
survey site and getting <strong>the</strong>ir means.<br />
Effects on <strong>the</strong> reef fish abundance and diversity were<br />
determined by calculating <strong>the</strong> percentage losses<br />
<strong>of</strong> vulnerable species that Pratchett et al. (2008)<br />
identified. Table 17 presents <strong>the</strong> vulnerable reef fish<br />
species adapted from Pratchett et al. (2008) found in<br />
<strong>the</strong> <strong>Verde</strong> <strong>Island</strong> <strong>Passage</strong>.<br />
Losses in reef fish abundances were estimated by<br />
deducting <strong>the</strong> abundances <strong>of</strong> <strong>the</strong> vulnerable species<br />
from <strong>the</strong> total reef fish abundance per municipality.<br />
Similarly, reef fish diversity loss per municipality was<br />
computed by subtracting <strong>the</strong> total number <strong>of</strong> vulnerable<br />
species to <strong>the</strong> total number <strong>of</strong> species present in each<br />
municipality.<br />
A total <strong>of</strong> 16 species <strong>of</strong> reef fishes listed in Pratchett<br />
et al. (2008) was observed in <strong>the</strong> VIP. Percentage loss<br />
<strong>of</strong> reef fish species ranged from 9% to 14% (Table<br />
18). The municipality <strong>of</strong> Nasugbu was deemed to have<br />
<strong>the</strong> highest vulnerability as it could lose 16% <strong>of</strong> <strong>the</strong><br />
44 observed fish species, followed by Looc, Caltagan,<br />
and San Juan with estimated losses <strong>of</strong> 14%, 12%, and<br />
10% respectively. The municipalities <strong>of</strong> Batangas City,<br />
Lubang, Mabini, and Tingloy had <strong>the</strong> lowest estimated<br />
loss <strong>of</strong> 9%. The total number <strong>of</strong> species observed, only<br />
included reef fish species observed during <strong>the</strong> transect<br />
surveys.<br />
The estimated percentage losses <strong>of</strong> reef fish diversity<br />
and abundance is relatively high. However, <strong>the</strong>se<br />
estimates are still considered to be conservative as<br />
<strong>the</strong> compounded impacts <strong>of</strong> <strong>the</strong> o<strong>the</strong>r climate change<br />
impacts and human activities are still not accounted<br />
for. Although <strong>the</strong> effects <strong>of</strong> loss <strong>of</strong> coral cover can be<br />
minimal and limited to highly-dependent fishes (e.g.,<br />
corallivores), changes in topographic complexity can<br />
Table 17. Reef fish species observed in <strong>the</strong> <strong>Verde</strong> <strong>Island</strong> <strong>Passage</strong> that<br />
are affected by coral bleaching due to <strong>the</strong>ir association and dependence<br />
on coral communities.<br />
Family Species Habits<br />
Acanthuridae<br />
Chaetodontidae<br />
Chaetodontidae<br />
Chaetodontidae<br />
Chaetodontidae<br />
Labridae<br />
Labridae<br />
Labridae<br />
Pomacentridae<br />
Pomacentridae<br />
Pomacentridae<br />
Pomacentridae<br />
Pomacentridae<br />
Pomacentridae<br />
Pomacentridae<br />
Siganidae<br />
Source: adapted from Pratchett et al. 2008.<br />
Batangas City<br />
Calatagan<br />
Looc<br />
Lubang<br />
Mabini<br />
Nasugbu<br />
San Juan<br />
Tingloy<br />
Ctenochaetus striatus<br />
Chaetodon baronessa<br />
Chaetodon lunulatus<br />
Chaetodon melannotus<br />
Chaetodon trifascialis<br />
Gomphosus varius<br />
Halichoeres melanurus<br />
Labrichthys unilineatus<br />
Amblyglyphidodon curacao<br />
Chrysiptera rollandi<br />
Neoglyphidodon melas<br />
Plectroglyphidodon lacrymatus<br />
Pomacentrus lepidogenys<br />
Pomacentrus moluccensis<br />
Pomacentrus vaiuli<br />
Siganus spinus<br />
herbivores<br />
corallivore<br />
corallivore<br />
corallivore<br />
corallivore<br />
benthic carnivore<br />
o<strong>the</strong>rs<br />
corallivore<br />
omnivores<br />
o<strong>the</strong>rs<br />
corallivore<br />
herbivores<br />
coral dweller<br />
coral dweller<br />
o<strong>the</strong>rs<br />
herbivores<br />
Table 18. Percentage (%) loss <strong>of</strong> associated reef fish species and<br />
abundance in <strong>the</strong> event <strong>of</strong> coral bleaching.<br />
Species richness<br />
Abundance<br />
# species %<br />
Municipality Sites observed lost loss before after loss<br />
4<br />
8<br />
6<br />
6<br />
4<br />
2<br />
8<br />
3<br />
139<br />
113<br />
87<br />
147<br />
151<br />
44<br />
100<br />
142<br />
13<br />
13<br />
12<br />
13<br />
14<br />
7<br />
10<br />
13<br />
9<br />
12<br />
14<br />
9<br />
9<br />
16<br />
10<br />
9<br />
1660<br />
1874<br />
1086<br />
2227<br />
1215<br />
171<br />
1410<br />
1465<br />
1205<br />
1377<br />
830<br />
1658<br />
652<br />
133<br />
1247<br />
672<br />
27<br />
27<br />
24<br />
26<br />
46<br />
22<br />
12<br />
54<br />
34
chapter 1 • vulnerability assessment <strong>of</strong> marine ecosystems and fisheries to climate change: vulnerability<br />
cause more wide-spread detrimental impacts. The<br />
increase in frequencies and intensities <strong>of</strong> storms and<br />
typhoons for example, can cause more devastating<br />
effects on habitat complexity. Never<strong>the</strong>less, <strong>the</strong><br />
estimates made are still significant as it provides us<br />
lower-range projected losses in <strong>the</strong> VIP.<br />
Consequence <strong>of</strong> this habitat sensitivity<br />
to fisheries<br />
To achieve <strong>the</strong> objectives <strong>of</strong> <strong>the</strong> vulnerability<br />
analyses it is necessary to determine <strong>the</strong> attributes<br />
<strong>of</strong> fisheries ecosystem, <strong>the</strong>ir ecosystem features and<br />
connectedness to <strong>the</strong> various habitats and resources<br />
and how <strong>the</strong> ecological and social economic systems<br />
interact. This component emphasizes on <strong>the</strong> ecological<br />
interactions and only introduces its links to <strong>the</strong><br />
social systems as <strong>the</strong>se social linkages and adaptive<br />
capacities are discussed by ano<strong>the</strong>r group.<br />
This approach (Table 19) first identifies and <strong>the</strong>n<br />
quantifies <strong>the</strong> types <strong>of</strong> gear present and used in<br />
six municipality/city sites in <strong>the</strong> VIP, namely Mabini<br />
(Batangas), <strong>Verde</strong> Is. (Batangas City), Puerto Galera<br />
(Oriental Mindoro), Lubang (Occidental Mindoro),<br />
Looc (Occ. Mindoro), and Paluan (Occ. Mindoro).<br />
Where available, information on fisher population, types<br />
<strong>of</strong> fishing gears used (mainly artisanal and under <strong>the</strong><br />
municipal fisheries category), number <strong>of</strong> fishers per<br />
gear type, catch rate, catch composition, seasonality <strong>of</strong><br />
gear use, and fishing areas <strong>of</strong> <strong>the</strong> gears were collected.<br />
Threat analyses<br />
Standardizing semi-quantitative scores <strong>of</strong> human<br />
induced threats vis-à-vis fisheries and resource<br />
exploitation and o<strong>the</strong>r exacerbating impacts.<br />
The vulnerability assessment utilizes <strong>the</strong> information<br />
ga<strong>the</strong>red from <strong>the</strong> literature to identify <strong>the</strong> fisheries<br />
resources (target species, fishery stocks) that will be<br />
most affected (i.e., vulnerable vis-á-vis <strong>the</strong> prospective<br />
Table 19. Focus <strong>of</strong> <strong>the</strong> fisheries vulnerability assessment in <strong>the</strong> <strong>Verde</strong><br />
<strong>Island</strong> <strong>Passage</strong>.<br />
Target species and life history characterstics<br />
Spratelloides (dulong): post-larval juveniles <strong>of</strong> this pelagic species are heavity harvested<br />
at nearshore areas including lagoons at known season This fishery is important in Mabini<br />
and adjacent areas.<br />
Groupers: juveniles <strong>of</strong> some <strong>of</strong> <strong>the</strong>se reef associated fish occur at mangroves and<br />
estuaries (i.e., ontogenetic habitat movement) at known season. Important in <strong>the</strong> live fish<br />
food fishery in Looc and Lubang.<br />
Milkfish: juveniles <strong>of</strong> this species occur at estuaries. Important in <strong>the</strong> milkfish fry fishery in<br />
Occidental Mindoro.<br />
Aquarium fish: <strong>the</strong>se fish are highly associated with coral reefs. Important in <strong>the</strong><br />
aquarium fishery in <strong>Verde</strong> <strong>Island</strong> and Occidental Mindoro.<br />
Gear quantity, distribution, and dependence on habitats<br />
Fishing grounds <strong>of</strong> varying habitat types with associated gears. High gear effort at more<br />
habitat types render <strong>the</strong> areas more sensitive and <strong>the</strong>refore vulnerable to climate change.<br />
Lubang showed <strong>the</strong> most number <strong>of</strong> gears and gear types variably distributed at different<br />
habitat types.<br />
climate impacts) by extreme changes in <strong>the</strong> climate.<br />
Emphasis was placed upon knowledge <strong>of</strong> <strong>the</strong> critical<br />
life stages (e.g., larvae, juveniles, reproductive stages)<br />
<strong>of</strong> <strong>the</strong> species as well as some information on <strong>the</strong>ir<br />
catch rates and habitat conditions. It has been<br />
acknowledged that changes in <strong>the</strong> climate (e.g., rising<br />
sea surface temperature, increase in storm frequency,<br />
storm surges) would possibly introduce greatest impact<br />
upon larval, juvenile and reproductive stages <strong>of</strong> target<br />
species affecting distributional patterns (e.g., Munday<br />
et al. 2008). Target species may also be influenced by<br />
changes in <strong>the</strong> climate indirectly through habitat loss<br />
and fragmentation (e.g., coral loss through bleaching<br />
events, inundation <strong>of</strong> mangroves areas) affecting <strong>the</strong>ir<br />
recruitment, survivorship and abundance (Pratchet et<br />
al. 2008). The associated habitats <strong>of</strong> <strong>the</strong> target species<br />
were determined as this will allow fur<strong>the</strong>r examination<br />
<strong>of</strong> <strong>the</strong> conditions <strong>of</strong> <strong>the</strong>se habitats harboring <strong>the</strong><br />
critical life stages. The presence <strong>of</strong> habitat types<br />
(e.g., seagrass beds, mangroves) that enhances <strong>the</strong><br />
growth and survivorship and what drives <strong>the</strong> population<br />
dynamics <strong>of</strong> <strong>the</strong> species potentially will serve as a<br />
gauge or index as what would be vulnerable to climate<br />
change (e.g., increase in sea surface temperature, sea<br />
level rise).<br />
Catch composition and dominant catches <strong>of</strong> <strong>the</strong><br />
gears allows identification <strong>of</strong> <strong>the</strong> species targeted in<br />
<strong>the</strong> fisheries. In addition, <strong>the</strong> distribution <strong>of</strong> <strong>the</strong> target<br />
species can be assessed by determining <strong>the</strong> types <strong>of</strong><br />
gear used in <strong>the</strong> area and <strong>the</strong> associated habitats <strong>of</strong> <strong>the</strong><br />
species and gears. The gear types <strong>of</strong> <strong>the</strong> target species<br />
and <strong>the</strong>ir level <strong>of</strong> fishing effort will be concurrently<br />
assessed to incorporate <strong>the</strong> exacerbating effects <strong>of</strong><br />
exploitation upon “sensitive” species and habitats.<br />
The vulnerability assessment also takes into account<br />
<strong>the</strong> dependence <strong>of</strong> <strong>the</strong> gears and <strong>the</strong>refore <strong>the</strong> fishers<br />
upon specific “sensitive” habitats in <strong>the</strong> fisheries. The<br />
gear types, <strong>the</strong>ir density, and <strong>the</strong>ir level <strong>of</strong> effort will be<br />
utilized to explore <strong>the</strong> vulnerabilities <strong>of</strong> <strong>the</strong> fisheries.<br />
This also initiates <strong>the</strong> interaction with or <strong>the</strong> link to<br />
socio-economic aspects <strong>of</strong> <strong>the</strong> assessment particularly<br />
highlighting <strong>the</strong> effects upon human well-being whereas<br />
<strong>the</strong> identified fishing areas <strong>of</strong> <strong>the</strong> gears will link to <strong>the</strong><br />
habitat and biodiversity aspects <strong>of</strong> <strong>the</strong> assessment.<br />
Vulnerabilities were first explored for <strong>the</strong> target species/<br />
taxa <strong>of</strong> each site by primarily considering <strong>the</strong> range <strong>of</strong><br />
associated habitat types throughout <strong>the</strong> life cycle <strong>of</strong><br />
<strong>the</strong> species that would be at risk to climate change<br />
impacts. Table 20 shows <strong>the</strong> target species/taxa <strong>of</strong> <strong>the</strong><br />
various gear types <strong>of</strong> <strong>the</strong> 6 sites and <strong>the</strong>ir associated<br />
habitat types. Under this assessment, Lubang and<br />
Looc fisheries appear both to be more vulnerable<br />
compared to any o<strong>the</strong>r site. This was mainly due to<br />
<strong>the</strong> several target species and/or taxa from a range <strong>of</strong><br />
gear types. Many <strong>of</strong> <strong>the</strong> target species showed varying<br />
35
climate change vulnerability assessment <strong>of</strong> <strong>the</strong> verde island passage, philippines<br />
Table 20. Vulnerability assessment <strong>of</strong> <strong>the</strong> fisheries, based on <strong>the</strong> number <strong>of</strong> habitat types <strong>of</strong> <strong>the</strong> target species/taxa (including all types <strong>of</strong> habitat<br />
throughout <strong>the</strong> life cycle). Oceanographic and remote sensing (RS) information on <strong>the</strong> habitat attributes will result in functional weighting <strong>of</strong> <strong>the</strong> habitat<br />
scores vis-à-vis <strong>the</strong>ir importance to <strong>the</strong> vulnerability values.<br />
Habitat type<br />
Number<br />
Caught by sand/ estuarine <strong>of</strong> habitat Vulnerability<br />
Species/taxa gear type reef beach mangrove seagrass creeks/rivers pelagic types index<br />
Mabini, Batangas<br />
dulong (Spratelloides)<br />
dilis (Engraulis)<br />
alumahan (Rastrelliger)<br />
tambakol (Katsuwonus)<br />
galunggong (Decapterus)<br />
matambaka (Selar)<br />
basnig (bag net), lambat<br />
pandulong (gill net), scissor net<br />
lambat pante (gill net)<br />
lambat pante (gill net)<br />
hayhay (surface long line)<br />
hayhay (surface long line)<br />
lambat pante (gill net)<br />
√<br />
√<br />
√<br />
√<br />
√<br />
√<br />
√<br />
√<br />
√<br />
√<br />
√<br />
√<br />
3<br />
3<br />
1<br />
1<br />
2<br />
2<br />
medium<br />
medium<br />
low<br />
low<br />
low to medium<br />
low to medium<br />
lapu-lapu (groupers)<br />
maya-maya (Lutjanus)<br />
kanoping (Lethrinus)<br />
bisugo (nemipterids)<br />
tulingan (Auxis)<br />
pusit (Sepioteuthis, Loligo)<br />
<strong>Verde</strong> <strong>Island</strong>, Batangas City<br />
angelfish (Pomacanthus)<br />
butterflyfish (Chaetodontus)<br />
damselfish (Chromis)<br />
anthiinid (Anthias)<br />
lion fish (Pterois)<br />
lapu-lapu (groupers)<br />
manites (Upeneus)<br />
galunggong (Decapterus)<br />
mulmol (Scarus)<br />
labahita (Naso)<br />
pusit (Sepioteuthis, Loligo)<br />
Puerto Galera, Oriental Mindoro<br />
galunggong (Decapterus)<br />
tulingan (Auxis)<br />
alumahan (Rastrelliger)<br />
labahita (Naso)<br />
loro, mulmol (Scarus)<br />
kawil (hook and line), pana<br />
(spear)<br />
hayhay (surface long line)<br />
pamanos (squid jig)<br />
hand nets (barrier<br />
net)<br />
kawil (hook and line)<br />
hayhay (long line)<br />
pana (spear)<br />
pamanos (squid jig)<br />
lambat pante (gill net)<br />
kawil (hook and line)<br />
kawil (hook and line)<br />
pana (spear)<br />
√<br />
√<br />
√<br />
√<br />
√<br />
√<br />
√<br />
√<br />
√<br />
√<br />
√<br />
√<br />
√<br />
√<br />
√<br />
√<br />
√<br />
√<br />
√<br />
√<br />
possible<br />
possible<br />
possible<br />
possible<br />
√<br />
√<br />
√<br />
√<br />
√<br />
√<br />
√<br />
√<br />
√<br />
√<br />
√<br />
√<br />
√<br />
√<br />
√<br />
√<br />
√<br />
√<br />
√<br />
√<br />
√<br />
√<br />
4<br />
2<br />
2<br />
2<br />
1<br />
2<br />
2<br />
2<br />
2<br />
2<br />
2<br />
2<br />
2<br />
2<br />
2<br />
2<br />
2<br />
2<br />
1<br />
1<br />
2<br />
2<br />
medium to high<br />
low to medium<br />
low to medium<br />
low to medium<br />
low<br />
low to medium<br />
low to medium<br />
low to medium<br />
low to medium<br />
low to medium<br />
low to medium<br />
low to medium<br />
low to medium<br />
low to medium<br />
low to medium<br />
low to medium<br />
low to medium<br />
low to medium<br />
low to medium<br />
low to medium<br />
low<br />
low<br />
low to medium<br />
low to medium<br />
low to medium<br />
Lubang, Occidental Mindoro<br />
galunggong (Decapterus)<br />
dilis (Stolephorus)<br />
pusit (Sepioteuthis, Loligo)<br />
pagulpol (Cypselurus)<br />
tangigue (Makaira)<br />
gulyasan (tuna)<br />
basnig (bag net)<br />
kawil (hook and line)<br />
basnig (bag net), lambat<br />
(gill net)<br />
pante (gill net)<br />
lambat (gill net)<br />
lambat (gill net), kawil<br />
(hook and line)<br />
√<br />
√<br />
√<br />
√<br />
√<br />
√<br />
√<br />
√<br />
√<br />
√<br />
√<br />
2<br />
4<br />
2<br />
1<br />
1<br />
1<br />
low to medium<br />
medium to high<br />
low to medium<br />
low<br />
low<br />
low<br />
maya-maya (Lutjanus)<br />
lapu-lapu (groupers)<br />
labahita (Naso), rabbitfish<br />
angelfish (Pomacanthus)<br />
butterflyfish (Chaetodontus)<br />
damselfish (Chromis)<br />
anthiinid (Anthias)<br />
bangus fry (Chanos chanos)<br />
Looc, Occidental Mindoro<br />
dilis (Stolephorus)<br />
talakitok (Carangoides)<br />
pusit (Sepioteuthis, Loligo)<br />
matambaka (Selar)<br />
lapu-lapu (live groupers)<br />
maya-maya (Lutjanus)<br />
angelfish (Pomacanthus)<br />
butterflyfish (Chaetodontus)<br />
damselfish (Chromis)<br />
anthiinid (Anthias)<br />
bangus fry (Chanos chanos)<br />
kawil (hook and line), bubo<br />
(trap), pana (spear), lambat<br />
(gill net)<br />
hand nets (w/ compressor)<br />
hand nets (w/ compressor)<br />
hand nets (w/ compressor)<br />
hand nets (w/ compressor)<br />
scoop nets<br />
basnig (bag net), lambat<br />
pandilis (anchovies), gill<br />
nets<br />
kawil (hook and line)<br />
kawil (hook and line), pana<br />
(spear)<br />
hand nets (w/ compressor)<br />
hand nets (w/ compressor)<br />
hand nets (w/ compressor)<br />
hand nets (w/ compressor)<br />
scoop nets<br />
√<br />
√<br />
√<br />
√<br />
√<br />
√<br />
√<br />
√<br />
√<br />
√<br />
√<br />
√<br />
√<br />
√<br />
√<br />
√<br />
√<br />
possible<br />
possible<br />
√<br />
√<br />
possible<br />
possible<br />
√<br />
possible<br />
√<br />
possible<br />
possible<br />
√<br />
possible<br />
√<br />
√<br />
√<br />
√<br />
√<br />
√<br />
√<br />
√<br />
√<br />
√<br />
√<br />
√<br />
√<br />
√<br />
√<br />
√<br />
√<br />
√<br />
4<br />
5<br />
4<br />
2<br />
2<br />
2<br />
2<br />
4<br />
4<br />
2<br />
2<br />
2<br />
5<br />
3<br />
2<br />
2<br />
2<br />
2<br />
4<br />
medium to high<br />
high<br />
medium to high<br />
low to medium<br />
low to medium<br />
low to medium<br />
low to medium<br />
medium to high<br />
medium<br />
medium to high<br />
low to medium<br />
low to medium<br />
low to medium<br />
high<br />
medium<br />
low to medium<br />
low to medium<br />
low to medium<br />
low to medium<br />
medium to high<br />
medium<br />
36
chapter 1 • vulnerability assessment <strong>of</strong> marine ecosystems and fisheries to climate change: vulnerability<br />
Table 20. (continued)<br />
Habitat type<br />
Number<br />
Caught by sand/ estuarine <strong>of</strong> habitat Vulnerability<br />
Species/taxa gear type reef beach mangrove seagrass creeks/rivers pelagic types index<br />
Paluan, Occidental Mindoro<br />
angelfish (Pomacanthus)<br />
butterflyfish (Chaetodontus)<br />
damselfish (Chromis)<br />
anthiinid (Anthias)<br />
galunggong (Decapterus)<br />
tulingan (Auxis)<br />
dilis (Stolephorus)<br />
alamang (Acetes)<br />
pagulpol (Cypselurus)<br />
lapu-lapu (groupers)<br />
maya-maya (snappers)<br />
labahita (Naso)<br />
hand nets (w/ compressor)<br />
hand nets (w/ compressor)<br />
hand nets (w/ compressor)<br />
hand nets (w/ compressor)<br />
basnig (bag net), kawil<br />
(hook and line)<br />
lambat (gill net)<br />
kawil (hook and line), pana<br />
(spear), bubo (trap<br />
√<br />
√<br />
√<br />
√<br />
√<br />
√<br />
√ possible possible<br />
√<br />
√<br />
possible<br />
√<br />
√<br />
√<br />
√<br />
√<br />
√<br />
√<br />
√<br />
2<br />
2<br />
2<br />
2<br />
2<br />
1<br />
3<br />
2<br />
1<br />
5<br />
low to medium<br />
low to medium<br />
low to medium<br />
low to medium<br />
low to medium<br />
low<br />
medium<br />
low to medium<br />
medium<br />
high<br />
low to medium<br />
associated habitat types such as pelagic anchovies,<br />
herrings and sardines that are known to also occur<br />
at estuaries. These sites also had fishers harvesting<br />
milkfish fry at estuaries and several grouper species<br />
with juveniles occurring at mangroves and seagrasses.<br />
Several site-attached and coral dependent reef fishes<br />
were also targeted for <strong>the</strong> aquarium fishery in Lubang,<br />
Looc, Paluan, and <strong>Verde</strong>. The types <strong>of</strong> life history trait<br />
renders <strong>the</strong>se organisms susceptible to large changes<br />
in <strong>the</strong> patterns <strong>of</strong> climate (e.g., sea surface temperature<br />
anomalies, sea level rise, more frequent and more<br />
intensified storms).<br />
Qualitative descriptions and overall<br />
assessment<br />
The <strong>Verde</strong> <strong>Island</strong> <strong>Passage</strong> is found at <strong>the</strong> core <strong>of</strong><br />
highest marine biodiversity and with huge human<br />
populations dependent upon <strong>the</strong> fisheries resources.<br />
Climate-related impacts <strong>the</strong>refore would have<br />
tremendous effects upon <strong>the</strong> coastal fisheries<br />
(subsistence or large-scale), livelihood, and economic<br />
development in <strong>the</strong> VIP. These impacts include increase<br />
in sea surface temperature (SST), sea level rise,<br />
increase in frequency and intensity <strong>of</strong> storms, changes<br />
in <strong>the</strong> variability <strong>of</strong> rainfall, and ocean acidification. As<br />
an example, increase in SST will result in loss in coral<br />
cover through bleaching events and in <strong>the</strong> long term<br />
will affect <strong>the</strong> habitat complexity <strong>of</strong> reefs that in turn will<br />
influence <strong>the</strong> settlement, recruitment, and survivorship<br />
<strong>of</strong> coral-dependent species. This consequently will<br />
reduce abundance and species diversity affecting <strong>the</strong><br />
reef fish community structure. Warming will also modify<br />
behavior, timing <strong>of</strong> reproduction, reproductive output,<br />
larval period, survivorship <strong>of</strong> recruits and <strong>the</strong>refore<br />
recruitment failure, among o<strong>the</strong>rs. For o<strong>the</strong>r nearshore<br />
habitats such as mangroves and seagrasses, seedling<br />
production, habitat fragmentation, decrease species<br />
diversity <strong>of</strong> associated organisms, and <strong>the</strong>refore affect<br />
high value fisheries associated to <strong>the</strong>m. In addition,<br />
<strong>the</strong> exacerbating effects <strong>of</strong> anthropogenic factors<br />
such as overfishing, pollution, habitat modification,<br />
infrastructure, etc. are also seen to accelerate <strong>the</strong><br />
impacts.<br />
Fishing has been acknowledged to potentially<br />
exacerbate <strong>the</strong> effects <strong>of</strong> climate change upon <strong>the</strong><br />
target species (Brander 2007). The varying gear types<br />
and high fishing effort in Mabini and Lubang (Table<br />
20) would enhance <strong>the</strong> threats more than can be<br />
observed in <strong>the</strong> o<strong>the</strong>r sites except that effort data were<br />
not available for Looc and Paluan (Table 21). Some<br />
target species were harvested by more than one gear<br />
type which was observed in anchovies and herrings in<br />
Mabini and coral reef fishes (e.g., groupers) in Lubang<br />
and, additionally, with high fisher populations.<br />
In some cases, overlapping <strong>of</strong> gears occur increasing<br />
competition between fishers amidst declining stocks<br />
in specific habitats. Table 22 shows <strong>the</strong> number <strong>of</strong><br />
gears used on each habitat type in <strong>the</strong> 6 sites. Lubang<br />
showed <strong>the</strong> most number <strong>of</strong> gears in several habitat<br />
types suggesting high degree <strong>of</strong> dependence by fishers<br />
on <strong>the</strong> habitats for fisheries and <strong>the</strong>refore demonstrated<br />
immense potential climate change impacts. This could<br />
eventually displace a number <strong>of</strong> fishers and <strong>the</strong>refore<br />
affect economic conditions. Mabini followed closely<br />
whereas <strong>Verde</strong> and Puerto Galera were in <strong>the</strong> middle<br />
range. Lack <strong>of</strong> data did not permit assessment in<br />
Looc and Paluan although it appears that because<br />
<strong>of</strong> its proximity to Lubang, Looc likely show similar<br />
conditions. The level <strong>of</strong> fishing effort <strong>of</strong> <strong>the</strong> gear types<br />
fur<strong>the</strong>r demonstrate <strong>the</strong> exacerbating effects thus <strong>the</strong><br />
vulnerability <strong>of</strong> <strong>the</strong> fisheries in Lubang.<br />
Table 23 shows <strong>the</strong> potential impacts <strong>of</strong> <strong>the</strong> fisheries in<br />
<strong>the</strong> VIP by climate change impacts. In an increasing sea<br />
surface temperature, most <strong>of</strong> <strong>the</strong> target species will be<br />
affected through disruption in timing <strong>of</strong> reproduction,<br />
decreased reproductive output, shorter larval duration,<br />
lower recruit survivorship, and recruitment failure<br />
leading to changes in fisheries productivity. Impact on<br />
critical habitats such as coral reefs, seagrasses, and<br />
37
Table 21. Vulnerability assessment <strong>of</strong> <strong>the</strong> fisheries based on <strong>the</strong> number <strong>of</strong> gear types (and <strong>the</strong>ir level <strong>of</strong> fishing effort) <strong>of</strong> <strong>the</strong> target species/taxa.<br />
Caught by Number <strong>of</strong> Level <strong>of</strong> Vulnerability<br />
Species/taxa gear type gear types fishing effort index<br />
Mabini, Batangas<br />
dulong (Spratelloides)<br />
dilis (Engraulis)<br />
alumahan (Rastrelliger)<br />
tambakol (Katsuwonus)<br />
galunggong (Decapterus)<br />
matambaka (Selar)<br />
lapu-lapu (groupers)<br />
maya-maya (Lutjanus)<br />
kanoping (Lethrinus)<br />
bisugo (nemipterids)<br />
tulingan (Auxis)<br />
pusit (Sepioteuthis, Loligo)<br />
<strong>Verde</strong> <strong>Island</strong>, Batangas City<br />
angelfish (Pomacanthus)<br />
butterflyfish (Chaetodontus)<br />
damselfish (Chromis)<br />
anthiinid (Anthias)<br />
lion fish (Pterois)<br />
lapu-lapu (groupers)<br />
manites (Upeneus)<br />
galunggong (Decapterus)<br />
alumahan (Rastrelliger)<br />
dalagang bukid (Caesio)<br />
mulmol (Scarus)<br />
labahita (Naso)<br />
pusit (Sepioteuthis, Loligo)<br />
Puerto Galera, Oriental Mindoro<br />
galunggong (Decapterus)<br />
tulingan (Auxis)<br />
alumahan (Rastrelliger)<br />
labahita (Naso)<br />
loro, mulmol (Scarus)<br />
Lubang, Occidental Mindoro<br />
galunggong (Decapterus)<br />
dilis (Stolephorus)<br />
pusit (Sepioteuthis, Loligo)<br />
pagulpol (Cypselurus)<br />
tangigue (Makaira)<br />
gulyasan (tuna)<br />
maya-maya (Lutjanus)<br />
lapu-lapu (groupers)<br />
labahita (Naso), rabbitfish<br />
angelfish (Pomacanthus)<br />
butterflyfish (Chaetodontus)<br />
damselfish (Chromis)<br />
anthiinid (Anthias)<br />
bangus fry (Chanos chanos)<br />
Looc, Occidental Mindoro<br />
dilis (Stolephorus)<br />
talakitok (Carangoides)<br />
pusit (Sepioteuthis, Loligo)<br />
matambaka (Selar)<br />
lapu-lapu (live groupers)<br />
maya-maya (Lutjanus)<br />
angelfish (Pomacanthus)<br />
butterflyfish (Chaetodontus)<br />
damselfish (Chromis)<br />
anthiinid (Anthias)<br />
bangus fry (Chanos chanos)<br />
basnig (bag net), lambat<br />
pandulong (gill net), scissor net<br />
lambat pante (gill net)<br />
lambat pante (gill net)<br />
hayhay (surface long line)<br />
hayhay (surface long line)<br />
lambat pante (gill net)<br />
kawil (hook and line), pana<br />
(spear)<br />
hayhay (surface long line)<br />
pamanos (squid jig)<br />
hand nets (barrier net)<br />
kawil (hook and line)<br />
hayhay (long line)<br />
lambat (gill net)<br />
pana (spear)<br />
pamanos (squid jig)<br />
lambat pante (gill net)<br />
kawil (hook and line)<br />
kawil (hook and line)<br />
pana (spear)<br />
basnig (bag net)<br />
kawil (hook and line)<br />
basnig (bag net), lambat<br />
(gill net)<br />
pante (gill net)<br />
lambat (gill net)<br />
lambat (gill net), kawil<br />
(hook and line)<br />
kawil (hook and line), bubo<br />
(trap), pana (spear), lambat<br />
(gill net)<br />
hand nets (w/ compressor)<br />
hand nets (w/ compressor)<br />
hand nets (w/ compressor)<br />
hand nets (w/ compressor)<br />
scoop nets<br />
basnig (bag net), lambat<br />
pandilis (anchovies), gill<br />
nets<br />
kawil (hook and line)<br />
kawil (hook and line), pana<br />
(spear)<br />
hand nets (w/ compressor)<br />
hand nets (w/ compressor)<br />
hand nets (w/ compressor)<br />
hand nets (w/ compressor)<br />
scoop nets<br />
3 (high)<br />
3 (high)<br />
1 (low)<br />
1 (low)<br />
2 (medium)<br />
2 (medium)<br />
1 (low)<br />
1 (low)<br />
1 (low)<br />
1 (low)<br />
1 (low)<br />
1 (low)<br />
1 (low)<br />
1 (low)<br />
1 (low)<br />
1 (low)<br />
1 (low)<br />
1 (low)<br />
1 (low)<br />
1 (low)<br />
1 (low)<br />
1 (low)<br />
1 (low)<br />
medium<br />
medium<br />
medium<br />
medium<br />
medium<br />
medium<br />
medium to high<br />
medium to high<br />
medium to high<br />
medium to high<br />
medium<br />
medium<br />
high<br />
high<br />
high<br />
high<br />
high<br />
medium<br />
medium<br />
medium<br />
low to medium<br />
low to medium<br />
low to medium<br />
medium to high<br />
medium to high<br />
low to medium<br />
low to medium<br />
medium<br />
medium<br />
medium<br />
medium<br />
medium<br />
medium<br />
low to medium<br />
low to medium<br />
medium<br />
medium<br />
medium<br />
medium<br />
medium<br />
medium<br />
low to medium<br />
low to medium<br />
low to medium<br />
1 (low) low to medium low to medium<br />
2 (medium)<br />
1 (low)<br />
1 (low)<br />
1 (low)<br />
1 (low)<br />
2 (medium)<br />
2 (medium)<br />
1 (low)<br />
1 (low)<br />
2 (medium)<br />
1 (low)<br />
3 (high)<br />
3 (high)<br />
1 (low)<br />
3 (high)<br />
2 (medium)<br />
1 (low)<br />
1 (low)<br />
medium<br />
medium<br />
medium to high<br />
medium to high<br />
medium<br />
medium<br />
medium to high<br />
high<br />
medium<br />
medium<br />
medium<br />
medium<br />
medium<br />
no data<br />
low to medium<br />
low to medium<br />
low to medium<br />
low to medium<br />
medium<br />
low to medium<br />
low to medium<br />
low to medium<br />
low to medium<br />
low to medium<br />
medium<br />
medium to high<br />
medium<br />
low to medium<br />
low to medium<br />
medium<br />
medium<br />
high<br />
high<br />
low to medium<br />
low to medium<br />
low to medium<br />
low to medium<br />
low to medium<br />
medium<br />
<br />
38
chapter 1 • vulnerability assessment <strong>of</strong> marine ecosystems and fisheries to climate change: vulnerability<br />
Table 22. Vulnerability assessment <strong>of</strong> <strong>the</strong> fisheries based on number <strong>of</strong> gear types per habitat type.<br />
Habitat type<br />
Caught by sand/ estuarine Vulnerability<br />
Species/taxa gear type reef beach mangrove seagrass creeks/rivers pelagic index<br />
Mabini, Batangas<br />
dulong (Spratelloides)<br />
dilis (Engraulis)<br />
alumahan (Rastrelliger)<br />
tambakol (Katsuwonus)<br />
galunggong (Decapterus)<br />
matambaka (Selar)<br />
lapu-lapu (groupers)<br />
maya-maya (Lutjanus)<br />
kanoping (Lethrinus)<br />
bisugo (nemipterids)<br />
tulingan (Auxis)<br />
pusit (Sepioteuthis, Loligo)<br />
No. <strong>of</strong> gears per habitat<br />
Level <strong>of</strong> fishing effort<br />
<strong>Verde</strong> <strong>Island</strong>, Batangas City<br />
angelfish (Pomacanthus)<br />
butterflyfish (Chaetodontus)<br />
damselfish (Chromis)<br />
anthiinid (Anthias)<br />
lion fish (Pterois)<br />
lapu-lapu (groupers)<br />
manites (Upeneus)<br />
galunggong (Decapterus)<br />
alumahan (Rastrelliger)<br />
dalagang bukid (Caesio)<br />
mulmol (Scarus)<br />
labahita (Naso)<br />
pusit (Sepioteuthis, Loligo)<br />
No. <strong>of</strong> gears per habitat<br />
Level <strong>of</strong> fishing effort<br />
basnig (bag net), lambat<br />
pandulong (gill net), scissor net<br />
lambat pante (gill net)<br />
lambat pante (gill net)<br />
hayhay (surface long line)<br />
hayhay (surface long line)<br />
lambat pante (gill net)<br />
kawil (hook and line), pana (spear)<br />
hayhay (surface long line)<br />
pamanos (squid jig)<br />
hand nets (barrier net)<br />
kawil (hook and line)<br />
hayhay (long line)<br />
lambat (gill net)<br />
pana (spear)<br />
pamanos (squid jig)<br />
1<br />
2<br />
1<br />
4 (high)<br />
medium<br />
to high<br />
1<br />
1<br />
1<br />
1<br />
1<br />
1<br />
6 (high)<br />
medium<br />
1<br />
1 (low)<br />
low<br />
1<br />
1 (low)<br />
low<br />
1<br />
1 (low)<br />
low to<br />
medium<br />
1<br />
1<br />
2 (medium)<br />
medium<br />
4<br />
1<br />
5 (high)<br />
medium<br />
to high<br />
1<br />
1<br />
2 (medium)<br />
medium<br />
medium to high<br />
medium<br />
Table 23. Matrix <strong>of</strong> prospective responses to climate change impacts highlighting <strong>the</strong> interacting effects between habitats and fisheries.<br />
Responses<br />
Climate<br />
estuaries/<br />
change impact seagrass seaweeds reef fish mangroves creeks/rivers pelagic groupers<br />
increased sea<br />
surface<br />
temperature<br />
can be approached<br />
similar to corals/diversity<br />
<strong>of</strong> associated organisms;<br />
associated fishereies, e.g.,<br />
siganids, and high value<br />
invertebrate fisheries,<br />
reduced catch in some<br />
finfish but may have a<br />
shift to detritivores and<br />
omnivores<br />
phenological<br />
characteristic disrupted;<br />
change in overall<br />
community structure;<br />
slower growth and lower<br />
diversity; low fecundity <strong>of</strong><br />
species<br />
reproductive output,<br />
timing, survivorship <strong>of</strong><br />
recruits; recruitment lag/<br />
failure; shorter larval<br />
duration; abundance <strong>of</strong><br />
coral dependent species<br />
will be reduced following<br />
coral bleaching events<br />
and decreased structural<br />
complexity<br />
decreased seedling<br />
production, survivorship<br />
and recruitment; lower<br />
recruitment regeneration;<br />
phenological<br />
characteristics disrupted;<br />
associated fisheries<br />
will be reduced for<br />
temperature dependent<br />
reproductive output<br />
see mangroves and<br />
associated fisheries<br />
especially in relation to<br />
ontogenetic habitats<br />
shifts and how adjacent<br />
habitats can be seen in<br />
exacerbated/synergistic<br />
negative effects,<br />
overfishing, and habitat<br />
fragmentation/loss<br />
shorter larval duration;<br />
decreases survivorship<br />
due to low food<br />
availability; alter<br />
reproductive periodicity<br />
and eventual recruitment<br />
survivorship leading<br />
changes in fisheries<br />
productivity<br />
shorter larval duration;<br />
enhanced recruitment<br />
variability; recruitment<br />
will be affected following<br />
decreased structural<br />
complexity via coral<br />
bleaching ;<br />
reproductive output and<br />
timing <strong>of</strong> reproduction will<br />
be affected, especially<br />
spawning aggregations<br />
sea level rise<br />
shallow species will be<br />
most sensitive to change<br />
and will be vulnerable;<br />
species found growing on<br />
<strong>the</strong> slopes can adjust to<br />
changing depth<br />
can be well adapted to<br />
changes in sea levels<br />
(community level/change<br />
in community structure)<br />
inundation <strong>of</strong> mangroves<br />
and associated species<br />
(fauna); reduce conditions<br />
for settlement availability<br />
as nursery grounds for<br />
o<strong>the</strong>r species; change in<br />
sedimentation dynamics;<br />
substrate erosion<br />
increase storm<br />
intensity and<br />
frequency<br />
• storm paths/<br />
tracks<br />
• storm surge<br />
disrupt recruitment events<br />
<strong>of</strong> associated faunal<br />
species; decreases<br />
survivorship<br />
change in substrate<br />
composition leading<br />
to changes in algal<br />
community structure;<br />
burial and scouring<br />
topographic complexity/<br />
habitat refuge<br />
(composition, biomass,<br />
density); this can lead<br />
to reduced fisheries<br />
productivity<br />
disrupt recruitment events<br />
<strong>of</strong> associated faunal<br />
species (e.g., groupers,<br />
snappers, jacks);<br />
decreases survivorship<br />
propagules dislodged<br />
prematurely; uprooting<br />
<strong>of</strong> mature trees along<br />
shoreline<br />
decreases survivorship<br />
<strong>of</strong> recently recruited<br />
associated faunal species<br />
(e.g., groupers, snappers,<br />
sprats, anchovies, bangus<br />
fry)<br />
affect recruitment due to<br />
loss <strong>of</strong> habitat availability<br />
for settlement (e.g.,<br />
decresed structural<br />
complexity)<br />
rainfall<br />
• changes in<br />
salinity<br />
• increased<br />
sedimentation<br />
change in water quality<br />
will have changes in light<br />
requirements/availability<br />
only a few species are<br />
stenohalines species that<br />
can survive<br />
burial and mortality<br />
can lead to habitat<br />
modification and reduce<br />
diversity and abundance;<br />
this reduces fisheries<br />
production<br />
have salinity regulatory<br />
function<br />
change in sedimentation<br />
dynamics<br />
affect recruitment<br />
<strong>of</strong> associated faunal<br />
species; decreases <strong>the</strong>ir<br />
survivorship<br />
nutrient increases may<br />
lead to blooms<br />
ocean<br />
acidification<br />
will increase CO 2<br />
;<br />
may favor seagrass<br />
photosyn<strong>the</strong>sis but may<br />
not happen if <strong>the</strong> system<br />
is already distressed<br />
39
climate change vulnerability assessment <strong>of</strong> <strong>the</strong> verde island passage, philippines<br />
mangroves will affect <strong>the</strong> aforementioned attributes<br />
<strong>of</strong> <strong>the</strong> associated fauna which include high value<br />
target species (e.g., siganids, groupers, snappers).<br />
For sea level rise, some habitats such as mangroves<br />
will be inundated that will reduce available areas for<br />
recruitment <strong>of</strong> associated fauna that have fisheries<br />
value. In coral reefs, species on shallower parts (e.g.,<br />
reef flats) will be affected compared to those on reef<br />
slopes. Increase in frequency and intensity <strong>of</strong> storms<br />
can greatly affect recruitment <strong>of</strong> target species through<br />
reduction <strong>of</strong> suitable sites for recruitment and reduction<br />
in abundance and species diversity due to habitat loss<br />
and decreased habitat complexity. Increase rainfall may<br />
result in over supply <strong>of</strong> nutrients from <strong>the</strong> land and may<br />
trigger algal blooms or will lead to hypoxic conditions<br />
that may affect existing aquaculture or mariculture.<br />
The fisheries that are most vulnerable are those<br />
involving fishes that need different habitats throughout<br />
<strong>the</strong>ir life stages. For example, Mabini and Lubang/Looc<br />
have grouper and snapper fisheries. These fishes make<br />
use <strong>of</strong> estuaries, mangroves, seagrasses, corals, and<br />
<strong>the</strong> pelagic realm during <strong>the</strong> different stages in <strong>the</strong>ir life.<br />
Vulnerable areas vs. ecologically critical<br />
or sensitive areas<br />
Aside from vulnerable areas which are seen in <strong>the</strong><br />
context <strong>of</strong> vulnerability relative to <strong>the</strong> aspect <strong>of</strong> climate<br />
change, it is crucial to determine ecologically critical<br />
or sensitive areas (e.g., coral reefs, seagrasses, and<br />
mangrove areas) and o<strong>the</strong>r ecological functions (e.g.,<br />
turtle nesting beaches, nursery and feeding areas <strong>of</strong><br />
important fisheries and/or threatened species). This is<br />
important in complying with Philippine environmental<br />
laws as human activities (or at a scale <strong>of</strong> development<br />
such as over a 5 hectare area or a building higher<br />
than 4 floors) that are threatening <strong>the</strong>se critical<br />
habitats shall require a mandatory full Environmental<br />
Impact Assessment (EIA). Considering that <strong>the</strong>re are<br />
uncertainties and data gaps in predicting more specific<br />
vulnerabilities, this is ano<strong>the</strong>r precautionary step to<br />
highlight <strong>the</strong> complementarity <strong>of</strong> vulnerability and<br />
adaptation insights.<br />
40
Recommendations<br />
chapter 1 • vulnerability assessment <strong>of</strong> marine ecosystems and fisheries to climate change: recommendations<br />
Apart from <strong>the</strong> threats <strong>of</strong> global climate change, <strong>the</strong><br />
marine resources in <strong>the</strong> <strong>Verde</strong> <strong>Island</strong> <strong>Passage</strong> are<br />
already in a tremendous amount <strong>of</strong> stress due to<br />
various human pressures. The VIP is a major fishing<br />
ground. Over-fishing and use <strong>of</strong> destructive fishing<br />
methods disrupts <strong>the</strong> normal functions <strong>of</strong> <strong>the</strong> coral<br />
reef ecosystem. They reduce populations <strong>of</strong> key reef<br />
organisms ei<strong>the</strong>r by direct extraction <strong>of</strong> coral and<br />
reef fish species or by destruction <strong>of</strong> corals during<br />
fishing (Licuanan and Gomez 2000, Wilkinson 2004,<br />
Deocadez et al. 2009). The passage is also a major<br />
navigational and shipping lane, and is constantly<br />
under threat by oil spills and strandings. Similarly, it is<br />
also surrounded by various industries such as ports,<br />
oil refineries etc., which pollutes, increases nutrient<br />
influx and sedimentation in reef areas. Pollution,<br />
sedimentation, and nutrients affect <strong>the</strong> survival <strong>of</strong> coral<br />
communities ei<strong>the</strong>r by smo<strong>the</strong>ring corals and preventing<br />
coral recruitment (McClanahan and Obura 1997)<br />
or by promoting growth <strong>of</strong> macro-algae and o<strong>the</strong>r<br />
invertebrates (McCook 1999, Nugues and Roberts<br />
2003). O<strong>the</strong>r pressures impacting <strong>the</strong> coral reefs in <strong>the</strong><br />
VIP is tourism, mining, coastal settlement, and o<strong>the</strong>r<br />
land-based activities.<br />
Adaptation mechanisms would require that <strong>the</strong> present<br />
CRM programs be more tightly integrated through<br />
establishing knowledge based communities. These<br />
would involve multiple stakeholders working toge<strong>the</strong>r<br />
and <strong>the</strong> incipient MPA network in <strong>the</strong> VIP would be a<br />
good starting point. The various CRM working groups<br />
would also need to engage with each o<strong>the</strong>r through<br />
inter-LGU arrangement joint fisheries law enforcement<br />
teams (FLET) and bay management councils or VIP<br />
level alliances can be formed.<br />
Improving management through good CRM governance<br />
processes where climate adaptation systems are<br />
mainstreamed is imperative. The fisheries ecosystem<br />
approach to management will need to be put in place<br />
as natural links to <strong>the</strong> present conservation efforts with<br />
<strong>the</strong> tourism industry. Reduction <strong>of</strong> prevailing threats<br />
such as illegal and destructive fishing, emerging<br />
pollution, and habitat degradation from urban and<br />
industrial development must also be addressed.<br />
Environmental concerns will not only marginalize fishers<br />
and <strong>the</strong>ir fishing grounds, exacerbate <strong>the</strong> impending<br />
climate change impacts but will jeopardize <strong>the</strong> future <strong>of</strong><br />
our next generations.<br />
Since <strong>the</strong> VIP is <strong>the</strong> area where <strong>the</strong> State <strong>of</strong> <strong>the</strong> Coast<br />
has been piloted in <strong>the</strong> province <strong>of</strong> Batangas, <strong>the</strong><br />
opportunity to scale up <strong>the</strong>se efforts and at <strong>the</strong> same<br />
integrate within an ICM approach is imperative. As<br />
mentioned earlier <strong>the</strong> research and development and<br />
extension arena would need to involve a monitoring<br />
and evaluation, response and feedback program that<br />
mainstreams climate change. Linking with <strong>the</strong> ICE<br />
CREAM program would be an immediate next step<br />
toge<strong>the</strong>r with developing a cadre <strong>of</strong> local expertise from<br />
<strong>the</strong> various higher education institutions, would be an<br />
opportunity not to miss. Highly qualified expertise such<br />
those in <strong>the</strong> De La Salle University Bro<strong>the</strong>r Shields<br />
Marine Lab are available and are part <strong>of</strong> <strong>the</strong> ICE<br />
CREAM program.<br />
Research and monitoring imperatives<br />
There are considerable gaps in <strong>the</strong> fisheries pr<strong>of</strong>iling<br />
and <strong>the</strong> related targeted research and monitoring<br />
concerns. The priority interactive concerns <strong>of</strong> <strong>the</strong><br />
ecological and social systems are necessary to be<br />
integrated into an adaptation plan with its adaptive<br />
management approach.<br />
• Incorporating an adaptive management approach<br />
would mean that <strong>the</strong> overall management framework<br />
is integrated into an overarching context and<br />
governance process that will be able to provide<br />
timely interventions with <strong>the</strong> appropriate monitoring<br />
and evaluation plan.<br />
• Fisheries pr<strong>of</strong>iling using <strong>the</strong> FISH BE (Fisheries<br />
and Bio-economic model) framework approach to<br />
link effort regulation, MPA, and pollution abatement,<br />
among o<strong>the</strong>rs.<br />
• Climate change enhanced research on target life<br />
history studies and monitoring to provide inputs to<br />
an ecosystem approach to fisheries management<br />
and evaluate exacerbating effects e.g., collaborate<br />
with <strong>the</strong> Department <strong>of</strong> Science and Technology<br />
(DOST) funded ICE CREAM (Integrated Coastal<br />
Enhancement: Coastal Research, Evaluation and<br />
Adaptive Management) program. An opportunity<br />
whereby <strong>the</strong> MPA network provides social network<br />
insights that also derives biophysical information<br />
from an integrated monitoring <strong>of</strong> governance,<br />
ecological and social and economic indicators.<br />
• Determine Environmental Impact Assessment (EIA)<br />
priority areas which highlights mitigating impacts<br />
from coastal and marine development activities<br />
(e.g., foreshore and navigation) so as to determine<br />
an overall integrated coastal management approach<br />
to <strong>the</strong> VIP incorporating climate change and<br />
threatened species concerns. This should have a<br />
close link with <strong>the</strong> social and economic research<br />
imperatives, e.g., reducing threats from unplanned<br />
development trends and improving compliance<br />
through market and non-market based incentives.<br />
41
climate change vulnerability assessment <strong>of</strong> <strong>the</strong> verde island passage, philippines<br />
• Results should be reported regularly, e.g., no longer<br />
than for every relevant period such as a monsoon,<br />
or as needed as when <strong>the</strong>re is an impending<br />
catastrophic or disaster event. Also, <strong>the</strong> state <strong>of</strong><br />
<strong>the</strong> coasts mandates required in EO 533 is ano<strong>the</strong>r<br />
venue for reporting and feedback and to engage<br />
in adjustments and mainstreaming lessons learned<br />
into policies, ordinances, and action plans.<br />
• Changes in shoreline positions can now be easily<br />
established due to <strong>the</strong> availability <strong>of</strong> satellite<br />
images. However, what <strong>the</strong> time series <strong>of</strong> images<br />
can define are only snapshots <strong>of</strong> changes.<br />
Information on possible magnitude <strong>of</strong> erosion due<br />
to a single or series <strong>of</strong> storms or <strong>the</strong> pace <strong>of</strong> a<br />
subsequent recovery can only be captured through<br />
monitoring and partly through systematic interviews<br />
<strong>of</strong> long-time coastal residents. The high variability<br />
<strong>of</strong> coastal systems in <strong>the</strong> VIP corridor requires<br />
localized studies. In areas with very narrow coastal<br />
plains such as in coral reef areas, images with<br />
resolution better than 30 meters are required and<br />
field surveys are vital.<br />
• Since <strong>the</strong> sediments <strong>of</strong> beaches associated with<br />
coral reefs are biogenic in origin, identification<br />
<strong>of</strong> <strong>the</strong> type and <strong>the</strong>ir sources are also needed.<br />
Identification <strong>of</strong> <strong>the</strong> drivers <strong>of</strong> shoreline change<br />
requires both regional and site specific studies<br />
and retracing <strong>of</strong> climate, oceanographic, biologic,<br />
geologic, and land use changes.<br />
• Due to <strong>the</strong> limited information available on <strong>the</strong><br />
condition <strong>of</strong> seagrass beds around VIP, assessment<br />
on <strong>the</strong> impacts <strong>of</strong> climate change on this ecosystem<br />
is incomplete. Information on areas covered by<br />
seagrasses, demographic and recruitment-mortality<br />
will be most useful in projecting <strong>the</strong> impact <strong>of</strong><br />
climate change in any given area<br />
• Eutrophication was identified as an exacerbating<br />
factor to coastal habitat vulnerability. Delivery <strong>of</strong><br />
nutrients from various land-based anthropogenic<br />
activities need to be identified in order to come up<br />
with appropriate land-use management options.<br />
• Sediment and nutrient delivery are not necessarily<br />
locally-derived. Far-fetched sources, especially<br />
relevant during extreme precipitation and storm<br />
events, also need to be determined. This can be<br />
achieved using fine-scale particle tracking with<br />
multiple release points under different climate<br />
scenarios.<br />
• The same particle-tracking, modified to suit specific<br />
species, can also be used to study connectivity<br />
within and from outside <strong>the</strong> VIP. This can be used<br />
as one <strong>of</strong> <strong>the</strong> tools in identifying areas that need to<br />
be protected from a regional point-<strong>of</strong>-view.<br />
• Different extreme events were shown to affect <strong>the</strong><br />
health <strong>of</strong> habitat and fisheries. However, currently<br />
lacking are on-<strong>the</strong>-ground measurements <strong>of</strong><br />
recruitment failures due to episodic events.<br />
• The philosophical and pragmatic question is which<br />
general type <strong>of</strong> reef system—<strong>the</strong> areas that are used<br />
to variability or <strong>the</strong> areas that have been always<br />
warm—are more susceptible to future climate<br />
change. There is a need to examine <strong>the</strong> species<br />
(seagrass, coral, coral-zooxanthallae symbiont) that<br />
have survived repetitive or extreme <strong>the</strong>rmal anomaly<br />
and factor <strong>the</strong>se in management and rehabilitation<br />
plans <strong>of</strong> coastal habitats.<br />
• O<strong>the</strong>r exacerbating events like crown-<strong>of</strong>-thorns<br />
break-out should also be documented.<br />
• Ocean acidification trends and projections is a gap<br />
<strong>of</strong> special concern.<br />
Scenarios for adaptation<br />
Areas that suggest that adaptation measures are<br />
imperative shall be those which are crucial to marine<br />
biodiversity, <strong>the</strong> life histories <strong>of</strong> important fisheries<br />
species, and human well-being.<br />
For biodiversity and fisheries, <strong>the</strong>se areas would be<br />
high candidate sites for expanding sizes or establishing<br />
areas as marine protected areas (MPA). This will not<br />
only help in <strong>the</strong> conservation <strong>of</strong> existing flora and<br />
fauna but also in <strong>the</strong> replenishment <strong>of</strong> fisheries stocks<br />
by regulating fishing effort. In addition to MPA, it is<br />
imperative that adoption <strong>of</strong> access and use rights<br />
fisheries management interventions are put in place<br />
such as close and open seasons, gear regulations and<br />
effort controls combined with access incentives linked<br />
to stewardship e.g., reserves related to enhancement<br />
and sea ranching <strong>of</strong> highly valued invertebrates species.<br />
For human well-being, <strong>the</strong>se areas would also be sites<br />
which deliver multiple services to <strong>the</strong> community not<br />
only as source <strong>of</strong> livelihood but also provide protection<br />
from climate-related hazards.<br />
Recommendations and next steps<br />
The fisheries ecosystem approach to management<br />
will need to put in place as natural links to <strong>the</strong><br />
present conservation efforts with <strong>the</strong> tourism industry.<br />
Environmental concerns will not only marginalize fishers<br />
and <strong>the</strong>ir fishing grounds, exacerbate <strong>the</strong> impending<br />
climate change impacts but will jeopardize <strong>the</strong> future <strong>of</strong><br />
our next generations.<br />
The following are key strategies that will support efforts<br />
in moving forward a strategic conservation plan that<br />
will harmonize with a sustainable fisheries management<br />
agenda for <strong>the</strong> VIP consistent with a SSS and <strong>the</strong><br />
Priority Biodiversity Conservation in <strong>the</strong> <strong>Philippines</strong><br />
(e.g., Ong et al. 2002).<br />
42
chapter 1 • vulnerability assessment <strong>of</strong> marine ecosystems and fisheries to climate change: recommendations<br />
Adaptation mechanisms would require that <strong>the</strong> present<br />
CRM programs are more tightly integrated through<br />
establishing knowledge-based communities.<br />
• These would involve multiple stakeholders working<br />
toge<strong>the</strong>r and <strong>the</strong> incipient MPA network in <strong>the</strong><br />
<strong>Verde</strong> <strong>Island</strong> <strong>Passage</strong> (VIP) would be a good<br />
starting point. The various CRM working groups<br />
would also need to engage with each o<strong>the</strong>r<br />
through inter-LGU arrangement joint fisheries law<br />
enforcement teams (FLET) and bay management<br />
councils or VIP level alliances can be formed.<br />
• Since <strong>the</strong> VIP is <strong>the</strong> area where <strong>the</strong> state <strong>of</strong> <strong>the</strong><br />
coast has been piloted in <strong>the</strong> province <strong>of</strong> Batangas,<br />
<strong>the</strong> opportunity to scale up <strong>the</strong>se efforts and at<br />
<strong>the</strong> same integrate within an ICM approach is<br />
imperative. As mentioned earlier, <strong>the</strong> research and<br />
development and extension areas would need a<br />
monitoring and evaluation program, and a response<br />
and feedback program that mainstreams climate<br />
change. Improving management effectiveness<br />
through MPA network complementation with<br />
fisheries management (e.g., grow-out <strong>of</strong> group fry<br />
and “dulong” in conjunction with o<strong>the</strong>r aquarium),<br />
and Lubang and invertebrate fishery (e.g., in areas<br />
with wide reef flats such as Lian and Calatagan<br />
areas, tourism certification and or link with tourism).<br />
• Linking with <strong>the</strong> ICE CREAM program would be<br />
an immediate next step toge<strong>the</strong>r with developing<br />
a cadre <strong>of</strong> local expertise from <strong>the</strong> various<br />
higher education institutions (HEI), would be an<br />
opportunity not to miss. Highly qualified on-site<br />
expertise such those in <strong>the</strong> De La Salle University<br />
Bro<strong>the</strong>r Shields Marine Lab are available and are<br />
part <strong>of</strong> <strong>the</strong> ICE CREAM program—VIP network<br />
establishment with UB and BSU for fisheries and<br />
Biodiversity monitoring; Provincial MPA municipal<br />
cluster networks can be established to provide a<br />
venue to establish joint enforcement, M&E and IEC<br />
teams wherein <strong>the</strong>y have some ecological basis<br />
for <strong>the</strong>ir clustering e.g., adjacent boundaries and<br />
circulation connectivity.<br />
Based on available literature on <strong>the</strong> interconnectivity <strong>of</strong><br />
mangrove, seagrass and coral reef, protecting adjacent<br />
ecosystems may increase <strong>the</strong> resilience <strong>of</strong> <strong>the</strong>se<br />
ecosystems to <strong>the</strong> impacts, including that <strong>of</strong> climate<br />
change.<br />
• This phenomenon <strong>of</strong> interconnectivity resilience is<br />
exhibited by sites where all <strong>of</strong> <strong>the</strong> coastal habitats<br />
can be persistently found (i.e., in Calatagan,<br />
Batangas and San Juan, Batangas—also referred<br />
to as Batangas East—and in a lesser degree in<br />
Wawa-Paluan, Mindoro Occidental and Puerto<br />
Galera-Naujan, Oriental Mindoro).<br />
• Moreover, <strong>the</strong> concept <strong>of</strong> interconnectivity resiliency<br />
has consequence on fisheries with fish that need<br />
different habitats throughout <strong>the</strong>ir life stages (such<br />
as snappers and groupers) being most vulnerable.<br />
For example, <strong>the</strong> existence <strong>of</strong> <strong>the</strong>se targeted<br />
fisheries in Wawa-Paluan and Puerto Galera-Naujan<br />
is <strong>the</strong>refore partially buffered whereas those in<br />
Mabini and Lubang are more vulnerable. Measures<br />
must <strong>the</strong>refore be taken for habitat protection in<br />
Mabini and Lubang for <strong>the</strong> sustainability <strong>of</strong> <strong>the</strong><br />
snapper and grouper fisheries in <strong>the</strong>se sites.<br />
• In sites that have shown significant adaptive<br />
capacity and at <strong>the</strong> same time in sites where <strong>the</strong><br />
fisheries were found vulnerable, measures must<br />
be taken to reduce <strong>of</strong> prevailing threats such as<br />
illegal and destructive fishing, emerging pollution<br />
and habitat degradation from urban and industrial<br />
development.<br />
• In addition, given that sea level will accelerate in <strong>the</strong><br />
coming years and that storms are likely to increase<br />
in frequency and possibly streng<strong>the</strong>n, <strong>the</strong> natural<br />
buffers to sea level rise and impact <strong>of</strong> large waves,<br />
such as coral reefs and mangroves, should be<br />
protected and rehabilitated.<br />
• Areas fronting <strong>the</strong> South China Sea and <strong>the</strong><br />
Sibuyan Sea may have a relatively higher storm<br />
surge potential compared to those within <strong>the</strong> VIP.<br />
The wave models show that in particular <strong>the</strong> areas<br />
exhibiting large bottom orbital velocities are <strong>the</strong><br />
coasts facing Tayabas Bay, <strong>the</strong> nor<strong>the</strong>rn coast<br />
<strong>of</strong> Lubang and possibly <strong>the</strong> western coast <strong>of</strong> <strong>the</strong><br />
Calatagan Peninsula.<br />
Deforestation and extensive agriculture in <strong>the</strong><br />
watersheds, long steep slopes, and presence <strong>of</strong><br />
numerous faults, high seismicity, and volcanoes all<br />
promote a high sediment yield. These potential will be<br />
more intense during extreme wea<strong>the</strong>r events.<br />
• In some areas, this high sediment yield has resulted<br />
to rapid accretion. However, it should be noted<br />
that this newly prograded lands, in addition to<br />
existing low lying areas inland—presently occupied<br />
by wetlands, fishponds, rice fields and coconut<br />
plantations, are evaluated to be <strong>the</strong> most vulnerable<br />
to marine inundation (e.g., areas such as Nasugbu<br />
and Balayan that experienced rapid accretion in<br />
recent years, are <strong>the</strong> most vulnerable to coastal<br />
inundation; a 1 meter rise <strong>of</strong> sea level will already<br />
result to inundated <strong>of</strong> about 175 ha in Nasugbu and<br />
199 ha in Balayan).<br />
• Instead <strong>of</strong> utilizing <strong>the</strong> newly prograded lands in <strong>the</strong><br />
VIP for various development, <strong>the</strong>se can instead be<br />
used by <strong>the</strong> LGUs and national agencies as buffers<br />
to erosion and action <strong>of</strong> large waves. Greenbelts,<br />
<strong>of</strong> <strong>the</strong> appropriate assemblage, can be established<br />
in <strong>the</strong>se newly prograded lands. Wide mangrove<br />
43
climate change vulnerability assessment <strong>of</strong> <strong>the</strong> verde island passage, philippines<br />
plains will also reduce <strong>the</strong> level <strong>of</strong> nutrients and<br />
sediments entering <strong>the</strong> sea and create nursery<br />
habitats for fisheries.<br />
• Moreover, although <strong>the</strong> high sediment yield <strong>of</strong><br />
watersheds has led to accretion, it is likely that it<br />
has played a large role in <strong>the</strong> degradation <strong>of</strong> coral<br />
reef ecosystems and in <strong>the</strong> decline <strong>of</strong> coastal and<br />
<strong>of</strong>fshore fisheries. In <strong>the</strong> formulation <strong>of</strong> mitigation<br />
and adaptation measures, this link between <strong>the</strong><br />
marine ecosystem and <strong>the</strong> watershed should be<br />
considered.<br />
Watershed sediments ending at <strong>the</strong> coast leads to<br />
coastal degradation. This is fur<strong>the</strong>r exacerbated by<br />
erosion along <strong>the</strong> coast caused about by human<br />
modifications such as inappropriate ports, quarrying,<br />
and removal <strong>of</strong> mangroves and seagrasses.<br />
• Location <strong>of</strong> ports need not only take into<br />
consideration <strong>the</strong> economic development but<br />
should position <strong>the</strong> ports in such as way as not to<br />
impede longshore sediment drift. Moreover, we<br />
advocate constructing open ports which allow<br />
water to flow in between pilings.<br />
• Stop stone mining. Give alternative livelihood (e.g.,<br />
<strong>the</strong> river mouth and flanks <strong>of</strong> Abra de Ilog show<br />
erosion <strong>of</strong> ~150 m between 2001 and 2009.<br />
Pebble picking activities is most likely contributing<br />
to, if not <strong>the</strong> main cause, <strong>of</strong> <strong>the</strong> erosion west <strong>of</strong> <strong>the</strong><br />
river mouth).<br />
• There is a need to educate people from various<br />
strata <strong>of</strong> <strong>the</strong> functions <strong>of</strong> mangroves and coral reefs<br />
towards <strong>the</strong> protection <strong>of</strong> <strong>the</strong> beach, e.g., erosion<br />
<strong>of</strong> about 200 m occurred along <strong>the</strong> mouth <strong>of</strong><br />
Kampungpong River in Batangas City. Removal <strong>of</strong><br />
<strong>the</strong> mangrove, large constructions and expansions<br />
<strong>of</strong> piers along <strong>the</strong> coast <strong>of</strong> Batangas City are likely<br />
linked to <strong>the</strong> erosion.<br />
• Development along <strong>the</strong> coasts and <strong>the</strong> plains<br />
should also consider <strong>the</strong> likely natural changes that<br />
can take place due to tectonics, volcanism and river<br />
dynamics (e.g., erosion along <strong>the</strong> Baco-Malaylay<br />
delta may have been triggered by liquefaction<br />
caused by <strong>the</strong> magnitude 7.1 earthquake on a<br />
segment <strong>of</strong> Lubang Fault, south <strong>of</strong> <strong>Verde</strong> <strong>Island</strong> on<br />
November 15, 1994).<br />
• A lot <strong>of</strong> coastal developments (including planting <strong>of</strong><br />
mangroves on seagrass beds) have been observed<br />
around Batangas that ei<strong>the</strong>r removes seagrasses<br />
or constructs barriers that influence <strong>the</strong> natural<br />
hydrology within <strong>the</strong> coastal areas. The latter makes<br />
<strong>the</strong> seagrasses around VIP more vulnerable to<br />
eutrophication caused by impediment <strong>of</strong> <strong>the</strong> flow <strong>of</strong><br />
water in <strong>the</strong>se areas.<br />
Early response and immediate<br />
management recommendations<br />
• Seasonal regulation <strong>of</strong> dulong, milkfish fry and o<strong>the</strong>r<br />
fry fishery with very minimal fishing during peak<br />
occurrence (based on lunar periodicity). This will<br />
reduce fishing mortality at <strong>the</strong> early life stages.<br />
• Establishment <strong>of</strong> fry-grow out schemes to enhance<br />
juvenile survivorship e.g., for grouper, bangus and<br />
high value invertebrates in conjunction with MPA<br />
buffer reserve area.<br />
• Gear effort control at varying habitat types (e.g., live<br />
fish collectors, fish corral deployment); establish<br />
incentives for regulating effort through certification<br />
schemes and targeting stakeholders for capacity<br />
building.<br />
• Stricter enforcement over illegal fishing practices<br />
(blastfishing, cyanide fishing, poaching) and<br />
capacity building for inter-hierarchical network<br />
enforcement teams and incentives for stewards and<br />
IEC for greater social pressures on “illegalistas”<br />
• Increase sizes <strong>of</strong> protected areas including o<strong>the</strong>r<br />
habitat types (e.g., mangroves, seagrasses,<br />
lagoons). Aside from fishery benefits, this<br />
mechanism will ensure good conditions <strong>of</strong><br />
protected areas, and <strong>the</strong>refore less sensitive to<br />
climate change. Identify areas for refugia and stock<br />
enhancement strategies.<br />
• Alternative livelihood (o<strong>the</strong>r economic/job<br />
opportunities) to fishing to reduce fishing pressure<br />
and o<strong>the</strong>r supplemental livelihood support (e.g.,<br />
training <strong>of</strong> invertebrate grow out on reserve areas)<br />
• Proper zonation <strong>of</strong> use <strong>of</strong> coastal waters (fishery<br />
zone, MPA, aquaculture zone, industry zone) as<br />
this will lower sensitivity <strong>of</strong> habitats and <strong>the</strong>refore<br />
vulnerability and reduce conflicting uses with<br />
clearer guidelines, ordinances and incentives per<br />
zone that incorporates climate considerations (e.g.,<br />
erosion, sea surface temperature, and siltation).<br />
44
References<br />
chapter 1 • vulnerability assessment <strong>of</strong> marine ecosystems and fisheries to climate change: references<br />
Allison E, Perry A, Badjeck MC, Adger N, Brown K, Conway D, Halls A,<br />
Pilling G, Reynolds J, Andrew N, Dulvy N. 2009. Vulnerability <strong>of</strong> national<br />
economies to <strong>the</strong> impacts <strong>of</strong> climate change on fisheries. Fish and<br />
Fisheries 10:173-196.<br />
Alongi, DM. 2008. Mangrove forests: Resilience, protection from tsunamis,<br />
and responses to global climate change. Estuarine, Coastal and Shelf<br />
Science 76:1-13.<br />
Arceo HO, Quibilan MCC, Alino PM, Licuanan WY, Lim G. 2001. Coral<br />
bleaching in <strong>the</strong> <strong>Philippines</strong>: coincident evidences <strong>of</strong> mesocale <strong>the</strong>rmal<br />
anomalies. Bull. Mar. Sci. 69(2): 579-594.<br />
Bernascek G. 1996. The role <strong>of</strong> fisheries in food security in <strong>the</strong> <strong>Philippines</strong>:<br />
A perspective study for <strong>the</strong> fisheries sector to <strong>the</strong> year 2010. Paper<br />
presented during <strong>the</strong> Second National Fisheries Policy Planning<br />
Conference, Cavite, <strong>Philippines</strong>.<br />
Brander KM. 2007. Global fish production and climate change. Proceedings<br />
to <strong>the</strong> National Academy <strong>of</strong> Sciences. 104(50):19709-19714.<br />
Brownman HI, Stergiou KI. 2004. Perspectives on ecosystem-based<br />
approaches to <strong>the</strong> management <strong>of</strong> marine resources. Mar. Ecol Prog. Ser.<br />
274:269-303.<br />
Buoywea<strong>the</strong>r Hurricane and Typhoon Tracking. Updated 25 June 2009.<br />
Retrieved 25 June 2009 <br />
Camargo SJ, Robertson AW, Gaffney SJ, Smyth P, Ghil M. 2007. Cluster<br />
Analysis <strong>of</strong> Typhoon Tracks. Part II: Large-Scale Circulation and ENSO.<br />
Journal <strong>of</strong> Climate 20:3654-3676.<br />
Campbell, S.J. et al. 2009. Photosyn<strong>the</strong>tic responses <strong>of</strong> seven tropical<br />
seagrasses to elevated seawater temperature. Journal <strong>of</strong> Experimental<br />
Marine Biology Ecology 330:455-468.<br />
Carpenter K, Springer VG. 2005. The center <strong>of</strong> <strong>the</strong> center <strong>of</strong> marine shore<br />
fish biodiversity: <strong>the</strong> Philippine <strong>Island</strong>s. Env. Biol. Fish. 72:467-480.<br />
Carpenter K, Abrar M, Aeby G, Aronson RA et al. 2008. One-third <strong>of</strong> <strong>the</strong><br />
reef-building corals face elevated extinction risk from climate change and<br />
local impacts. Science 321:560-563.<br />
Chavez FP, Ryan J, Lluch-Cota SE, Niquen MC. 2003. From anchovies to<br />
sardines and back: multidecadal change in <strong>the</strong> Pacific Ocean. Science<br />
299:217-221.<br />
Cheung WWL, Lam VWY, Sarmiento JL, Kearney K, Watson R, Pauly D.<br />
2009. Projecting global marine biodiversity impacts under climate change<br />
scenarios. Fish and Fisheries.<br />
City <strong>of</strong> Batangas. 2005. 2005–2014 Isla <strong>Verde</strong> CRM Plan.<br />
Conservation International <strong>Philippines</strong>. 2009. Scaling up from MPAs to<br />
Seascapes: lessons learned from <strong>the</strong> Sulu-Sulawesi. Quezon City. p. 7.<br />
Cooley, SR, Doney SC. 2009. Anticipating ocean acidification's economic<br />
consequences for commercial fisheries. Environ. Res. Lett. 4 (1 June<br />
2009) doi:10.1088/1748-9326/4/2/024007.<br />
Dahdouh-Guebas, F. et al. How effective were mangroves as a defense<br />
against <strong>the</strong> recent tsunami Current Biology 15 (12):443-447.<br />
Deocadez MP, Moleño EP, Arceo HO, Cabansag JP, Apurado JL, Mamauag<br />
SS, Villanoy CL, Aliño PM. 2009. Spatio-temporal patterns <strong>of</strong> juvenile and<br />
adult abundance and biomass <strong>of</strong> reef fishes in <strong>the</strong> Sulu Sea, <strong>Philippines</strong>.<br />
Proceedings <strong>of</strong> <strong>the</strong> 11th International Coral Reef Symposium, Ft.<br />
Lauderdale, Florida, 7-11 July 2008. Session number 22.860.<br />
Duarte CM et al. 1997. Response <strong>of</strong> a mixed <strong>Philippines</strong> seagrass meadow<br />
to experimental burial. Marine Ecology Progress Series 147:285-294.<br />
Engelhart SE et al. 2007. Mangrove pollen <strong>of</strong> Indonesia and its suitability as<br />
a sea-level indicator. Marine Geology 242 (2007):65–81.<br />
Fujimoto K, Miyagi T, Kikuchi T. 1995. Formative and maintainable<br />
mechanisms <strong>of</strong> mangrove habitats in Micronesia and <strong>the</strong> <strong>Philippines</strong>. In:<br />
Kikuchi, T. (Ed), Rapis Sea Level Rise and Mangrove Habitat. Institute for<br />
Basin Ecosystem Studies, Gifu University, Japan, pp. 9-18.<br />
Genito GE. et al. 2009. Baseline assessment <strong>of</strong> seagrass communities<br />
<strong>of</strong> Lubang <strong>Island</strong>, Occidental Mindoro. Conservation International,<br />
unpublished report.<br />
Gilman E et al. 2006. Pacific <strong>Island</strong> Mangroves in a Changing Climate and<br />
Rising Sea. UNEP Regional Seas Reports and Studies No. 179. United<br />
Nations Environment Programme, Regional Seas Programme, Nairobi,<br />
KENYA, 59pp.<br />
Gilman EL et al. 2008. Threats to mangroves from climate change<br />
and adaptation options. Aquatic Botany (2008), doi:10.1016/j.<br />
aquabot.2007.12.009.<br />
Han W, Moore AM, Levin J, Zhang B, Arango HG, Curchitser E, Di Lorenzo<br />
E, Gordon AL, Lin J. 2008. Seasonal surface ocean circulation and<br />
dynamics in <strong>the</strong> Philippine archipelago region during 2004-2008.<br />
Dynamics <strong>of</strong> Atmospheres and Oceans 802:1-24.<br />
Ho CH, Baik JJ, Kim JH, Gong DY, Sui CH. 2004. Interdecadal changes in<br />
summertime typhoon tracks. Journal <strong>of</strong> Climate17(9):1767-1776.<br />
Hoegh-Guldberg O. 1999. Climate change, coral bleaching and <strong>the</strong> future<br />
<strong>of</strong> <strong>the</strong> worlds coral reefs. Marine Freshwater Research. 50:839-866.<br />
Hoegh-Guldberg O, Mumby PJ, Hooten AJ, Steneck RS, Greenfield P,<br />
Gomez E, Harvell CD, Sale PF, Edwards AJ, Caldeira K, Knowlton<br />
N, Eakin CM, Iglesias-Prieto R, Muthiga N, Bradbury RH, Dubi A,<br />
Hatziolos ME. 2007. Coral reefs under rapid climate change and ocean<br />
acidification. Science 3129 (5857):1737-1742.<br />
Hulme M, Sheard N. 1999. Climate Change Scenarios for <strong>the</strong> <strong>Philippines</strong><br />
Climatic Research Unit, Norwich,UK, 6 pp.<br />
Imamura F, Synolakis CE, Gica E, Titov V, Listanco E, Lee HJ. 1995. Field<br />
Survey <strong>of</strong> <strong>the</strong> 1994 Mindoro <strong>Island</strong>, <strong>Philippines</strong> Tsunami. Pageoph Vol.<br />
144, No. 3/4: 875-890.<br />
IPCC 2007. Climate Change 2007: The physical science basis. Summary<br />
for policymakers. Intergovernmental Panel on Climate Change, Geneva<br />
18 p.<br />
Japan Meterological Agency. RSMC Best Track Data. Updated 21 June<br />
2009. Retrieved 21 June 2009 http://www.jma.go.jp/jma/jma-eng/jmacenter/rsmc-hp-pub-eg/besttrack.html.<br />
Lewis RR, Marshall MJ. 1997. Principles <strong>of</strong> successful restoration <strong>of</strong><br />
shrimp aquaculture ponds back to mangrove forests. Programa/resumes<br />
de Marcuba ’97, September 15/20, Palacio de Convenciones de La<br />
Habana, Cuba, 126pp.<br />
Lewis RR. 2009. Methods and criteria for successful mangrove forest<br />
restoration. In: Perillo, G.E., Wolanski, E., Cahoon, D.R., Brinson, M.M.<br />
(Eds), Coastal Wetlands: An Integrated ecosystem approach. Elsevier, pp<br />
787-800.<br />
Licuanan WY, Alino PM, Campos WL, Castillo GB, Juinio-Menez MA.<br />
2006. A decision support model for determining sizes <strong>of</strong> marine<br />
protected areas: biophysical considerations. Philipp Agric Scientist.<br />
89(1):34-47.<br />
Licuanan WY, Gomez ED. 2000. Philippine coral reefs, reef fishes and<br />
associated fisheries: Status and recommendations to improve <strong>the</strong>ir<br />
management. Global Coral Reef Monitoring Network. Australian Institute<br />
<strong>of</strong> Marine Science. 51 p.<br />
Lu<strong>the</strong>r DA, Greenberg R. 2009. Mangroves: a global perspective on <strong>the</strong><br />
evolution and conservation <strong>of</strong> <strong>the</strong>ir terrestrial vertebrates. Bioscience 59<br />
(7):602-612.<br />
McClanahan TR and Obura D. 1997. Sedimentation effects on shallow<br />
coral communities in Kenya. Journal <strong>of</strong> Experimental Marine Biology and<br />
Ecology. 209:103-122.<br />
McCook LJ. 1999. Macroalgae, nutrients and phase shifts on coral reefs:<br />
Scientific issues and management consequences for <strong>the</strong> Great Barrier<br />
Reef. Coral Reefs 18:357-367.<br />
McLeod E, Salm RV. 2006. Managing Mangroves for Resilience to Climate<br />
Change. IUCN, Gland, Switzerland. 64pp.<br />
Munday PL, Jones G, Pratchett M, Williams A. 2008. Climate change and<br />
<strong>the</strong> future for coral reef fishes. Fish and Fisheries 9:261-285.<br />
Municipality <strong>of</strong> Lian, Batangas. 2005. 2005–2014 Talim Bay CRM Plan.<br />
National Hurricane Center. NOAA National Wea<strong>the</strong>r Service. Updated 03<br />
Sep. 2009. Retrieved 04 Sep 2009, http://www.nhc.noaa.gov.<br />
Nugues MM, Roberts CM. 2003. Partial mortality in massive reef corals as<br />
an indicator <strong>of</strong> sediment stress on coral reefs. Marine Pollution Bulletin.<br />
46:314-323.<br />
Ong PS, Afuang LE, Rosell-Ambal RG. 2002. Philippine biodiversity<br />
conservation priorities: a second iteration <strong>of</strong> <strong>the</strong> National Biodiversity<br />
Strategy and Action Plan. DENR-PAWB, CI–<strong>Philippines</strong>, UP-CIDS, and<br />
FPE. Quezon City. 113 p.<br />
Perez RT et al. 1999. Climate change impacts and responses in <strong>the</strong><br />
<strong>Philippines</strong> coastal sector. Climate Research 12:97-107.<br />
Philippine Institute <strong>of</strong> Volcanology and Seismology. 1994. The 15 November<br />
1994 Mindoro Earthquake-Report <strong>of</strong> Investigation. Phivolcs Special<br />
Report No. 2.<br />
Pratchett M, Munday PL, Wilson SK et al. 2008. Effects <strong>of</strong> climateinduced<br />
coral bleaching on coral reef fishes: ecological and economic<br />
consequences. Oceanography and Marine Biology: An Annual Review.<br />
46:251-296.<br />
Primavera JH, Esteban JMA. 2008. A review <strong>of</strong> mangrove rehabilitation<br />
in <strong>the</strong> <strong>Philippines</strong>: successes, failures and future prospects. Wetlands<br />
Ecology and Management 16 (3):173-253.<br />
Provincial Government <strong>of</strong> Batangas and PEMSEA. 2008. State <strong>of</strong> <strong>the</strong><br />
coasts <strong>of</strong> Batangas Province. Partnerships in Environmental Management<br />
for <strong>the</strong> Seas <strong>of</strong> East Asia (PEMSEA), Quezon City. 119 p.<br />
45
climate change vulnerability assessment <strong>of</strong> <strong>the</strong> verde island passage, philippines<br />
Pullen J, Doyle JD, May P, Chavanne C, Flament P, Arnone RA. 2008.<br />
Monsoon surges trigger oceanic eddy formation and propagation in <strong>the</strong><br />
lee <strong>of</strong> <strong>the</strong> Philippine <strong>Island</strong>s. Geophysical Research Letters 35, L07604,<br />
doi:10.1029/2007GL033109.<br />
Roberts CM, McClean CJ, Veron JEN, Hawkins JP, Allen GR, McAllister<br />
DE, et al. 2002. Marine biodiversity hotspots and conservation priorities<br />
for tropical reefs. Science 295:1280-1284.<br />
Samson MS, Rollon RN. 2008. Growth performance <strong>of</strong> mangroves at <strong>the</strong><br />
enhancement sites: need to revisit forest management strategies. AMBIO<br />
37(4):234-240.<br />
Short FT, Neckles HA. 1999. The effects <strong>of</strong> global climate change on<br />
seagrasses. Aquatic Botany 63:169-196.<br />
Snoussi M, Ouchani T, Niazi S. 2007. Vulnerability assessment <strong>of</strong> <strong>the</strong><br />
impact <strong>of</strong> sea-level rise and flooding on <strong>the</strong> Moroccan coast: The case <strong>of</strong><br />
<strong>the</strong> Mediterranean eastern zone. Estuarine, Coastal and Shelf Science 77<br />
(2):206-213.<br />
Stevenson NJ, Lewis III RR, Burbridge PR. 1999. Disused shrimp ponds<br />
and mangrove rehabilitation. In: Streever, W. (Ed.), An International<br />
Perspective on Wetland Rehabilitation. Kluwer, Ne<strong>the</strong>rlands, pp. 277-<br />
297.<br />
Terrados et al. 1998. Changes in community structure and biomass <strong>of</strong><br />
seagrass communities along gradients <strong>of</strong> siltation in SE Asia. Estuarine<br />
Coastal and Shelf Science 46:757-768.<br />
Ticzon VS, Samaniego BR, Bejarano S, Idip D, David LT, Mumby PJ. 2008.<br />
Change in benthic community composition, in Ngaderrak Reef, Koror,<br />
Republic <strong>of</strong> Palau (2006 to 2008). A report submitted to <strong>the</strong> government<br />
<strong>of</strong> <strong>the</strong> Republic <strong>of</strong> Palau.<br />
Tiquio MGJP, Cayabyab NM. 2008. Characterization <strong>of</strong> seagrass<br />
communities and associated-seaweeds in <strong>the</strong> <strong>Verde</strong> <strong>Island</strong> <strong>Passage</strong><br />
Marine Biodiversity Conservation Corridor. Conservation International,<br />
unpublished report.<br />
Vermaat JE, Thampanya U. 2006. Mangroves mitigate tsunami damage: A<br />
fur<strong>the</strong>r response. Estuarine, Coastal and Shelf Science 69 (2006):1-3.<br />
Ward JD, Metz WD. 2004. Mangrove Forests as Modifiers <strong>of</strong> <strong>the</strong> Impacts<br />
<strong>of</strong> Climate Change on High <strong>Island</strong>s and Atolls in <strong>the</strong> South Pacific:<br />
Mobilizing People and Governments to Act (ATOLLS). http://www.<br />
spcforests.org/Library/Mangroves/atolls/atolls.htm, August 30, 2009.<br />
Wilkinson C (Ed.). 2004. Status <strong>of</strong> Coral Reefs <strong>of</strong> <strong>the</strong> World. Global<br />
Coral Reef Monitoring Network. Australian Institute <strong>of</strong> Marine Science,<br />
Townsville, Australia. Vol I. p. 235 – 276.<br />
Wilson SK, Graham NAJ, Pratchett MS, Jones GP, Polunin NVC. 2006.<br />
Multiple disturbances and <strong>the</strong> global degradation <strong>of</strong> reefs: are reef fishes<br />
at risk or resilient Global Change Biology 12:2220-2234.<br />
Wilson SK, Dolman AM, Cheal AJ, Emslie MJ, Pratchett MS, Sweatman<br />
HPA. 2009. Maintenance <strong>of</strong> fish diversity on disturbed coral reefs. Coral<br />
Reefs 28:3-14.<br />
WL | Delft Hydraulics, Delft3D-WAVE, User manual, release 3.03.<br />
Ye Y et al. 2004. Does sea level rise influence propagule establishment,<br />
early growth and physiology <strong>of</strong> Kandelia candel and Bruguiera<br />
gymnorrhiza Journal <strong>of</strong> Experimental Marine Biology and Ecology<br />
306:197-215.<br />
Yohe G, Malone E, Brenkert A, Schlesinger M, Meij H, Xing X, Lee D. 2006.<br />
A Syn<strong>the</strong>tic Assessment <strong>of</strong> <strong>the</strong> Global Distribution <strong>of</strong> Vulnerability to<br />
Climate Change from <strong>the</strong> IPCC Perspective that Reflects Exposure and<br />
Adaptive Capacity. Palisades, New York: CIESIN (Center for International<br />
Earth Science Information Network), Columbia University. http://sedac.<br />
ciesin.columbia.edu/mva/ccv/.<br />
46
chapter 2 • human well-being and climate change: vulnerability assessment for adaptation<br />
Chapter 2:<br />
Human well-being and climate<br />
change in <strong>the</strong> <strong>Verde</strong> <strong>Island</strong><br />
<strong>Passage</strong>: vulnerability assessment<br />
for adaptation<br />
Rowena R. Boquiren 1, Lead Integrator<br />
Contributing Authors: Annabelle Trinidad 1, Rina Rosales (consultant), Niva Gonzales (consultant)<br />
1 Conservation International–<strong>Philippines</strong><br />
47
climate change vulnerability assessment <strong>of</strong> <strong>the</strong> verde island passage, philippines<br />
Introduction<br />
Climate change, gradually being experienced globally<br />
is adversely affecting <strong>the</strong> wellbeing <strong>of</strong> humanity. In <strong>the</strong><br />
<strong>Philippines</strong>’ <strong>Verde</strong> <strong>Island</strong> <strong>Passage</strong> Marine Biodiversity<br />
Conservation Corridor, now more popularly known as<br />
<strong>the</strong> center <strong>of</strong> <strong>the</strong> center <strong>of</strong> marine biodiversity, rising sea<br />
level and surface temperature, pronounced storminess<br />
and unpredictable rainfall patterns are disturbing<br />
people’s food and livelihood security, water security,<br />
health security as well as cultural and options values.<br />
The greatest concentration <strong>of</strong> marine species in <strong>the</strong><br />
Indo-Malay-Philippine Archipelago is as threatened by<br />
climate change as <strong>the</strong> human population, especially<br />
along <strong>the</strong> passage.<br />
Objective<br />
As its first objective, a socio-economic team assessed<br />
<strong>the</strong> vulnerability and adaptive capacity <strong>of</strong> coastal<br />
communities in <strong>the</strong> <strong>Verde</strong> <strong>Island</strong> <strong>Passage</strong> to climate<br />
change. As a second objective <strong>the</strong> initiative had<br />
a methodological component which was to test<br />
appropriate approaches for engaging mandated<br />
agencies in <strong>the</strong> vulnerability assessment. To <strong>the</strong><br />
extent that appropriate methodologies have yet to be<br />
developed for Philippine ecosystem situations, <strong>the</strong><br />
socioeconomic aspect was addressed iteratively as a<br />
learning process, by demonstrating to local governance<br />
units and line agencies <strong>the</strong> steps in <strong>the</strong> vulnerability<br />
assessment.<br />
Figure 41. Geographic scope <strong>of</strong> <strong>the</strong> socioeconomic<br />
vulnerability assessment in <strong>the</strong> <strong>Verde</strong> <strong>Island</strong> <strong>Passage</strong>,<br />
municipalities abutting it, and coastal habitats found <strong>the</strong>re.<br />
The following specific objectives were addressed:<br />
• identify impacts <strong>of</strong> climate change in <strong>the</strong> physical,<br />
biological, and socio-economic systems;<br />
• describe responses <strong>of</strong> <strong>the</strong> biological/ecological and<br />
socio-economic systems;<br />
• determine <strong>the</strong> vulnerability <strong>of</strong> <strong>the</strong>se systems;<br />
• provide management recommendations to address<br />
climate change impacts; and,<br />
• identify knowledge gaps and research priorities.<br />
48
Methodology<br />
Climate change vulnerability <strong>of</strong> a particular area was<br />
defined as <strong>the</strong> amount <strong>of</strong> exposure and sensitivity less<br />
<strong>the</strong> capacity <strong>of</strong> <strong>the</strong> community to adapt. Exposure<br />
and sensitivity, defined below, are <strong>the</strong> recommended<br />
vulnerability assessment indicators <strong>of</strong> climate change<br />
impacts on human wellbeing.<br />
Exposure<br />
Exposure is defined as <strong>the</strong> types <strong>of</strong> valued assets that<br />
are at risk <strong>of</strong> being impacted by changes in climate.<br />
These assets include social assets (people, health,<br />
education), economic assets (property, infrastructure,<br />
and income), and ecological assets (natural resources<br />
and ecological services) (USAID 2009). The pr<strong>of</strong>ile <strong>of</strong><br />
foreshore areas would allow stakeholders to assess<br />
exposure appropriately. For this component, assets<br />
can be ranked in terms <strong>of</strong> <strong>the</strong>ir importance to local<br />
stakeholders and to <strong>the</strong> local and/or national economy.<br />
Sensitivity<br />
Sensitivity refers to <strong>the</strong> degree <strong>of</strong> likely damage <strong>of</strong><br />
an asset if exposed to climate change. To assess <strong>the</strong><br />
sensitivity <strong>of</strong> coastal assets exposed to climate change,<br />
<strong>the</strong> following questions may be considered (USAID<br />
2009):<br />
• How and to what degree were social, economic<br />
and ecological assets affected by past climate<br />
conditions and coastal hazard events<br />
• What specific characteristics make groups or<br />
systems sensitive<br />
• Was everyone equally impacted If not, what were<br />
<strong>the</strong> differences between various individuals and<br />
groups<br />
• What is <strong>the</strong> sensitivity <strong>of</strong> “non-exposed” assets<br />
For example, agriculture activities that take place<br />
away from <strong>the</strong> coast may rely on a highly exposed<br />
and sensitive coastal road or port for export. Losing<br />
this transportation asset could result in a loss in <strong>the</strong><br />
value <strong>of</strong> <strong>the</strong> agricultural assets.<br />
Adaptive capacity<br />
Adaptive capacity is <strong>the</strong> most critical <strong>of</strong> <strong>the</strong> three<br />
dimensions because it shows a community’s ability to<br />
manage and <strong>the</strong>reby reduce gross vulnerability. Hence,<br />
vulnerability is increased when adaptive capacities are<br />
minimal or not present.<br />
Assessing <strong>the</strong> adaptive capacity <strong>of</strong> a place or sector<br />
helps in understanding why vulnerability exists in <strong>the</strong><br />
first place. To reduce vulnerability, stakeholders must<br />
understand its root causes. These are much deeper<br />
societal issues than, for example, poorly constructed<br />
houses being located in areas <strong>of</strong> coastal erosion. Root<br />
chapter 2 • human well-being and climate change: methodology<br />
causes might include poverty, insecure property rights,<br />
natural resource dependency, degraded resources, and<br />
weaknesses in institutions and political assets (Adger<br />
1999). Adaptive capacity can be streng<strong>the</strong>ned through<br />
policies that enhance social and economic equity,<br />
reduce poverty, improve natural resources and coastal<br />
management, increase public participation, generate<br />
useful and actionable information, and streng<strong>the</strong>n<br />
institutions.<br />
For heuristic purposes, because vulnerability<br />
assessment methodology in <strong>the</strong> Philippine setting has<br />
not yet been developed, <strong>the</strong> team selected <strong>the</strong> following<br />
socioeconomic concerns in <strong>the</strong> <strong>Verde</strong> <strong>Island</strong> <strong>Passage</strong><br />
project, using interdisciplinary perspectives to guide<br />
research methods:<br />
• economic trends and livelihood sources (with focus<br />
on fisheries, tourism and foreshore development);<br />
• health and food safety.<br />
The vulnerability assessment process started with 1)<br />
knowing <strong>the</strong> climate change projection, 2) determination<br />
<strong>of</strong> exposure and sensitivity <strong>of</strong> a given region or locale<br />
to climate change, including <strong>the</strong> assessment <strong>of</strong> <strong>the</strong><br />
health <strong>of</strong> coastal habitats and ecosystems, and 3) an<br />
assessment <strong>of</strong> adaptive capacity (capacity <strong>of</strong> society to<br />
cope with <strong>the</strong> expected or actual climate changes).<br />
Participative and inter-agency collaborative methods<br />
were observed in <strong>the</strong> project. Iterative learning over<br />
nine months depended on accessed agency reports,<br />
roundtable discussions, interviews, focus groups<br />
discussions and workshops across varied lines <strong>of</strong><br />
focus and expertise. Participative techniques engaged<br />
local government units (LGU) from <strong>the</strong> provincial and<br />
down to <strong>the</strong> municipal levels, stakeholders from coastal<br />
communities and non-governmental organizations<br />
in generating and systematizing information from<br />
<strong>the</strong> ground, to be linked with insights <strong>of</strong> academics,<br />
scientists and experts across disciplines in <strong>the</strong> physical,<br />
biological and social sciences.<br />
The research process demonstrated what variables<br />
or data are to be accessed from agencies, generated<br />
from rapid site assessments and through inter-agency<br />
or multi-sectoral workshops to generate <strong>the</strong> baseline;<br />
how to customize climate change-sensitive instruments;<br />
what tools and measures can be creatively developed<br />
to facilitate vulnerability assessment; and in what<br />
aspects <strong>the</strong> help <strong>of</strong> support groups can be tapped<br />
for science-based disciplinal expertise and technical<br />
inputs.<br />
49
climate change vulnerability assessment <strong>of</strong> <strong>the</strong> verde island passage, philippines<br />
Context analysis from <strong>the</strong> baseline as premise <strong>of</strong> <strong>the</strong><br />
vulnerability assessment was first observed by <strong>the</strong> team:<br />
background on <strong>the</strong> sector, its importance, components/<br />
aspects and trends related to climate change impacts<br />
on <strong>the</strong> marine resources that <strong>the</strong> people experience. As<br />
a basis to <strong>the</strong> assessment, pr<strong>of</strong>iles were laid down, no<br />
matter how preliminary, as a flexible and opportunistic<br />
approach to data ga<strong>the</strong>ring in view <strong>of</strong> institutional gaps.<br />
The vulnerability and resilience potentials <strong>of</strong> coastal<br />
communities were addressed next, followed by<br />
recommendations to management units. The novelty<br />
<strong>of</strong> climate change impacts in institutional mechanisms<br />
and in <strong>the</strong> public mind requires plans and policies to be<br />
scaled up beyond <strong>the</strong> normative and routine by being<br />
inter-linked and inter-agency driven in emphasizing<br />
<strong>the</strong> importance <strong>of</strong> human wellbeing along with marine<br />
biodiversity conservation.<br />
Climate change effects on and <strong>of</strong> <strong>the</strong> people in <strong>the</strong><br />
vulnerability assessment process are illustrated in a<br />
framework creatively designed by <strong>the</strong> team (Fig. 42).<br />
Extreme changes in climate affect marine habitats<br />
and species which <strong>the</strong>n impact upon <strong>the</strong> economic<br />
uses <strong>of</strong> <strong>the</strong> marine waters and coasts as well as <strong>the</strong><br />
livelihood and health <strong>of</strong> communities. Changes in sea<br />
surface temperature (SST), accelerated sea level rise<br />
(ASLR), storminess and unexpected precipitation<br />
patterns have effects on <strong>the</strong> fisheries, tourism and<br />
foreshore development trends that will damage or<br />
destroy investments if <strong>the</strong>re are no climate change<br />
adaptation actions early enough. Beyond understanding<br />
<strong>the</strong> effects <strong>of</strong> climate change on <strong>the</strong> socioeconomic<br />
conditions <strong>of</strong> communities dependent on marine<br />
resources, <strong>the</strong> vulnerability assessment also included<br />
<strong>the</strong> exacerbating anthropogenic factors that affect <strong>the</strong><br />
marine environment, represented by <strong>the</strong> back flows <strong>of</strong><br />
arrows.<br />
Rising sea levels inundate wetlands and o<strong>the</strong>r low-lying<br />
lands, erode beaches, intensify flooding, and increase<br />
<strong>the</strong> salinity <strong>of</strong> rivers, bays, and groundwater tables,<br />
but some <strong>of</strong> <strong>the</strong>se effects may be compounded by<br />
adaptation activities such as measures that people take<br />
to protect private property from rising sea level that may<br />
have adverse effects on <strong>the</strong> environment and on public<br />
uses <strong>of</strong> fish ports, beaches and waterways. Foreshore<br />
development, for instance, can bring in increasing<br />
investments for physical infrastructure such as sea walls<br />
or reclaimed areas in <strong>the</strong> short term, but in <strong>the</strong> longer<br />
term, <strong>the</strong>se structures and human activities can damage<br />
mangrove ecosystems, fragment habitats, damage<br />
nutrient flows or cause destructive algal blooms which<br />
can aggravate climate change effects. Vulnerability<br />
assessment is <strong>the</strong>refore essentially related to disaster<br />
risk reduction and management.<br />
More studies are needed to have appropriate guidelines<br />
for addressing adaptation. The vulnerability assessment<br />
exercise for <strong>Verde</strong> <strong>Island</strong> <strong>Passage</strong> is still exploratory but<br />
already significant for its methodological contributions.<br />
Fig. 42. Socioeconomic aspects in <strong>the</strong> vulnerability<br />
assessment <strong>of</strong> <strong>the</strong> <strong>Verde</strong> <strong>Island</strong> <strong>Passage</strong>.<br />
50
chapter 2 • human well-being and climate change: methodology<br />
Summary: methodology for socioeconomic vulnerability assessment<br />
Fisheries<br />
Characterization <strong>of</strong> <strong>the</strong> fisheries sector in <strong>Verde</strong> <strong>Island</strong> <strong>Passage</strong> (VIP) was done through literature review and analysis<br />
<strong>of</strong> fisheries statistics from <strong>the</strong> Bureau <strong>of</strong> Agricultural Statistics (BAS). Data from BAS was used to infer volume and<br />
value <strong>of</strong> production and number <strong>of</strong> fishers from three provinces in <strong>Verde</strong> <strong>Island</strong> <strong>Passage</strong> , namely: Batangas, Occidental<br />
Mindoro, and Oriental Mindoro. Finer scale data provided by technical reports allowed a more in-depth analysis for<br />
selected municipalities including: Mabini and Tingloy, for tuna fisheries (Soliman manuscript); <strong>Verde</strong> <strong>Island</strong>, Lubang, Looc<br />
and Paluan municipalities, for aquarium fishing (MAC and REEFcheck report); and Mabini, coral reef fisheries (MERF<br />
report). The compendium <strong>of</strong> PCAMRD on <strong>the</strong> impacts <strong>of</strong> El Niño on fisheries was compiled and used to supplement <strong>the</strong><br />
literature review on increase in sea surface temperature.<br />
A “perceptual survey” with 41 respondents and key informant interviews were conducted in <strong>the</strong> municipalities <strong>of</strong> Mabini,<br />
Bauan, Calatagan, Lian and Batangas City in April-May 2009 to determine how a sample <strong>of</strong> fishers perceive climate<br />
change. In particular, <strong>the</strong> following manifestations <strong>of</strong> climate change were validated: changes in frequency, occurrence,<br />
and magnitude <strong>of</strong> typhoons; changes in frequency, occurrence, and intensity <strong>of</strong> rainfall; sea level rise.<br />
Tourism and foreshore development<br />
The pr<strong>of</strong>ile <strong>of</strong> <strong>the</strong> tourism sector and foreshore development status and trends was generated from previous studies,<br />
accessed data from government agencies in <strong>the</strong> VIP, interviews and a field survey in April to June 2009.<br />
A climate change vulnerability assessment was conducted on July 22 to 24, 2009 participated in mostly by local<br />
government representatives from <strong>the</strong> coastal municipalities <strong>of</strong> <strong>the</strong> five provinces surrounding <strong>Verde</strong> <strong>Island</strong> <strong>Passage</strong>,<br />
namely Batangas, Mindoro Occidental, Mindoro Oriental, Marinduque, and Romblon. Resource persons from <strong>the</strong><br />
natural and social sciences shared <strong>the</strong>ir initial assessments and frameworks for analysis on <strong>the</strong> potential impacts <strong>of</strong><br />
climate change occurrences that are projected to occur. Climate change impacts include <strong>the</strong> following: increase in sea<br />
surface temperature, sea level rise, increased frequency and intensity <strong>of</strong> typhoons, changing rainfall patterns, and ocean<br />
acidification. Economic and social sectors that were assessed in terms <strong>of</strong> <strong>the</strong>ir vulnerability to such climate change<br />
occurrences include: fisheries, food safety and security, tourism and settlements/infrastructure in foreshore areas.<br />
The framework for assessing <strong>the</strong> vulnerability <strong>of</strong> foreshore areas was applied by some <strong>of</strong> <strong>the</strong> participants coming from<br />
municipalities with significant infrastructure development in <strong>the</strong>ir respective foreshore areas, i.e., Balayan-Batangas,<br />
Calatagan-Batangas, Bauan-Batangas, Nasugbu-Batangas, Puerto Galera-Mindoro Oriental, and Naujan-Mindoro<br />
Oriental. Appendix A contains <strong>the</strong> list <strong>of</strong> participants for <strong>the</strong> foreshore area workshop group.<br />
For <strong>the</strong> tourism sector, <strong>the</strong> framework for assessing <strong>the</strong> vulnerability was applied by some <strong>of</strong> <strong>the</strong> participants coming from<br />
municipalities with active tourism activities, i.e., Mabini-Batangas, Lian-Batangas, Tingloy-Batangas, Bauan-Batangas,<br />
Puerto Galera-Mindoro Oriental, and Calapan-Mindoro Oriental. O<strong>the</strong>r municipalities with plans <strong>of</strong> increasing tourism in<br />
<strong>the</strong>ir areas also participated in <strong>the</strong> tourism workshop group.<br />
Workshop objectives were provided as follows:<br />
• Identify impacts <strong>of</strong> climate change in <strong>the</strong> physical, biological and socio-economic systems.<br />
• Describe responses <strong>of</strong> <strong>the</strong> biological/ecological and socio-economic systems.<br />
• Determine vulnerability <strong>of</strong> <strong>the</strong>se systems.<br />
• Provide management recommendations to address climate change impacts.<br />
• Identify knowledge gaps, research priorities.<br />
Health, food safety, and demographic trends<br />
Accessed data from government agencies (National Statistical Board, National Statistics Office, Provincial/Municipal<br />
Planning and Development Offices <strong>of</strong> Batangas, Mindoro Oriental and Mindoro Occidental) were <strong>the</strong> sources for <strong>the</strong><br />
demographic and health pr<strong>of</strong>ile <strong>of</strong> <strong>the</strong> <strong>Passage</strong>, supplemented by information from <strong>the</strong> Batangas Provincial Disaster<br />
Coordinating Office.<br />
Key informant interviews and focus group discussions were conducted in <strong>the</strong> municipalities <strong>of</strong> Mabini, Bauan, Calatagan,<br />
Lian and Batangas City in April-May 2009 to reconstruct health and food safety observations and experiences over <strong>the</strong><br />
past 5-10 years and <strong>the</strong> local people’s current knowledge on climate change.<br />
A climate change vulnerability assessment was conducted on July 22 to 24, 2009:<br />
• Identify <strong>the</strong> impacts <strong>of</strong> climate change on socio-economic systems and <strong>the</strong>ir resulting responses in <strong>the</strong> <strong>Verde</strong> <strong>Island</strong><br />
<strong>Passage</strong>.<br />
• Determine o<strong>the</strong>r impacts (natural or anthropogenic) that fur<strong>the</strong>r contribute to <strong>the</strong> vulnerability <strong>of</strong> <strong>the</strong>se systems.<br />
• Provide recommendation for actions to address <strong>the</strong> impacts <strong>of</strong> climate change by increasing resilience, reducing<br />
vulnerability, increasing capacity for adaptation.<br />
• Identify policy and knowledge gaps and research priorities.<br />
51
climate change vulnerability assessment <strong>of</strong> <strong>the</strong> verde island passage, philippines<br />
Results and discussion<br />
Pr<strong>of</strong>ile <strong>of</strong> <strong>the</strong> <strong>Verde</strong> <strong>Island</strong> <strong>Passage</strong> and<br />
vulnerable socioeconomic situation<br />
The Intergovernmental Panel on Climate Change in its<br />
4th report detailed <strong>the</strong> impacts <strong>of</strong> climate change that<br />
affect human populations:<br />
• Floods and droughts will be more frequent, and<br />
storms more intense.<br />
• Water will be in shorter (and more erratic) supply.<br />
• Sea level rise will result in salt water intrusion in<br />
coastal areas decreasing available freshwater.<br />
• Water pollution will be worsened by higher water<br />
temperatures, increased precipitation, and longer<br />
dry periods.<br />
• The likelihood <strong>of</strong> water borne diseases will increase.<br />
• Aquatic ecosystems will suffer changes in water<br />
availability and related extinctions <strong>of</strong> species<br />
sensitive to water temperature and availability.<br />
In addition to natural processes, threats to <strong>the</strong> rich<br />
but fragile environmental resources within and around<br />
<strong>the</strong> <strong>Verde</strong> <strong>Island</strong> <strong>Passage</strong> become more pronounced<br />
as population, conservation and natural resource<br />
management issues persist. Developments that<br />
respond to <strong>the</strong> escalating needs for income and food,<br />
industrialization and urbanization pose greater risks to<br />
<strong>the</strong> environment and to people’s livelihood and health.<br />
Biophysical setting<br />
The <strong>Verde</strong> <strong>Island</strong> <strong>Passage</strong> extends about 100 km,<br />
from Lubang, Mindoro Occidental in <strong>the</strong> northwest, to<br />
<strong>the</strong> Romblon’s island municipality <strong>of</strong> Corcuera in <strong>the</strong><br />
sou<strong>the</strong>ast, and about 20 km across at its narrowest<br />
portion. The passage, a total <strong>of</strong> more than 494,700<br />
hectares, is a special management area under <strong>the</strong><br />
jurisdiction <strong>of</strong> five provinces: Batangas, Occidental<br />
Mindoro, Oriental Mindoro, Marinduque, and Romblon.<br />
Warmer temperatures, diminished waters sources,<br />
and soil erosion results from a thinning forest cover<br />
while fish production is adversely affected by such<br />
changes as <strong>the</strong> loss <strong>of</strong> mangroves. Around <strong>the</strong> <strong>Verde</strong><br />
<strong>Island</strong> <strong>Passage</strong>, <strong>the</strong> provinces <strong>of</strong> Batangas, Romblon<br />
and Marinduque have <strong>the</strong> least forest cover in relation<br />
to <strong>the</strong>ir respective land areas, with 4.46, 5.41, and<br />
13.78% respectively (Forest Management Bureau or<br />
FMB 2003).<br />
Low-lying and coastal communities as well as industries<br />
are exposed to hazards associated with strong<br />
typhoons and heavy rains. At least 51 barangays in<br />
10 Batangas municipalities are more predisposed to<br />
flooding, erosion, siltation, and o<strong>the</strong>r damages brought<br />
by storms.<br />
Biodiversity and ecosystem soundness are both<br />
threatened by <strong>the</strong> status and direction <strong>of</strong> development<br />
in <strong>the</strong> <strong>Verde</strong> <strong>Island</strong> <strong>Passage</strong>. Along with manufacturing,<br />
residential and institutional uses, fishing, farming, and<br />
tourism, <strong>the</strong> passage is an essential route for industrial<br />
and economic activities. Its waterways are some <strong>of</strong><br />
<strong>the</strong> busiest in <strong>the</strong> <strong>Philippines</strong>, being used daily by oil<br />
and chemical carriers. Consequently, <strong>the</strong> shores <strong>of</strong> <strong>the</strong><br />
province <strong>of</strong> Batangas are lined with shipyards, chemical<br />
and petrochemical plants, and oil refineries.<br />
O<strong>the</strong>r observed trends and facts on <strong>the</strong> socioeconomic<br />
situation in <strong>the</strong> <strong>Verde</strong> <strong>Island</strong> <strong>Passage</strong> are <strong>the</strong> following:<br />
• Overfishing and <strong>the</strong> use <strong>of</strong> illegal fishing methods<br />
such as <strong>the</strong> use <strong>of</strong> sodium cyanide, explosives, and<br />
fine-meshed nets.<br />
• Mangrove plantations are cut for o<strong>the</strong>r land uses<br />
that include fish farming. Calatagan’s mangrove<br />
areas had been reduced to a mere 26.3 ha from 1<br />
32.8 hectares in 1950 (Gonzales 2009).<br />
• Agriculture is intensified, necessitating increased<br />
use <strong>of</strong> inorganic fertilizers and pesticides. Batangas<br />
itself has surpassed its capacity levels, with crop<br />
production activities utilizing marginal lands,<br />
including upland areas (Lusterio-Berja and Colson<br />
2008).<br />
• Forest cover has been diminished as this land<br />
has been converted to cultivation. Logging and<br />
extractive industries such as mining put entire forest<br />
ecosystems at risk.<br />
• Forest patches and agricultural lands are cleared to<br />
make way for new human settlements and for pr<strong>of</strong>itmaking<br />
ventures at various scales.<br />
• Garbage and toxic effluents from settlements,<br />
industrial operations and intensified agricultural<br />
production contaminate <strong>the</strong> ground and water<br />
bodies through seepage and run <strong>of</strong>f. Residuals<br />
from households and agriculture contribute to <strong>the</strong><br />
pollution <strong>of</strong> Batangas Bay and <strong>Verde</strong> <strong>Passage</strong><br />
(Arcenas 2008, in Gonzales 2009).<br />
• Wastewater discharge from Batangas City’s<br />
industries is estimated at almost 600 million<br />
liters per year, 98% <strong>of</strong> which come from <strong>the</strong><br />
manufacturing, refinery and power industries<br />
(Gonzales 2009). Oil spills from ships are a<br />
constant threat given <strong>the</strong> numerous local and<br />
international ports and shipyards in Batangas<br />
province and <strong>the</strong> <strong>Verde</strong> <strong>Passage</strong> being a busy route<br />
for cargo and passenger vessels.<br />
• Residential areas, including informal settlements,<br />
52
chapter 2 • human well-being and climate change: results and discussion<br />
expand especially in <strong>the</strong> lowland and coastal areas<br />
where commerce, industry and infrastructure are<br />
concentrated. Population congestion and mounting<br />
garbage expose people to diseases and o<strong>the</strong>r<br />
problems.<br />
• More frequent algal blooms that are harmful to <strong>the</strong><br />
health <strong>of</strong> marine resources and thus, <strong>of</strong> humans, are<br />
likely due to pollution <strong>of</strong> water bodies.<br />
• Decline in fish catch has been attributed to <strong>the</strong><br />
establishment <strong>of</strong> industries in <strong>the</strong> coastal areas.<br />
• Industrial and vehicular emissions cause air<br />
pollution. In 2004, Batangas City had a one-year<br />
exposure level <strong>of</strong> 127 μg m-3 total suspended<br />
particulates which consist <strong>of</strong> dust, smoke, soot,<br />
and acid fumes usually produced by motor<br />
vehicles and fuel-burning facilities. Exceeding <strong>the</strong><br />
acceptable level <strong>of</strong> 90 μg m-3, <strong>the</strong> city’s inhabitants<br />
are predisposed to cardiovascular and respiratory<br />
diseases (Lusterio-Berja and Colson 2008).<br />
Demographic trends and <strong>the</strong> status <strong>of</strong> human<br />
health and safety<br />
Climate change impacts in <strong>the</strong> <strong>Verde</strong> <strong>Island</strong> <strong>Passage</strong><br />
may influence three factors that impact upon <strong>the</strong> state<br />
<strong>of</strong> human health: settlement expansion from fertility<br />
and migration, increased economic opportunities and<br />
urbanization. Baseline data on <strong>the</strong>se factors are well<br />
established but have not been appropriately considered<br />
in terms <strong>of</strong> adaptation to climate change.<br />
The five provinces (Table 24) flanking <strong>the</strong> <strong>Verde</strong> <strong>Island</strong><br />
<strong>Passage</strong> consist <strong>of</strong> 32 municipalities and two cities<br />
which support 3,913,000 people (46.07% <strong>of</strong> <strong>the</strong> total<br />
2007 population). In Batangas, Occidental Mindoro<br />
and Oriental Mindoro, more than 251 barangays (28%)<br />
serve as residence to 34% (557,710) <strong>of</strong> <strong>the</strong> population.<br />
In summary, from one third to almost a half <strong>of</strong> <strong>the</strong> total<br />
population <strong>of</strong> <strong>Verde</strong> <strong>Island</strong> <strong>Passage</strong> provinces are<br />
residents <strong>of</strong> coastal communities where <strong>the</strong> population<br />
size grows fastest.<br />
Known coastal centers <strong>of</strong> commerce and industry in<br />
Batangas province such as Batangas City, Nasugbu,<br />
Taal, and Balayan had higher annual population growth<br />
rates than Batangas province as a whole. In 2000, a<br />
total <strong>of</strong> 67% <strong>of</strong> <strong>the</strong> region’s population lived in urban<br />
areas where industries and commercial establishments<br />
were already concentrated (Lusterio-Berja and Colson<br />
2008).<br />
Although <strong>the</strong>re are lower annual population growth<br />
rates for <strong>the</strong> provinces, growth rate in <strong>the</strong> municipalities<br />
<strong>of</strong> Looc and Lubang increased from 0.22% in 1995-<br />
2000, to 3.41% and 3.35% respectively in 2000-<br />
2007, higher than <strong>the</strong> national average <strong>of</strong> 2.3%. Puerto<br />
Galera’s annual growth rate also increased from 2.56%<br />
to 3.45%. People from communities with less economic<br />
opportunities have migrated into areas with more<br />
options. Notably, Puerto Galera, Looc and Lubang are<br />
increasingly becoming attractive as tourist destinations,<br />
with <strong>the</strong> Lubang <strong>Island</strong> known for its wealth in fish<br />
resources (Occidental Mindoro PPDO 2009; Oriental<br />
Mindoro PPDO 2008).<br />
Among <strong>the</strong> five provinces <strong>of</strong> <strong>the</strong> <strong>Verde</strong> <strong>Island</strong> <strong>Passage</strong>,<br />
Batangas is <strong>the</strong> most densely populated at 720 people<br />
km2, which is higher than <strong>the</strong> 709 people km2 for<br />
<strong>the</strong> entire Region IV-A Calabarzon (refers to Cavite,<br />
Laguna, Batangas and Rizal Zone). Calabarzon has<br />
<strong>the</strong> largest population and is <strong>the</strong> second most densely<br />
populated region in <strong>the</strong> country. It draws an influx <strong>of</strong><br />
people because <strong>of</strong> <strong>the</strong> lucrative economic opportunities<br />
presented by its growing number <strong>of</strong> industries.<br />
While industrialization draws people into <strong>the</strong> urban<br />
center, poverty continues to be a great challenge<br />
despite income derived from industries, tourism,<br />
agriculture and fisheries. A quarter to about half <strong>of</strong><br />
<strong>the</strong> families in <strong>the</strong> <strong>Verde</strong> <strong>Island</strong> <strong>Passage</strong> provinces<br />
had incomes below <strong>the</strong> designated poverty and food<br />
thresholds in 2006. Batangas with 25.6% poverty<br />
lacked more than 12% in fish supply in terms <strong>of</strong> per<br />
capita consumption in 2004 (Batangas PPDO 2007).<br />
Oriental Mindoro and Occidental Mindoro slipped<br />
into becoming <strong>the</strong> 12th and 13th poorest provinces<br />
in <strong>the</strong> <strong>Philippines</strong> from being 32nd and 36th in 2000,<br />
and from being 28th and 19th in 2003. Romblon<br />
became <strong>the</strong> 25th poorest province in <strong>the</strong> country. A<br />
considerable section <strong>of</strong> <strong>the</strong> population are fisherfolks:<br />
more than 16,000 fishers in Batangas City and o<strong>the</strong>r<br />
Batangas towns beside <strong>the</strong> <strong>Verde</strong> <strong>Island</strong> <strong>Passage</strong> (year<br />
2007), 15,535 municipal fishermen lived in Oriental<br />
Mindoro in 2008.<br />
There are significant reproductive and o<strong>the</strong>r health<br />
concerns in <strong>the</strong> region. Mimaropa registered a total<br />
fertility rate <strong>of</strong> 5.0% in 2003, which was <strong>the</strong> highest in<br />
<strong>the</strong> country, as against Calabarzon's 3.2%, <strong>the</strong> lowest<br />
during <strong>the</strong> period. Although Batangas has an obvious<br />
advantage over <strong>the</strong> Mimaropa provinces in terms <strong>of</strong><br />
economic position, health services and infrastructure,<br />
contraceptive prevalence in <strong>the</strong> province was only<br />
41.77% (Batangas PPDO 2007) and 2007 crude birth<br />
rate (22.96) was even higher than those <strong>of</strong> Occidental<br />
and Oriental Mindoro (20.49 and 20.9 respectively).<br />
Batangas City itself had a crude birth rate <strong>of</strong> 21.23<br />
and an infant mortality rate <strong>of</strong> 16.83 (Batangas City<br />
OCPDC 2007), which was more than double <strong>the</strong><br />
provincial rate, and almost three and four times that <strong>of</strong><br />
Occidental Mindoro and Oriental Mindoro respectively.<br />
Moreover, 8.2% <strong>of</strong> all children below 72 months old<br />
were considered malnourished because <strong>the</strong>y weighed<br />
below normal low (BNL) and very low (BNVL).<br />
53
climate change vulnerability assessment <strong>of</strong> <strong>the</strong> verde island passage, philippines<br />
Table 24. Population <strong>of</strong> municipalities and barangays along <strong>the</strong> <strong>Verde</strong> <strong>Island</strong> <strong>Passage</strong> (VIP).<br />
Province/ Population (2007) No. <strong>of</strong> barangays Population Annual population<br />
municipality/ barangays per along density per growth rate %<br />
city total along VIP mun/city VIP sq km (2007) (2000-2007)<br />
PHILIPPINES<br />
Region IV-A (Calabarzon)<br />
Batangas province<br />
Balayan<br />
Batangas City<br />
Bauan<br />
Calaca<br />
Calatagan<br />
Lemery<br />
Lian<br />
Lobo<br />
Mabini<br />
Nasugbu<br />
San Juan<br />
San Luis<br />
San Pascual<br />
Taal<br />
Tingloy<br />
Total population along <strong>the</strong> VIP<br />
88,574,614<br />
11,743,110<br />
2,245,869<br />
79,407<br />
295,231<br />
79,831<br />
64,966<br />
51,544<br />
76,090<br />
44,925<br />
37,798<br />
40,629<br />
113,926<br />
87,276<br />
29,645<br />
57,200<br />
51,459<br />
18,548<br />
1,128,475<br />
20,873<br />
65,774<br />
24,348<br />
19,191<br />
34,433<br />
27,149<br />
19,114<br />
18,589<br />
20,616<br />
29,488<br />
26,537<br />
10,091<br />
18,942<br />
4,825<br />
18,548<br />
358,518<br />
48<br />
105<br />
40<br />
40<br />
25<br />
46<br />
19<br />
26<br />
34<br />
42<br />
42<br />
26<br />
29<br />
42<br />
15<br />
579<br />
11<br />
18<br />
10<br />
8<br />
16<br />
13<br />
6<br />
10<br />
13<br />
7<br />
15<br />
6<br />
3<br />
1<br />
15<br />
152<br />
295<br />
709<br />
720<br />
730<br />
1,043<br />
1,199<br />
648<br />
460<br />
749<br />
585<br />
196<br />
946<br />
433<br />
319<br />
757<br />
1,637<br />
1,729<br />
572<br />
2.04<br />
3.24<br />
2.29<br />
2.33<br />
2.46<br />
1.32<br />
1.46<br />
1.87<br />
1.87<br />
1.92<br />
1.51<br />
1.12<br />
2.37<br />
1.53<br />
1.34<br />
2.14<br />
2.36<br />
1.19<br />
Region IV-B (Mimaropa)<br />
Occidental Mindoro<br />
Abra de Ilog<br />
Looc<br />
Lubang<br />
Paluan<br />
Total population along <strong>the</strong> VIP<br />
2,559,791<br />
421,952<br />
25,152<br />
11,310<br />
28,267<br />
13,718<br />
78,447<br />
10,117<br />
10,317<br />
28,267<br />
4,191<br />
52,892<br />
9<br />
9<br />
16<br />
12<br />
46<br />
3<br />
8<br />
9<br />
2<br />
22<br />
93<br />
72<br />
47<br />
85<br />
250<br />
24<br />
1.49<br />
1.56<br />
1.89<br />
3.41<br />
3.35<br />
2.01<br />
Oriental Mindoro<br />
Baco<br />
City <strong>of</strong> Calapan<br />
Gloria<br />
Naujan<br />
Pinamalayan<br />
Pola<br />
Puerto Galera<br />
San Teodoro<br />
Total population along <strong>the</strong> VIP<br />
735,769<br />
34,127<br />
116,976<br />
40,561<br />
90,629<br />
77,119<br />
32,635<br />
28,035<br />
15,039<br />
435,121<br />
7,526<br />
47,014<br />
12,166<br />
14,275<br />
26,977<br />
10,618<br />
19,742<br />
7,982<br />
146,300<br />
27<br />
62<br />
27<br />
70<br />
37<br />
23<br />
13<br />
8<br />
267<br />
6<br />
18<br />
8<br />
11<br />
9<br />
9<br />
12<br />
4<br />
77<br />
169<br />
141<br />
441<br />
176<br />
172<br />
278<br />
251<br />
125<br />
41<br />
1.06<br />
1.71<br />
1.38<br />
0.66<br />
1.07<br />
0.77<br />
0.30<br />
3.45<br />
1.19<br />
Marinduque<br />
Buenavista<br />
Gasan<br />
Mogpog<br />
Total population along <strong>the</strong> VIP<br />
% <strong>of</strong> total provincial population<br />
229,636<br />
21,018<br />
33,772<br />
33,341<br />
138,954<br />
60.51%<br />
241<br />
Total population <strong>of</strong> Batangas, Occ. Mindoro, and Or. Mindoro<br />
Number <strong>of</strong> VIP municipalities and cities in <strong>the</strong> above<br />
Total population <strong>of</strong> <strong>the</strong> 24 municipalities and 2 cities<br />
Total population <strong>of</strong> VIP barangays in above<br />
Total population <strong>of</strong> non-VIP barangays in above<br />
0.76<br />
3,403,590<br />
24 + 2<br />
1,642,042<br />
557,710 (34%)<br />
1,084,332 (66%)<br />
Romblon<br />
Banton<br />
Concepcion<br />
Coruera<br />
Total population <strong>of</strong> island<br />
municipalities along <strong>the</strong> VIP<br />
% <strong>of</strong> total provincial population<br />
279,774<br />
6,799<br />
4,166<br />
10,883<br />
21,848<br />
7.81%<br />
Total number <strong>of</strong> barangays in <strong>the</strong> VIP municipalities and<br />
cities <strong>of</strong> Batangas, Occ. Mindoro, and Or. Mindoro<br />
Number <strong>of</strong> VIP barangays<br />
Number <strong>of</strong> non-VIP barangays in <strong>the</strong> VIP municipalities and<br />
cities <strong>of</strong> <strong>the</strong> 3 provinces<br />
1<br />
0.78<br />
892<br />
251 (28.14%)<br />
641 (71.86%)<br />
Source: Collated by SEPU for <strong>the</strong> Population, Health and Environment (PHE) network from materials and data availed through <strong>the</strong> Provincial Planning and Development Office (PPDO) <strong>of</strong> Batangas, Occidental, and Oriental Mindoro<br />
(acquired May-August 2009) and through <strong>the</strong> National Statistics Office (NSO) 2007 Census <strong>of</strong> Population.<br />
Water supply and sanitation are health problems<br />
associated with poverty. As <strong>of</strong> 2007, 89% <strong>of</strong> families<br />
in Calabarzon had access to safe water while this was<br />
only 76% in Mimaropa. During <strong>the</strong> same year, 16% <strong>of</strong><br />
<strong>the</strong> Batangas population did not have access to safe<br />
drinking water. Six percent <strong>of</strong> <strong>the</strong> families in Calabarzon<br />
and 20% <strong>of</strong> those in Mimaropa were without sanitary<br />
toilet facilities. The absence <strong>of</strong> safe water and sanitary<br />
toilet facilities are associated with diarrhea and o<strong>the</strong>r<br />
water and food-borne diseases.<br />
In relation to climate change adaptation, <strong>the</strong> National<br />
Objectives for Health in <strong>the</strong> <strong>Philippines</strong> (NOH 2005-<br />
2010) does not specifically cite climate change as a<br />
cause <strong>of</strong> health problems, yet major causes <strong>of</strong> mortality<br />
currently are recognized as climate sensitive diseases:<br />
under-nutrition (3.7 million), diarrhea (1.8 million),<br />
and malaria (1.1 million). Acute or upper respiratory<br />
tract infection was <strong>the</strong> leading cause <strong>of</strong> morbidity in<br />
<strong>the</strong> provinces <strong>of</strong> Batangas, Occidental, and Oriental<br />
Mindoro (2007). Pneumonia was <strong>the</strong> top cause <strong>of</strong><br />
54
chapter 2 • human well-being and climate change: results and discussion<br />
mortality in Occidental Mindoro while it ranked fourth in<br />
Oriental Mindoro.<br />
demersal<br />
13%<br />
Batangas Province<br />
tuna<br />
15%<br />
Whe<strong>the</strong>r because <strong>of</strong> extreme wea<strong>the</strong>r and high<br />
rainfall, eight out <strong>of</strong> 10 leading causes <strong>of</strong> illnesses<br />
are infectious. While most <strong>of</strong> <strong>the</strong>se happen without<br />
being attributed to climate change, threats to human<br />
health and safety can demonstrate how vulnerability<br />
assessment in climate change adaptation can and must<br />
be pursued to avoid major epidemics.<br />
Economic uses<br />
A large portion <strong>of</strong> <strong>the</strong> <strong>Verde</strong> <strong>Island</strong> <strong>Passage</strong> population<br />
is employed near Batangas, where <strong>the</strong>re are eight<br />
industrial parks including Cocochem Agro-Industrial<br />
Park and Tabangao Special Export Processing Zone,<br />
as well as 181 companies that are mostly situated<br />
in Batangas City and o<strong>the</strong>r coastal municipalities<br />
(Batangas PPDO 2007). Tourism also <strong>of</strong>fers significant<br />
employment opportunities for coastal communities in<br />
resorts close to major dive sites. While commerce and<br />
industry provide big revenues, a substantial segment <strong>of</strong><br />
<strong>the</strong> population depends on agriculture for sustenance.<br />
Fisheries remain a viable income and food source for<br />
many people who live immediately around <strong>the</strong> passage.<br />
demersal<br />
17%<br />
demersal<br />
16%<br />
small pelagic<br />
72%<br />
Occidental Mindoro Province<br />
small pelagic<br />
65%<br />
Oriental Mindoro Province<br />
tuna<br />
18%<br />
tuna<br />
22%<br />
Discussion <strong>of</strong> <strong>the</strong> economic pr<strong>of</strong>ile for <strong>the</strong> vulnerability<br />
assessment is confined only to fisheries, tourism, and<br />
foreshore development.<br />
Fisheries<br />
i. Fish production<br />
One <strong>of</strong> <strong>the</strong> important steps in <strong>the</strong> Vulnerability<br />
Assessment was to estimate fisheries production<br />
attributable to <strong>the</strong> habitats <strong>of</strong> <strong>the</strong> <strong>Verde</strong> <strong>Island</strong> <strong>Passage</strong><br />
(VIP) (Figure 43). Two sources <strong>of</strong> data were used for<br />
this purpose: a) Bureau <strong>of</strong> Agricultural Statistics (BAS)<br />
data set which provides for disaggregation <strong>of</strong> fisheries<br />
production on a provincial level, and b) LGU data which<br />
are presented in plans or in various published and<br />
unpublished reports. For <strong>the</strong> capture sector, all coastal<br />
municipalities <strong>of</strong> Batangas were included, assuming<br />
that <strong>the</strong>ir main fishing area is in <strong>the</strong> <strong>Verde</strong> <strong>Island</strong><br />
<strong>Passage</strong>.<br />
As for aquaculture, we only considered brackish water<br />
fishponds and seaweed production and expressly<br />
ignored <strong>the</strong> huge volume <strong>of</strong> production from Taal<br />
Lake. For Oriental Mindoro, we assumed all 14<br />
coastal municipalities contribute to, and are fishing in,<br />
<strong>Verde</strong> <strong>Island</strong> <strong>Passage</strong>. For Occidental Mindoro, we<br />
only considered <strong>the</strong> four municipalities that include<br />
Paluan, Abra de Ilog, Lubang, and Looc and as such,<br />
provincial level production was divided equally by all<br />
11 municipalities and multiplied by four in order to get<br />
appropriate attribution for <strong>the</strong>se four.<br />
small pelagic<br />
62%<br />
Fig. 43. Fisheries production by major species in <strong>Verde</strong><br />
<strong>Island</strong> <strong>Passage</strong>.<br />
Our estimates are shown in Tables 25-27 and indicate<br />
that <strong>Verde</strong> <strong>Island</strong> <strong>Passage</strong> contributes somewhere<br />
between 40-47 thousand MT per year with <strong>the</strong> province<br />
<strong>of</strong> Batangas contributing <strong>the</strong> most. The 6,000 MT<br />
average for Occidental Mindoro is already a weighted<br />
figure for <strong>the</strong> four municipalities, as explained, and so<br />
appear to be lower than BAS statistics. Ano<strong>the</strong>r 4,000<br />
MT was estimated to be from <strong>the</strong> aquaculture sector<br />
(bangus, prawns, and seaweeds). As for aquarium<br />
fishing, ano<strong>the</strong>r activity studied, we assume that<br />
production was not recorded at both LGU and BAS<br />
levels.<br />
Small pelagics are <strong>the</strong> most important species group<br />
caught in <strong>Verde</strong> <strong>Island</strong> <strong>Passage</strong> with Batangas alone<br />
contributing an average <strong>of</strong> 18,000 MT per year. The<br />
Table 25. Marine fisheries production (thousand MT) from <strong>the</strong> commercial<br />
and municipal sectors estimated for <strong>Verde</strong> <strong>Island</strong> <strong>Passage</strong> from 2005-2007.<br />
Province 2005 2006 2007<br />
Batangas<br />
Occidental Mindoro<br />
Oriental Mindoro<br />
Total<br />
Source: Basic data from BAS 2007.<br />
20.10<br />
5.93<br />
13.30<br />
39.33<br />
27.80<br />
6.29<br />
13.20<br />
47.29<br />
26.40<br />
6.76<br />
13.90<br />
47.06<br />
55
climate change vulnerability assessment <strong>of</strong> <strong>the</strong> verde island passage, philippines<br />
dominant small pelagic species include roundscad,<br />
anchovies, mackerel, and sardines while <strong>the</strong> tuna<br />
species caught include skipjack and yellowfin.<br />
Demersal species include slipmouths, threadfin bream,<br />
and squid. For <strong>the</strong> three provinces, <strong>the</strong> distribution <strong>of</strong><br />
major species caught is similar, and in all cases small<br />
pelagics dominate <strong>the</strong> production total. This study<br />
found that tuna ranks second and demersals rank third,<br />
in all provinces. Soliman (manuscript) suggests that<br />
Mabini and Tingloy toge<strong>the</strong>r contribute to about 2000<br />
MT per year <strong>of</strong> tuna per year or more than half <strong>of</strong> <strong>the</strong><br />
total Batangas production.<br />
Table 26. Aquaculture production (thousand MT) from brackish water<br />
fishponds and seaweed farms estimated for <strong>Verde</strong> <strong>Island</strong> <strong>Passage</strong> from<br />
2005-2007.<br />
Province 2005 2006 2007<br />
Fishponds<br />
Batangas<br />
Occidental Mindoro<br />
Oriental Mindoro<br />
Total fishponds<br />
Seaweeds<br />
Batangas<br />
Occidental Mindoro<br />
Oriental Mindoro<br />
Total seaweeds<br />
0.19<br />
0.76<br />
2.05<br />
3.00<br />
0.50<br />
0.51<br />
0.15<br />
1.16<br />
0.19<br />
0.78<br />
2.14<br />
3.11<br />
0.70<br />
0.55<br />
0.14<br />
1.39<br />
Table 27. Estimates for tuna, small pelagics and demersal fish catch<br />
(thousand MT) from <strong>the</strong> <strong>Verde</strong> <strong>Island</strong> <strong>Passage</strong> from 2005-2007.<br />
0.16<br />
0.86<br />
2.22<br />
3.24<br />
1.00<br />
0.58<br />
0.12<br />
1.70<br />
3 year<br />
Province 2005 2006 2007 average<br />
ii. Fishers and fishing units<br />
We estimated a total <strong>of</strong> 12,000 municipal and<br />
commercial fishers were utilizing <strong>the</strong> fisheries resources<br />
<strong>of</strong> <strong>Verde</strong> <strong>Island</strong> <strong>Passage</strong>. It was not possible to<br />
disaggregate <strong>the</strong> numbers <strong>of</strong> commercial and municipal<br />
fishers to <strong>the</strong> major species group (tuna, small pelagics,<br />
and demersals) because both sectors were exploiting<br />
<strong>the</strong> same target species albeit using different gears or<br />
size/power <strong>of</strong> boats. The same observation on targeting<br />
similar species is echoed by Soliman in his manuscript<br />
on Mabini and Tingloy. However, we estimated <strong>the</strong><br />
number <strong>of</strong> municipal and commercial fishers by<br />
extrapolating from available data. Data from Batangas<br />
Provincial Agriculturists Office suggested that <strong>the</strong>re<br />
were approximately 550 commercial fishers, and<br />
ano<strong>the</strong>r 400 deep sea fishers from Lubang municipality.<br />
We <strong>the</strong>refore used a conservative estimate <strong>of</strong> 2,000<br />
commercial fishers out <strong>of</strong> <strong>the</strong> total 12,000.<br />
We could not make any judgment on whe<strong>the</strong>r <strong>the</strong>se<br />
numbers include aquarium fishers but we never<strong>the</strong>less<br />
indicated <strong>the</strong> numbers in Table 28.<br />
Table 28. Number <strong>of</strong> commercial and municipal fishers per province<br />
including aquarium fishers (estimates from various sources).<br />
Commercial and<br />
municipal Aquarium<br />
Province fishers fishers Source<br />
Batangas<br />
Batangas City<br />
(Bgy Sn Andres, <strong>Verde</strong> Is.)<br />
9508<br />
117<br />
Rosales consultancy<br />
report for CI (2006)<br />
MAC Report, Reef Check<br />
Report<br />
Tuna<br />
Batangas<br />
Occidental Mindoro<br />
Oriental Mindoro<br />
Small Pelagics<br />
Batangas<br />
Occidental Mindoro<br />
Oriental Mindoro<br />
3.24<br />
0.98<br />
3.06<br />
14.26<br />
3.83<br />
8.10<br />
4.42<br />
1.15<br />
2.97<br />
19.99<br />
4.14<br />
8.10<br />
3.75<br />
1.34<br />
2.94<br />
18.81<br />
4.40<br />
8.74<br />
3.80<br />
1.16<br />
2.99<br />
17.69<br />
4.12<br />
8.31<br />
Occidental Mindoro<br />
Lubang<br />
Looc<br />
Paluan<br />
Oriental Mindoro<br />
Total<br />
1300<br />
614<br />
258<br />
420<br />
1477<br />
12200<br />
14<br />
14<br />
20<br />
(estimate only) 250<br />
MAC Report, Reef Check<br />
Report<br />
Coastal resource pr<strong>of</strong>ile<br />
<strong>of</strong> Oriental Mindoro<br />
Demersals<br />
Batangas<br />
Occidental Mindoro<br />
Oriental Mindoro<br />
2.60<br />
1.12<br />
2.14<br />
3.39<br />
1.00<br />
2.13<br />
3.84<br />
1.03<br />
2.22<br />
3.28<br />
1.05<br />
2.16<br />
56
chapter 2 • human well-being and climate change: results and discussion<br />
iii. Aquarium fisheries<br />
Aquarium fishing is prevalent in <strong>Verde</strong> <strong>Island</strong> (under <strong>the</strong><br />
jurisdiction <strong>of</strong> Batangas City) Lubang, Looc, and Paluan<br />
and all <strong>of</strong> Occidental Mindoro. Studies on <strong>the</strong> aquarium<br />
trade indicate that aquarium fishing is also practiced in<br />
Lian and Calatagan (Figure 44).<br />
(use hands or hand-based tools) divers or those who<br />
do not use any air-supplying device. Dives may last<br />
from 8 am until 2 pm every day until enough fish are<br />
assembled, i.e., about 500 to 1000 assorted tropical<br />
fish, after which <strong>the</strong> catch is brought to Tabangao en<br />
route to Manila. A comparison <strong>of</strong> average monthly<br />
incomes <strong>of</strong>: a) mano mano fisher; b) hookah collector<br />
(including crew), and c) trader indicate that <strong>the</strong> mano<br />
mano fisher earns an average <strong>of</strong> P4,600 per month<br />
compared to <strong>the</strong> hookah collector who earns P5,100.<br />
The trader earns <strong>the</strong> highest at P7,800 per month<br />
(MAC Report).<br />
Despite <strong>the</strong> relatively low average monthly incomes,<br />
<strong>the</strong> income <strong>of</strong> mano mano fishers may be as high as<br />
P12,000 in some months, and hookah fishers as high<br />
as P19,000, presumably when catches are high and<br />
when <strong>the</strong> expensive species are caught.<br />
Fig. 44. Roving collection routes in <strong>the</strong> <strong>Verde</strong> <strong>Island</strong> <strong>Passage</strong><br />
corridor.<br />
A feature article that chronicles <strong>the</strong> lives and practices<br />
<strong>of</strong> aquarium fishers <strong>of</strong> Barangay San Andres in <strong>Verde</strong><br />
<strong>Island</strong> has anecdotal details that indicate vulnerable<br />
marine resources and human communities in <strong>the</strong><br />
passage (Lesaba 2009). In that community, 90% <strong>of</strong> <strong>the</strong><br />
population (about 1200 people) is engaged in diving<br />
for tropical fish or aquaculture. They go to areas with<br />
good reefs and catch species such as yellow wrasse,<br />
sexline wrasse, longnose pupper, white fin lion, spot fin<br />
anthias. Occasionally, <strong>the</strong>y catch “Majestic” which are<br />
priced at P800 to P1000 apiece. It is more <strong>of</strong> a way<br />
<strong>of</strong> life for <strong>the</strong> people <strong>of</strong> Barangay San Andres so <strong>the</strong>y<br />
have to continuously adapt to local regulations and find<br />
some enterprising “sponsors” in o<strong>the</strong>r municipalities/<br />
provinces.<br />
Ironically, <strong>the</strong> practice is banned not only in <strong>Verde</strong> <strong>Island</strong><br />
but also in <strong>the</strong> barangay which breeds aquarium fishers<br />
and this is <strong>the</strong> reason why <strong>the</strong> practice is exported<br />
to places such as Lubang and Looc in Occidental<br />
Mindoro (Figure 44). Conservation International has<br />
also commissioned <strong>the</strong> Marine Aquarium Council<br />
(MAC) and Reefcheck to investigate sustainability<br />
options for roving aquarium fishers in <strong>the</strong> <strong>Verde</strong> <strong>Island</strong><br />
<strong>Passage</strong>.<br />
The collection practice itself is dependent on good<br />
wea<strong>the</strong>r, especially for those who are “mano mano”<br />
Early analyses <strong>of</strong> <strong>the</strong> effects <strong>of</strong> El Niño on tuna fisheries<br />
in <strong>the</strong> <strong>Philippines</strong> point to minimal or no impacts on<br />
overall production. Barut (1999) argues that Philippine<br />
waters approximate that <strong>of</strong> <strong>the</strong> Western Tropical Pacific<br />
(WTP) where no warm water intrusion is bound to<br />
occur and even if it does, tuna is known to <strong>the</strong>rmoregulate.<br />
Fur<strong>the</strong>r observations <strong>of</strong> U.S. tuna fleets<br />
support <strong>the</strong> claim that no change in production is<br />
expected in <strong>the</strong> WTP waters. Meanwhile, <strong>the</strong> Australian<br />
Bluefin Association observed an increase in tuna<br />
production, and an increase in small pelagics, especially<br />
in areas where upwelling occurs.<br />
Recent climate change studies depict more <strong>of</strong> a<br />
downtrend in production and a shift in abundance<br />
at higher latitudes (Aaheim and Sygna 2000) and<br />
modeled changes for skipjack (Pratchett et al. 2008).<br />
Increased water temperature is forecast to result in<br />
changes to <strong>the</strong> distribution and abundance <strong>of</strong> tuna<br />
towards <strong>the</strong> Central Pacific and away from <strong>the</strong> Coral<br />
Triangle area. Moreover <strong>the</strong> impacts <strong>of</strong> increasing water<br />
temperature on habitats and incidence <strong>of</strong> storms and<br />
acidification threaten coastal habitats such as coral<br />
reefs. Lehodey (2000) agrees with <strong>the</strong> shift in spatial<br />
distribution and decline in abundance <strong>of</strong> fisheries,<br />
especially in <strong>the</strong> Pacific, but recognizes that some<br />
countries may in fact gain from this anticipated change.<br />
iv. Small pelagics fisheries<br />
The importance <strong>of</strong> <strong>the</strong> small pelagic fisheries sector in<br />
<strong>Verde</strong> <strong>Island</strong> <strong>Passage</strong> can be gleaned from production<br />
statistics. Annual average production <strong>of</strong> small pelagics<br />
(sardines, anchovies, round scads, and mackerels) total<br />
more than 30, 000 MT. In Batangas province, more than<br />
70% <strong>of</strong> catch is small pelagics and in <strong>the</strong> two Mindoro<br />
provinces, more than 60% <strong>of</strong> catch is small pelagics.<br />
Both commercial and municipal fishers exploit <strong>the</strong> small<br />
pelagics fisheries.<br />
57
climate change vulnerability assessment <strong>of</strong> <strong>the</strong> verde island passage, philippines<br />
Like tuna, small pelagics are observed to favor deeper,<br />
cooler waters during periods <strong>of</strong> drought or El Niño.<br />
In such cases, <strong>the</strong> movement <strong>of</strong> <strong>the</strong>se fish to deeper<br />
waters may assist commercial fishing gears such<br />
as ringnets and Danish seines. In nearshore waters,<br />
competition among municipal fishers will intensify<br />
unless gear adaptation occurs.<br />
v. Demersals<br />
Total production <strong>of</strong> demersal fish (represented by<br />
threadfin bream, squid and slipmouths) has an annual<br />
average <strong>of</strong> 6,000 MT for <strong>Verde</strong> <strong>Island</strong> <strong>Passage</strong>. In<br />
percentage terms, it is similar to tuna which contributes<br />
somewhere between 10 and 15% <strong>of</strong> total production.<br />
In value terms, <strong>the</strong> demersal fishery has <strong>the</strong> highest<br />
value contribution at more than P400 million pesos, on<br />
average, compared to P372 million for small pelagics,<br />
and an even smaller value for tuna at P142 million<br />
a year. This can be explained by <strong>the</strong> higher prices<br />
obtained for demersal species.<br />
It should be emphasized, however, that <strong>the</strong>se estimates<br />
are based on available data from BAS and that BAS<br />
limits itself to <strong>the</strong> collection <strong>of</strong> statistics for <strong>the</strong> first 30<br />
most important commercial species.<br />
Demersal species are closely linked to habitat<br />
conditions, and more specifically to coral reefs. Climate<br />
change impacts may result in population declines<br />
due to loss <strong>of</strong> settlement habitat and erosion <strong>of</strong><br />
habitat structural complexity, while increased ocean<br />
temperature will affect <strong>the</strong> physiological performance<br />
and behavior <strong>of</strong> coral reef fishes and cause shifts in<br />
recruitment patterns and reproduction. In extreme<br />
cases, we may see <strong>the</strong> extinction <strong>of</strong> small-range<br />
species.<br />
vi. Coastal aquaculture (seaweeds and fishponds)<br />
Production estimates for coastal aquaculture comprise<br />
about 3, 000 tons from brackish water fishponds<br />
and ano<strong>the</strong>r 2, 000 MT from seaweeds. While not<br />
significant based on volume <strong>of</strong> production, seaweeds<br />
provide livelihoods to wives <strong>of</strong> fishers and o<strong>the</strong>r<br />
community members. Requiring relatively little capital<br />
and with huge returns, seaweed aquaculture is touted<br />
as a “poverty alleviation” tool by government.<br />
In Calatagan, Batangas, Tambuyog (2005) analyzes <strong>the</strong><br />
growth <strong>of</strong>, and issues related to, <strong>the</strong> seaweed industry.<br />
Seaweed farming was introduced in Calatagan in 1971<br />
from Zamboanga. At time <strong>of</strong> writing, <strong>the</strong>re were around<br />
1, 200 seaweed cultivators dispersed over five <strong>of</strong> <strong>the</strong><br />
19 coastal barangays, mainly concentrated in three<br />
barangays: Barangay Uno, Dos, and Balitoc, but also in<br />
Barangay Gulod and Barangay Carretunan. The current<br />
numbers <strong>of</strong> seaweed farmers could not be confirmed,<br />
but reports indicate that <strong>the</strong> practice still exists.<br />
The monthly income from seaweed farming would<br />
normally range from P8, 167 to P14, 672 assuming<br />
that <strong>the</strong>re were no typhoons or disease outbreaks to<br />
adversely affect production. These figures are higher<br />
than <strong>the</strong> income from fishing, but as already mentioned,<br />
<strong>the</strong> cost <strong>of</strong> labor is not fully included as seaweed<br />
production is mainly a family enterprise. However, given<br />
that at least three production cycles can be completed<br />
in one year, seaweed farming appears to be highly<br />
pr<strong>of</strong>itable.<br />
Seaweeds may be impacted by climate change due<br />
to increasing sea surface temperatures and declining<br />
water quality levels. Based on <strong>the</strong> observation by<br />
Monzales, seaweeds farmed using bottomset methods<br />
suffered almost unilaterally compared to those using<br />
a floating system. Likewise, water quality and <strong>the</strong><br />
absence <strong>of</strong> pollutants provide an ideal environment for<br />
seaweeds.<br />
Data obtained from <strong>the</strong> Calapan City Coastal<br />
Environmental Pr<strong>of</strong>ile indicate that brackish water<br />
fishponds for bangus cover about one thousand<br />
hectares with annual production <strong>of</strong> 2,000 MT (2005<br />
statistics). With a productivity <strong>of</strong> about 2 tons ha-1, <strong>the</strong><br />
estimated income per hectare <strong>of</strong> bangus fishpond is<br />
P200, 000 per hectare.<br />
Tourism<br />
Tourism in <strong>Verde</strong> <strong>Island</strong> <strong>Passage</strong> has traditionally been<br />
limited to a few areas and activities within <strong>the</strong> entire<br />
passage. Recreational activities are focused mainly on<br />
<strong>the</strong> area’s natural attributes, many <strong>of</strong> which are marinebased.<br />
Increasing importance <strong>of</strong> tourism is <strong>the</strong> recent<br />
trend that climate change may most affect.<br />
There is no comprehensive pr<strong>of</strong>ile for <strong>the</strong> tourism<br />
sector that covers all areas within <strong>the</strong> <strong>Verde</strong> <strong>Island</strong><br />
<strong>Passage</strong>. What is presented in this study are initial data<br />
sets on <strong>the</strong> tourism pr<strong>of</strong>ile <strong>of</strong> <strong>the</strong> <strong>Passage</strong> from three<br />
sources, i.e., a) a start-up passage-wide pr<strong>of</strong>ile from<br />
a workshop covering Lian, Mabini, Tingloy, Calatagan,<br />
San Teodoro, Bauan, Calapan and Puerto Galera—all<br />
tourism destination sites; b) information from a prior<br />
study confined to <strong>the</strong> Batangas side and with a detailed<br />
pr<strong>of</strong>ile provided for only one municipality, Mabini (where<br />
scuba diving activities are concentrated); and c)<br />
supplemental focused primary research, also in Mabini,<br />
to generate updated information on <strong>the</strong> economic<br />
engagement <strong>of</strong> local communities.<br />
This effort demonstrates how opportunistic data<br />
accessed from agencies and representative sites or<br />
case studies can be an appropriate approach when<br />
initiating a vulnerability assessment. The choice <strong>of</strong> focus<br />
area for <strong>the</strong> <strong>Verde</strong> <strong>Island</strong> <strong>Passage</strong> is only intended<br />
to show how pr<strong>of</strong>iles in general can be used as an<br />
58
chapter 2 • human well-being and climate change: results and discussion<br />
initial step for assessing overall vulnerability <strong>of</strong> <strong>the</strong><br />
tourism sector. The complete pr<strong>of</strong>ile, and eventually <strong>the</strong><br />
vulnerability assessment, will hopefully be undertaken<br />
more comprehensively by <strong>the</strong> local stakeholders in<br />
succeeding workshops.<br />
i. Important tourist activities and destinations<br />
A pr<strong>of</strong>ile <strong>of</strong> <strong>the</strong> marine tourism sector summarized in<br />
Table 29 shows that diving is <strong>the</strong> most popular activity<br />
<strong>of</strong>fered by resort owners. Puerto Galera and Mabini are<br />
<strong>the</strong> main destinations, although a significant number <strong>of</strong><br />
dive spots are located in Tingloy as well. Lian is a major<br />
destination for swimmers and picnic goers, as reflected<br />
by <strong>the</strong> very large number <strong>of</strong> establishments for such<br />
purposes. January to May is <strong>the</strong> peak season for most<br />
recreational activities, however in some areas, tourism is<br />
experienced all year round.<br />
Tourist traffic is high in <strong>Verde</strong> <strong>Island</strong> <strong>Passage</strong>, as<br />
reflected by <strong>the</strong> estimated number <strong>of</strong> divers, swimmers,<br />
and snorkelers. It would be beneficial to establish<br />
a more accurate figure for monitoring purposes.<br />
Never<strong>the</strong>less, <strong>the</strong> initial estimates are high enough<br />
to classify <strong>Verde</strong> <strong>Island</strong> <strong>Passage</strong> as a major tourist<br />
destination for coastal and marine recreational activities.<br />
ii. Employment and revenues generated by tourism<br />
Table 30 provides an indication <strong>of</strong> <strong>the</strong> employment<br />
generated by marine tourism. As expected, boat<br />
operators are very much in demand. These recreational<br />
boat operators were former fisherfolk, validating <strong>the</strong><br />
statement that tourism complements conservation as<br />
<strong>the</strong> sector provides alternative livelihood for locals,<br />
providing opportunities to cease resource extractive or<br />
environmentally destructive activities.<br />
The exact share or contribution <strong>of</strong> marine tourism to<br />
<strong>the</strong> total economy <strong>of</strong> <strong>Verde</strong> <strong>Island</strong> <strong>Passage</strong> could not<br />
be ascertained in this project. It was agreed that this<br />
has to be established with more data, and it would be<br />
beneficial to determine how important <strong>the</strong> sector is in<br />
providing income and employment to municipalities and<br />
provinces, and to <strong>the</strong> country as a whole.<br />
Only Mabini was able to provide figures on estimated<br />
revenue generated in <strong>the</strong> diving industry, which appear<br />
to be highly significant to <strong>the</strong> local economy (Table 31).<br />
Annual resort revenues are estimated to be PhP 88<br />
million, and <strong>the</strong> sector contributes to local employment<br />
valued at PhP 33 million and to local government’s<br />
CRM revenues at PhP 1.3 million. This is a minimum<br />
Table 29. Tourism pr<strong>of</strong>ile in <strong>the</strong> <strong>Verde</strong> <strong>Island</strong> <strong>Passage</strong>, 2009.<br />
Number <strong>of</strong> Number <strong>of</strong> Annual<br />
establishments/ tourists revenues<br />
Activities Location units Season per year in PhP<br />
Wind Surfing<br />
Puerto Galera<br />
1<br />
non-peak: rainy season<br />
no data<br />
Diving<br />
Puerto Galera<br />
Mabini<br />
50 +<br />
34<br />
all year round, except when <strong>the</strong>re<br />
are typhoons<br />
Jan-May: high; Jun to Sep: low;<br />
Oct-Dec: medium<br />
350<br />
Mabini-Tingloy:<br />
20,000-22,000 divers<br />
4.2M from boat rentals; 88M from<br />
resorts; 1.2M unified divers’ fees<br />
Bauan<br />
Tingloy<br />
Calatagan<br />
San Teodoro<br />
5<br />
4<br />
1<br />
1<br />
Jan-May: high; Jun to Sep: low;<br />
Oct-Dec: medium<br />
Jan-May: high; Jun to Sep: low;<br />
Oct-Dec: medium<br />
200/week during peak<br />
season<br />
Mabini-Tingloy: 20,000-<br />
22,000 divers<br />
3900/day<br />
1M unified divers’ fees<br />
Snorkeling<br />
Bauan<br />
Puerto Galera<br />
2<br />
Jan-May: high; Oct-Dec: medium<br />
200/week<br />
100,000<br />
Swimming<br />
Lian<br />
800<br />
all year round; peak season during<br />
summer<br />
50,000/day during peak<br />
season<br />
Boat Trips<br />
Calatagan<br />
1<br />
Kayaking<br />
Puerto Galera<br />
10 establishments;<br />
100 units<br />
Jetski<br />
Calatagan<br />
Puerto Galera<br />
Calapan<br />
1<br />
10 establishments;<br />
20 units<br />
Wakeboarding<br />
Calatagan<br />
1<br />
all year round<br />
Skim boarding<br />
Puerto Galera<br />
Banana boat<br />
Mabini<br />
Puerto Galera<br />
Calapan<br />
150<br />
Source: Tourism Sector Workshop for <strong>the</strong> VA, Batangas City, 2009.<br />
59
climate change vulnerability assessment <strong>of</strong> <strong>the</strong> verde island passage, philippines<br />
Table 30. Employment generated in <strong>the</strong> marine tourism sector, <strong>Verde</strong> <strong>Island</strong><br />
<strong>Passage</strong>, 2009.<br />
Type <strong>of</strong><br />
Activities Employment generated employment<br />
Wind Surfing<br />
Diving<br />
Snorkeling<br />
Swimming<br />
Boat Trips<br />
Kayaking<br />
Jetski<br />
Wakeboarding<br />
Skim boarding<br />
Banana boat<br />
boat rental; instructors;<br />
Puerto Galera: 345 boatmen (with membership<br />
in <strong>the</strong> association); 125 diving instructors;<br />
equipment rental<br />
Mabini: boat rental; van rental<br />
boat operator; equipment rental<br />
resort operation; boat rental; balsa<br />
rental; lifesaver rental; o<strong>the</strong>r small-scale<br />
entrepreneurship (sari-sari store, videoke<br />
rental, vending <strong>of</strong> souvenir items and backyard<br />
agricultural production)<br />
boat operation<br />
Puerto Galera: 20 operators; equipment rental<br />
kayak fare; boat operator<br />
Source: Tourism Sector Workshop for <strong>the</strong> VA, Batangas City, 2009.<br />
skilled<br />
skilled<br />
managerial<br />
staff/helper<br />
skilled<br />
skilled<br />
estimate, considering that real estate and income taxes<br />
are not included in <strong>the</strong>se estimates. More importantly,<br />
o<strong>the</strong>r tourist expenses such as those for land and water<br />
transport, food on-site and o<strong>the</strong>r related expenses are<br />
Table 31. CRM revenues in Mabini, 2003 to 2008.<br />
Number<br />
Collected dive<br />
Year <strong>of</strong> divers fees (PhP)<br />
2003<br />
2004<br />
2005<br />
2006<br />
2007<br />
2008<br />
5-Year Average<br />
2,225<br />
10,005<br />
16,778<br />
Source: Municipal Environment and Natural Resources Office, Mabini, Batangas.<br />
225,000<br />
1,000,510<br />
1,677,750<br />
1,350,000<br />
1,130,300<br />
1,150,000<br />
1,299,894<br />
also not included. Assuming a minimum amount <strong>of</strong><br />
transport expense <strong>of</strong> PhP 500 and food expenses at<br />
PhP 500 per person, o<strong>the</strong>r tourist expenses could be in<br />
<strong>the</strong> amount <strong>of</strong> PhP 12 million for scuba divers alone.<br />
In <strong>the</strong> case <strong>of</strong> <strong>the</strong> Batangas portion <strong>of</strong> <strong>the</strong> <strong>Passage</strong>,<br />
Tables 32 and 33 show that <strong>the</strong> types <strong>of</strong> tourist<br />
attractions available confirm marine-based tourism<br />
as an important attraction—with Nasugbu, Mabini,<br />
Tinglliy, and Lian being <strong>the</strong> coastal municipalities with<br />
<strong>the</strong> most natural attractions. Beach and dive resorts<br />
(195 and 36, respectively) were <strong>the</strong> most common<br />
tourist establishments with accommodations, among all<br />
tourism establishments, as <strong>of</strong> 2004.<br />
Table 32. Tourist attractions in <strong>the</strong> Batangas portion <strong>of</strong> <strong>the</strong> <strong>Verde</strong> <strong>Passage</strong> MBCC, 2003 to 2004.<br />
Tourist attractions<br />
Municipality/<br />
ancestral<br />
city historical cultural religious festivals natural house Total<br />
Batangas Study Area<br />
Balayan<br />
Bauan<br />
Calaca<br />
Calatagan<br />
Lemery<br />
Lian<br />
Mabini<br />
Nasugbu<br />
San Luis<br />
Taal<br />
Tingloy<br />
Tuy<br />
10<br />
1<br />
1<br />
1<br />
6<br />
1<br />
9<br />
1<br />
8<br />
2<br />
2<br />
5<br />
1<br />
1<br />
1<br />
2<br />
23<br />
1<br />
3<br />
5<br />
10<br />
4<br />
19<br />
2<br />
1<br />
16<br />
68<br />
5<br />
2<br />
3<br />
1<br />
3<br />
5<br />
10<br />
34<br />
5<br />
Source: Provincial Tourism Office, Batangas.<br />
Table 33. Tourist accommodations in <strong>the</strong> Batangas portion <strong>of</strong> <strong>the</strong> <strong>Verde</strong> <strong>Passage</strong>, MBCC, 2003 to 2004.<br />
Hotel/restaurant/resort/lodge/<br />
Municipality/ Dive Beach <strong>Island</strong> Golf Boat pension house/inn/apartelle/ O<strong>the</strong>r<br />
city resort resort resort club club convention-seminar center accommodations Total<br />
Batangas Study Area<br />
Balayan<br />
Bauan<br />
Calaca<br />
Calatagan<br />
Lemery<br />
Lian<br />
Mabini<br />
Nasugbu<br />
San Luis<br />
Taal<br />
Tingloy<br />
Tuy<br />
36<br />
4<br />
26<br />
1<br />
3<br />
2<br />
195<br />
9<br />
14<br />
30<br />
7<br />
24<br />
7<br />
65<br />
28<br />
5<br />
5<br />
1<br />
4<br />
1<br />
2<br />
1<br />
3<br />
1<br />
2<br />
1<br />
1<br />
31<br />
6<br />
5<br />
5<br />
3<br />
3<br />
6<br />
1<br />
2<br />
4<br />
3<br />
1<br />
274<br />
15<br />
23<br />
33<br />
13<br />
27<br />
10<br />
98<br />
36<br />
8<br />
7<br />
4<br />
Source: Provincial Tourism Office, Batangas.<br />
60
chapter 2 • human well-being and climate change: results and discussion<br />
Most <strong>of</strong> <strong>the</strong> resorts were located in Mabini, followed by<br />
Calaca and Nasugbu with peak occupancy during <strong>the</strong><br />
months <strong>of</strong> March to May and towards <strong>the</strong> Christmas<br />
season from November to January.<br />
The most common activity is scuba diving, narrowly<br />
concentrated within <strong>the</strong> municipalities <strong>of</strong> Mabini and<br />
Tingloy, and a few more dive sites and resorts in <strong>Verde</strong><br />
<strong>Island</strong> (Table 34). Within <strong>the</strong> past two decades, <strong>Verde</strong><br />
<strong>Passage</strong> has consistently been increasing its popularity<br />
as <strong>the</strong> premiere scuba diving destination in mainland<br />
Luzon. A significant number <strong>of</strong> scuba divers and<br />
marine recreationists have been flocking to <strong>the</strong> area,<br />
as reflected in <strong>the</strong> increasing revenues collected from<br />
diving entrance fees.<br />
<strong>Verde</strong> <strong>Island</strong> is likewise being promoted as ano<strong>the</strong>r<br />
diving destination in <strong>the</strong> area. Although no primary data<br />
is available, estimates have shown that a significant<br />
number <strong>of</strong> divers have been visiting dive sites over<br />
<strong>the</strong> past few years. These divers, however, are likely<br />
to be <strong>the</strong> same divers going to dive sites in Mabini-<br />
Tingloy and Puerto Galera. There is only one resort<br />
on <strong>the</strong> island, and most divers are billeted in tourism<br />
establishments elsewhere. In 2004, between 1,000 and<br />
2,000 divers visited <strong>Verde</strong> <strong>Island</strong>.<br />
Table 34. Estimated number <strong>of</strong> divers in <strong>Verde</strong> <strong>Island</strong>, CY 2004.<br />
Source <strong>of</strong> information<br />
Revenues from Bgy. San<br />
Agapito’s divers’ fees in PhP<br />
Interview with Bgy. Chair <strong>of</strong><br />
San Agustin Kanluran<br />
Dive Camp Resort<br />
Estimated total number <strong>of</strong> divers<br />
1,800 six months <strong>of</strong> a year<br />
260 to 1,040 divers a year<br />
720 to 1200 divers a month during peak months<br />
Source: Rosales, R. 2005. Report on <strong>the</strong> Establishment <strong>of</strong> User Fees for Scuba Diving in <strong>Verde</strong> <strong>Island</strong>.<br />
iii. Case Study: Updates in <strong>the</strong> tourism pr<strong>of</strong>ile <strong>of</strong><br />
Mabini, Batangas<br />
Mabini presents itself as a strategic location as far as<br />
<strong>the</strong> tourism sector is concerned. Scuba diving is a<br />
prominent activity in <strong>the</strong> area. The coral reefs <strong>of</strong> Mabini<br />
and Tingloy are favorite diving sites <strong>of</strong> both foreign and<br />
local divers who visit from Manila. At present, <strong>the</strong>re are<br />
39 dive sites scattered throughout <strong>the</strong> coastal waters<br />
<strong>of</strong> <strong>the</strong>se two municipalities. Most sites (i.e., 23) are<br />
located in Tingloy, although tourist facilities are mostly<br />
in Mabini.<br />
As mentioned above, most tourist resorts in <strong>Verde</strong><br />
<strong>Island</strong> <strong>Passage</strong> are located in this municipality. Out <strong>of</strong><br />
a total 24 resorts, 14 cater exclusively to divers, three<br />
are for beach goers and swimmers, and seven cater to<br />
both types <strong>of</strong> tourists (Table 35). O<strong>the</strong>r types <strong>of</strong> waterbased<br />
activities <strong>of</strong>fered by resorts include kayaking,<br />
banana boats, pedal boats, snorkeling, island hopping<br />
and swimming. A few <strong>of</strong>fer additional activities such as<br />
game fishing, surfing, water skiing, and jet skiing.<br />
Table 35. Resorts in Mabini Municipality, by Barangay, 2009.<br />
Number <strong>of</strong> resorts<br />
Location beach dive both Total<br />
San Jose<br />
Ligaya<br />
Solo<br />
San Teodoro<br />
Bagalangit<br />
Total<br />
Source: Field interviews, June 2009.<br />
1<br />
2<br />
3<br />
2<br />
3<br />
4<br />
5<br />
14<br />
Capacity for visitors is around 1,061 persons at any<br />
point in time, based on <strong>the</strong> number <strong>of</strong> rooms available<br />
for occupancy and <strong>the</strong> maximum capacity per room<br />
(Table 36). The total does not include visitors who visit<br />
during <strong>the</strong> day but do not spend <strong>the</strong> night at resorts.<br />
Table 36. Number <strong>of</strong> rooms and maximum capacity in Mabini, by Barangay,<br />
2009.<br />
Maximum visitor<br />
Location Room capacity capacity<br />
San Jose<br />
Ligaya<br />
Solo<br />
San Teodoro<br />
Bagalangit<br />
Total<br />
Source: Field interviews, June 2009.<br />
15<br />
59<br />
89<br />
85<br />
88<br />
336<br />
All resorts are located in <strong>the</strong> foreshore area <strong>of</strong> Mabini,<br />
with establishments ranging from a distance <strong>of</strong> less<br />
than one meter to 20 meters from <strong>the</strong> shoreline (Table<br />
37). The big resorts are located in San Teodoro, while<br />
<strong>the</strong> smaller ones are in Ligaya. The o<strong>the</strong>r barangays<br />
have a mix <strong>of</strong> relatively large and relatively small resorts.<br />
The total area occupied by tourist resorts is 26,875<br />
square meters.<br />
3<br />
2<br />
1<br />
1<br />
7<br />
62<br />
191<br />
334<br />
243<br />
231<br />
1,061<br />
Table 37. Area occupied by tourist resorts, Mabini, June 2009.<br />
Far<strong>the</strong>st distance Nearest distance Area occupied<br />
Location from shore (m) from shore (m) (sq m)<br />
San Jose<br />
Ligaya<br />
Solo<br />
San Teodoro<br />
Bagalangit<br />
Total<br />
10<br />
5<br />
20<br />
15<br />
10<br />
Source: Field interviews, June 2009.<br />
< 1<br />
5<br />
5<br />
2.5<br />
5<br />
3<br />
5<br />
4<br />
6<br />
6<br />
24<br />
1,800<br />
1,900<br />
3,625<br />
14,225<br />
5,325<br />
26,875<br />
Occupancy averages around 80 nights (1 night=<br />
1 room occupied) per resort per year. The lowest<br />
occupancy registered at 13, while <strong>the</strong> highest was at<br />
247. This translates to an average <strong>of</strong> PhP3.835 million<br />
per year, or PhP88.215 million in total revenues for<br />
all resorts in a year (Table 38). Annual revenues per<br />
resort ranged from a low <strong>of</strong> PhP104,400 to PhP36.386<br />
million. Sixteen resorts had revenues above PhP one<br />
million.<br />
61
climate change vulnerability assessment <strong>of</strong> <strong>the</strong> verde island passage, philippines<br />
Table 38. Occupancy and annual revenues, Mabini tourist resorts, June<br />
2009.<br />
Annual occupancy<br />
Average number <strong>of</strong> nights per resort<br />
Total number <strong>of</strong> nights for Mabini<br />
Annual revenues<br />
Average per resort, in PhP<br />
Total for Mabini, in PhP<br />
80<br />
1,839<br />
3,835,422<br />
88,214,695<br />
Source: Rosales, R. 2005. Report on <strong>the</strong> Establishment <strong>of</strong> User Fees for Scuba Diving in <strong>Verde</strong> <strong>Island</strong>.<br />
Resorts employ a significant number <strong>of</strong> locals in <strong>the</strong>ir<br />
operations. There are around 342 locals working at<br />
24 resorts, with an average <strong>of</strong> around 14 per resort<br />
(Table 39). Using certain assumptions on salaries paid<br />
by position, total employment was valued at PhP33.15<br />
million annually, or an average <strong>of</strong> PhP1.381 million<br />
per resort. Employment thus represents approximately<br />
38% <strong>of</strong> total annual revenues, or 36% <strong>of</strong> average<br />
annual revenues per resort. O<strong>the</strong>r employment<br />
opportunities related to tourism are not yet reflected<br />
here. Employment in downstream industries may even<br />
be higher, such as provision <strong>of</strong> food on-site, land and<br />
water transportation to, from and within Mabini, souvenir<br />
making and selling and manufacture, trade and rental <strong>of</strong><br />
equipment used in water-based recreational activities.<br />
Table 39. Employment status in Mabini resorts, June 2009.<br />
Resort employment by type<br />
Administrative<br />
Housekeeping<br />
Kitchen<br />
Landscaping<br />
Garbage disposal<br />
Divers/dive masters<br />
O<strong>the</strong>rs<br />
Total employment, 24 resorts<br />
Average employment per resort<br />
Total value <strong>of</strong> employment, 24 resorts, in PhP<br />
Average value <strong>of</strong> employment per resort, in PhP<br />
Source: Field interviews, June 2009.<br />
Number/amount<br />
113<br />
55<br />
80<br />
28<br />
23<br />
40<br />
3<br />
342<br />
14<br />
33,150,000<br />
1,381,250<br />
Data on taxes paid by resorts to <strong>the</strong> local government<br />
<strong>of</strong>fice <strong>of</strong> Mabini were not available for this report.<br />
However, revenues collected from diving entrance<br />
fees have shown a significant increase since <strong>the</strong><br />
time <strong>the</strong>y was implemented in 2003 (Table 8). The<br />
entrance fee system was introduced in 2002 to provide<br />
funds for coastal resources management activities <strong>of</strong><br />
<strong>the</strong> LGU. Divers are mandated to pay PhP100 for a<br />
weekend dive in Mabini and Tingloy coral reefs. The<br />
amount was based on a 2001 study that estimated <strong>the</strong><br />
recreational value <strong>of</strong> scuba diving in <strong>the</strong> area. There<br />
was a revenue shortfall in 2006, but this was due to<br />
problems in collecting fees from divers, ra<strong>the</strong>r than a<br />
steep drop in <strong>the</strong> number <strong>of</strong> divers visiting Mabini. The<br />
Municipal Environmental and Natural Resources Office<br />
(MENRO) has since instituted changes intended to<br />
make collection methods more efficient. Using a fiveyear<br />
average between 2004 to 2008, close to 13,000<br />
divers visited Mabini and Tingloy coral reefs annually,<br />
generating an estimated PhP1.3 million in annual CRM<br />
revenues.<br />
Tourism is a sector with steadily increasing importance<br />
as a revenue source and employment opportunity in<br />
<strong>the</strong> <strong>Verde</strong> <strong>Island</strong> <strong>Passage</strong>. However, <strong>the</strong> regular repeat<br />
divers and marine recreationists who generate incomes<br />
will tend to sustain tourism costs only while <strong>the</strong><br />
marine resources are in good condition, which makes<br />
assessments <strong>of</strong> vulnerability to climate change both<br />
urgent and important.<br />
Foreshore development<br />
As with tourism, pr<strong>of</strong>iling foreshore development in<br />
<strong>the</strong> <strong>Verde</strong> <strong>Island</strong> <strong>Passage</strong> was needed to carry out<br />
<strong>the</strong> vulnerability assessment as <strong>the</strong>re was no available<br />
data base. Hence, <strong>the</strong> framework for assessing <strong>the</strong><br />
vulnerability <strong>of</strong> foreshore areas was applied by some<br />
<strong>of</strong> <strong>the</strong> participants coming from municipalities with<br />
significant infrastructure development in <strong>the</strong>ir respective<br />
foreshore areas, i.e., Balayan-Batangas, Calatagan-<br />
Batangas, Bauan-Batangas, Nasugbu-Batangas,<br />
Puerto Galera-Mindoro Oriental, and Naujan-Mindoro<br />
Oriental.<br />
To start from a pr<strong>of</strong>ile <strong>of</strong> foreshore areas in <strong>the</strong> <strong>Verde</strong><br />
<strong>Island</strong> <strong>Passage</strong>, participating municipalities in <strong>the</strong><br />
workshop group indicated <strong>the</strong> length <strong>of</strong> <strong>the</strong>ir coastlines<br />
(presented in Table 40). Nasugbu and Calatagan have<br />
relatively long coastlines (60 and 48 km respectively),<br />
thus have larger areas for potential foreshore<br />
development than most <strong>of</strong> <strong>the</strong> o<strong>the</strong>r municipalities.<br />
Table 40. Length <strong>of</strong> coastline, <strong>Verde</strong><br />
<strong>Island</strong> <strong>Passage</strong> municipalities,<br />
2009.<br />
Location<br />
Calatagan<br />
Puerto Galera<br />
Bauan<br />
Naujan<br />
Nasugbu<br />
Balayan<br />
Source: Field interviews, June 2009.<br />
Length<br />
48 km<br />
10 km<br />
4 to 5 km<br />
25 km<br />
60 km<br />
11 km<br />
Infrastructure<br />
development in<br />
foreshore areas<br />
has gone unabated<br />
throughout <strong>the</strong> years.<br />
The majority <strong>of</strong> coastal<br />
municipalities have<br />
roads that extend all <strong>the</strong><br />
way to <strong>the</strong>ir foreshore<br />
areas, many <strong>of</strong> which<br />
are concrete (Table<br />
41). Table 42 contains <strong>the</strong> number <strong>of</strong> municipalities<br />
that have allowed bridges to be constructed, mostly in<br />
municipalities with relatively little coastline.<br />
62
chapter 2 • human well-being and climate change: results and discussion<br />
Table 41. Roads in foreshore areas.<br />
Type/construction<br />
Location materials used Length<br />
Calatagan<br />
Puerto Galera<br />
Bauan<br />
Naujan<br />
Nasugbu<br />
Balayan<br />
Calatagan<br />
Puerto Galera<br />
Bauan<br />
Naujan<br />
Nasugbu<br />
Balayan<br />
3 rough, 4 concrete<br />
10 rough to concrete<br />
4 concrete<br />
rough<br />
concrete<br />
Table 42. Bridges in foreshore areas.<br />
10 km<br />
3 km<br />
1 km<br />
500 km<br />
Type/construction<br />
Location materials used Number<br />
0<br />
3 concrete, 1 wooden<br />
concrete<br />
concrete, foot bridge<br />
0<br />
0<br />
Settlements and o<strong>the</strong>r buildings abound in all coastal<br />
areas in <strong>Verde</strong> <strong>Island</strong> <strong>Passage</strong> (as shown in Tables<br />
43, 44, and 45). Meanwhile, some portions have been<br />
used as public ports and docking areas for fishing<br />
boats (Tables 46 and 47). Only Calatagan has allotted<br />
a portion for <strong>the</strong> establishment <strong>of</strong> fishponds (Table<br />
48). Accurate figures for most <strong>of</strong> <strong>the</strong>se indicators<br />
could not be determined at <strong>the</strong> workshop, but <strong>the</strong>re<br />
was a consensus that <strong>the</strong>re were too many manmade<br />
establishments located in foreshore areas. The<br />
participants agreed that <strong>the</strong> very presence <strong>of</strong> all <strong>the</strong>se<br />
settlements and buildings were exacerbating coastal<br />
erosion and pollution <strong>of</strong> <strong>the</strong>ir waters, thus already<br />
threatening resources even without <strong>the</strong> onset <strong>of</strong> climate<br />
change.<br />
Table 43. Houses in foreshore areas.<br />
3<br />
3<br />
2<br />
Table 45. O<strong>the</strong>r buildings in foreshore areas.<br />
Type/construction<br />
Area<br />
Location materials used Number occupied<br />
Calatagan<br />
Puerto Galera<br />
Bauan<br />
Naujan<br />
Nasugbu<br />
Balayan<br />
seawall<br />
lighthouse<br />
windbreaker<br />
reclaimed area<br />
Table 46. Ports in foreshore areas.<br />
lighthouse<br />
post light<br />
reclaimed area<br />
seawall<br />
chapel<br />
barangay hall<br />
day care center<br />
basketball court<br />
baywalk<br />
multipurpose hall<br />
seawall<br />
stage<br />
chapel<br />
school<br />
basketball court<br />
shorelights<br />
barangay hall<br />
barangay hall<br />
chapel<br />
multipurpose hall<br />
seawall<br />
multipurpose hall<br />
barangay hall<br />
PCG detachment<br />
baywalk<br />
seawall<br />
800 meters<br />
100 m<br />
50 m<br />
2-3 ha<br />
2 km<br />
Type/construction<br />
Location materials used Number<br />
Calatagan<br />
Puerto Galera<br />
Bauan<br />
Naujan<br />
Nasugbu<br />
Balayan<br />
PPA<br />
public<br />
private, 1 public<br />
public<br />
7<br />
1<br />
1<br />
2<br />
2<br />
1<br />
2<br />
1<br />
1<br />
2<br />
6<br />
2<br />
1<br />
1<br />
1<br />
3<br />
8<br />
2<br />
Type/construction<br />
Location materials used Number<br />
Calatagan<br />
Puerto Galera<br />
Bauan<br />
Naujan<br />
Nasugbu<br />
Balayan<br />
concrete and light materials<br />
concrete and light materials<br />
concrete<br />
semi-concrete<br />
concrete to light<br />
concrete to light<br />
Table 44. Tourism establishments in foreshore areas.<br />
11 barangays<br />
500<br />
12 barangays<br />
200<br />
50<br />
2500<br />
Type/construction<br />
Location materials used Number<br />
Table 47. Docking facilities in foreshore areas.<br />
Number <strong>of</strong><br />
Area<br />
Location boats docked occupied<br />
Calatagan<br />
Puerto Galera<br />
Bauan<br />
Naujan<br />
Nasugbu<br />
Balayan<br />
fishing boats, speedboats (10)<br />
repair, dry docking; fishing, passenger<br />
and tourist boats<br />
fishing and passenger boats<br />
fishing, passenger<br />
fishing<br />
fishing<br />
19 barangays<br />
12 barangays<br />
10 barangays<br />
7 barangays<br />
11 barangays<br />
Calatagan<br />
Puerto Galera<br />
Bauan<br />
Naujan<br />
Nasugbu<br />
Balayan<br />
concrete<br />
concrete, nipa<br />
concrete 10, 5 small scale<br />
nipa 3, concrete 2<br />
concrete 10, 5 small scale<br />
concrete 5, 25 small scale<br />
12<br />
600<br />
15<br />
5<br />
15<br />
30<br />
Table 48. Fish ponds in foreshore areas.<br />
Number <strong>of</strong><br />
Area<br />
Location fish ponds occupied<br />
Calatagan<br />
Puerto Galera<br />
Bauan<br />
Naujan<br />
Nasugbu<br />
Balayan<br />
18<br />
2 abandoned<br />
250 ha<br />
2 ha<br />
63
climate change vulnerability assessment <strong>of</strong> <strong>the</strong> verde island passage, philippines<br />
Table 49. Natural resources in<br />
foreshore areas.<br />
Location<br />
Calatagan<br />
Puerto Galera<br />
Bauan<br />
Naujan<br />
Nasugbu<br />
Balayan<br />
Resources available<br />
mangroves<br />
beach<br />
mangroves<br />
white sandy beaches<br />
beautiful bay<br />
beaches<br />
mangroves<br />
sandy beach<br />
delta<br />
hot springs<br />
coves<br />
mangroves<br />
beaches<br />
mangroves<br />
beaches<br />
delta<br />
Meanwhile, natural<br />
resources could still be<br />
found in <strong>the</strong>se foreshore<br />
areas. Most <strong>of</strong> <strong>the</strong><br />
participants proudly<br />
claimed <strong>the</strong> existence<br />
<strong>of</strong> mangrove forests<br />
and sandy beaches,<br />
<strong>the</strong> latter being used<br />
<strong>of</strong>ten for local tourism<br />
and recreation. Table<br />
49 contains a summary<br />
<strong>of</strong> natural resources<br />
found in <strong>the</strong>se coastal<br />
municipalities, although<br />
details on area covered<br />
and species present could not be provided at <strong>the</strong><br />
workshop proper.<br />
The tables that detail <strong>the</strong> data to pr<strong>of</strong>ile foreshore<br />
structures and facilities is very preliminary but has<br />
been included in <strong>the</strong> exercise (through inter-agency<br />
workshops) to show that <strong>the</strong> kinds <strong>of</strong> data suggested<br />
are nei<strong>the</strong>r well reported nor monitored, and will<br />
<strong>the</strong>refore require creative ways to generate this<br />
information. Lack <strong>of</strong> management mechanisms limits<br />
<strong>the</strong> ability to assess vulnerability. However, local<br />
government units can be encouraged to carry out interagency<br />
coordination in baselines and monitoring, which<br />
would allow a full vulnerability assessment in <strong>the</strong> future.<br />
Vulnerability assessment <strong>of</strong> human<br />
well-being<br />
Climate change impacts on <strong>the</strong> fisheries<br />
sector in <strong>the</strong> <strong>Verde</strong> <strong>Island</strong> <strong>Passage</strong> and <strong>the</strong><br />
sector’s responses<br />
Climate change disrupts fisherfolk’s livelihood when fish<br />
breeding and spawning seasons and habitats, fish runs<br />
and migration paths are altered. Starting with a pr<strong>of</strong>ile<br />
<strong>of</strong> <strong>the</strong> fisheries sector, a two-step process was used to<br />
estimate <strong>the</strong> vulnerability <strong>of</strong> fishing activities to climate<br />
change.<br />
The first step was to derive a Socio-Economic<br />
Vulnerability Index (SEVI) given a listing <strong>of</strong> parameters:<br />
i) incomes levels; ii) sectoral importance; iii) sociocultural<br />
attachment to activity; iv) diversity <strong>of</strong> livelihood<br />
options; and, v) dependency <strong>of</strong> activity on coastal<br />
habitat.<br />
• Income levels: Incomes are negatively affected<br />
by declining production levels, declining prices,<br />
and increased operational costs. Poverty threshold<br />
levels were used as benchmarks and income<br />
vulnerability was a measure <strong>of</strong> <strong>the</strong> possible<br />
divergence <strong>of</strong> income levels from this threshold.<br />
Annual per capita poverty thresholds estimated<br />
by <strong>the</strong> National Statistical Coordination Board<br />
(NSCB) for Batangas, Occidental Mindoro, and<br />
Oriental Mindoro were P16,615, P12,564, and<br />
P14,330, respectively, with income estimates for<br />
<strong>the</strong> municipal and commercial sectors summarized<br />
in Table 50.<br />
Table 50. Average per capita incomes <strong>of</strong> commercial and municipal<br />
fishers, by province, based on fisheries production value, 2005-2007.<br />
Average income <strong>of</strong> Average income <strong>of</strong><br />
commercial fishers municipal fishers<br />
Province (in thousand PhP) (in thousand PhP)<br />
Batangas<br />
Occidental Mindoro<br />
Oriental Mindoro<br />
43.975<br />
21.651<br />
26.164<br />
12.264<br />
5.683<br />
6.613<br />
• Sectoral importance: relative to <strong>the</strong> contribution<br />
to production, food security, and employment<br />
generation, <strong>the</strong> sector is highly vulnerable when<br />
contribution to ei<strong>the</strong>r <strong>of</strong> <strong>the</strong>se parameters is high.<br />
• Socio-cultural attachment to activity: when<br />
activity is not only economic but social as well;<br />
difficulty in shifting to an alternative is greater.<br />
• Diversity <strong>of</strong> livelihood option: based on<br />
information culled from reports, this measured<br />
<strong>the</strong> extent to which <strong>the</strong> individual (and his/<br />
her household) relied solely on fishing activity.<br />
If alternative livelihood options are meager,<br />
vulnerability is higher.<br />
• Dependency levels on coastal habitats: not<br />
quantitatively measured in this study, but an<br />
opportunity to employ an in-depth analysis exists<br />
given data on species caught; where fishing activity<br />
occurs (in or near coastal habitats); and type <strong>of</strong><br />
gear used.<br />
Each parameter was given a rating <strong>of</strong> Low, Medium,<br />
or High based on <strong>the</strong> best available information, and<br />
converted numerically <strong>the</strong>reafter (1=low; 2=medium,<br />
and 3=high). For example, in <strong>the</strong> case <strong>of</strong> income<br />
vulnerability, <strong>the</strong> rating was HIGH if <strong>the</strong> estimated or<br />
perceived income was lower than <strong>the</strong> poverty threshold.<br />
Any intermediate scores such as Low to Medium or<br />
Medium to High were scored as a half point score,<br />
such that Low to Medium was given a score <strong>of</strong> 1.5, for<br />
example.<br />
A simple average was <strong>the</strong>n computed to derive a<br />
Socio-Economic Vulnerability Index (SEVI). The<br />
summary indices provide a general indication <strong>of</strong><br />
vulnerabilities for <strong>the</strong> entire <strong>Verde</strong> <strong>Island</strong> <strong>Passage</strong> based<br />
on <strong>the</strong> parameters selected (Table 51).<br />
64
chapter 2 • human well-being and climate change: results and discussion<br />
Table 51. Summary socio-economic vulnerability index (SEVI) matrix for fisheries in <strong>the</strong> <strong>Verde</strong> <strong>Island</strong> <strong>Passage</strong>.<br />
Social/cultural Diversity <strong>of</strong> Dependency<br />
Income Sectoral attachment livelihood levels on coastal<br />
Type <strong>of</strong> fishing levels importance to activity option habitats SEVI<br />
Aquarium fishers<br />
Municipal fishing: demersals, coral reef fish<br />
Commercial fishing: demersals, coral reef fish<br />
Coastal aquaculture (seaweeds)<br />
Coastal aquaculture (ponds)<br />
Small pelagics fishing, municipal<br />
Small pelagics fishing, commercial<br />
Tuna fisheries (municipal)<br />
Tuna fisheries (commercial)<br />
medium (2)<br />
high (3)<br />
low to medium (1.5)<br />
low to medium (1.5)<br />
low (1)<br />
high (3)<br />
low (1)<br />
high (3)<br />
low (1)<br />
low (1)<br />
high (3)<br />
high (3)<br />
high (3)<br />
medium to high (2.5)<br />
high (3)<br />
high (3)<br />
high (3)<br />
high (3)<br />
high (3)<br />
low to medium (1.5)<br />
low to medium (1.5)<br />
medium to high (2.5)<br />
low (1)<br />
low (1)<br />
low (1)<br />
low (1)<br />
low (1)<br />
high (3)<br />
low to medium (1.5)<br />
low to medium (1.5)<br />
medium to high (2.5)<br />
low (1)<br />
low (1)<br />
low (1)<br />
low (1)<br />
low (1)<br />
high (3)<br />
high (3)<br />
high (3)<br />
medium to high (2.5)<br />
high (3)<br />
medium to high<br />
medium to high<br />
medium to high<br />
medium to high<br />
medium to high (2.4)<br />
medium to high (2.4)<br />
medium to high (2.1)<br />
medium to high (2.4)<br />
low (1.7)<br />
medium (2.1)<br />
low (1.7)<br />
medium (2.1)<br />
low (1.7)<br />
From a purely socio-economic perspective, <strong>the</strong>refore,<br />
<strong>the</strong> most vulnerable fishing activities are aquarium<br />
fishing, municipal fishing for demersals and coral reef<br />
fish, and coastal aquaculture. Aquarium fishing is<br />
highly dependent on coastal habitats (coral reefs), is<br />
a community activity, and is practiced in communities<br />
with few livelihood options. These factors influenced <strong>the</strong><br />
vulnerability ratings, despite <strong>the</strong> relatively high incomes<br />
(low income vulnerability) and minimal contribution to<br />
<strong>the</strong> economy. Municipal fishing for demersals and coral<br />
reef fish also rated high due to <strong>the</strong> low incomes <strong>of</strong><br />
fishers (<strong>the</strong>refore, High vulnerability), high importance<br />
in terms <strong>of</strong> employment and food security, and high<br />
dependency on resource.<br />
The second step was to arrive at <strong>the</strong> assessed impact<br />
<strong>of</strong> climate change on coastal habitats associated<br />
with particular kinds <strong>of</strong> fishing activities, to be used<br />
as a biophysical overlay. This was achieved through<br />
an assessment by experts on <strong>the</strong> status <strong>of</strong> fisheries<br />
based on accessed data, consultations and workshops.<br />
Scoring for <strong>the</strong> biophysical overlay followed <strong>the</strong><br />
procedure to get <strong>the</strong> SEVI. The result was <strong>the</strong>n<br />
averaged out with <strong>the</strong> SEVI to arrive at a Climate<br />
Change Vulnerability Index (CCVI) as in Table 52.<br />
Table 52. Summary climate change vulnerability index (CCVI) matrix for<br />
fisheries in <strong>the</strong> <strong>Verde</strong> <strong>Island</strong> <strong>Passage</strong>.<br />
Climate change<br />
impact to associated<br />
Type <strong>of</strong> fishing coastal habitat SEVI CCVI<br />
Aquarium fishers<br />
Municipal fishing: demersals, coral reef fish<br />
Commercial fishing: demersals, coral reef fish<br />
Coastal aquaculture (seaweeds)<br />
Coastal aquaculture (ponds)<br />
Small pelagics fishing, municipal<br />
Small pelagics fishing, commercial<br />
Tuna fisheries (municipal)<br />
Tuna fisheries (commercial)<br />
3.0<br />
3.0<br />
3.0<br />
3.0<br />
2.5<br />
2.5<br />
2.5<br />
2.5<br />
2.5<br />
2.4<br />
2.4<br />
2.1<br />
2.4<br />
1.7<br />
2.1<br />
1.7<br />
2.1<br />
1.7<br />
2.7<br />
2.7<br />
2.6<br />
2.7<br />
2.1<br />
2.3<br />
2.1<br />
2.3<br />
2.1<br />
Overall vulnerability assessment<br />
Following <strong>the</strong> suggested methodology, <strong>the</strong> vulnerability<br />
<strong>of</strong> <strong>the</strong> fisheries sector was <strong>the</strong>n assessed.<br />
i. Aquarium fishing: HIGHLY VULNERABLE<br />
Aquarium fishing was found to be HIGHLY<br />
VULNERABLE to climate change because income<br />
vulnerability ranged from Medium to High, <strong>the</strong>re<br />
was high dependence <strong>of</strong> coral reef conditions and<br />
biodiversity <strong>of</strong> fish, which was in turn related to<br />
biophysical processes likely affected by increasing sea<br />
surface temperature. Income levels were also expected<br />
to be negatively impacted by increasing operational<br />
costs (e.g., travel to far<strong>the</strong>r distances and inability to<br />
stay in <strong>the</strong> water for long hours especially during bad<br />
wea<strong>the</strong>r). Social attachment to activity was HIGH<br />
especially in <strong>the</strong> case <strong>of</strong> Barangay San Andres. It was<br />
also observed that in Barangays in Looc and Lubang<br />
where this is practiced, <strong>the</strong> communities are highly<br />
integrated. With respect to its sectoral importance,<br />
aquarium fishing has low vulnerability due to <strong>the</strong> small<br />
number <strong>of</strong> fishers involved and minimal impact on food<br />
security.<br />
Assuming <strong>the</strong> most conservative income for <strong>the</strong> “mano<br />
mano” fisher, i.e., P4,600 per month, and fur<strong>the</strong>r<br />
assuming that a household consists <strong>of</strong> five individuals<br />
including <strong>the</strong> fisher himself, <strong>the</strong> annual per capita<br />
income was estimated at P11,040, lower than <strong>the</strong><br />
poverty threshold for all three provinces. If <strong>the</strong> incomes<br />
used were on <strong>the</strong> higher side, i.e., P12,000, <strong>the</strong> poverty<br />
threshold levels are attained for all provinces. For this<br />
paper, we assumed <strong>the</strong> more optimistic approach<br />
where, <strong>the</strong> vulnerability with respect to income was<br />
scored as MEDIUM, i.e., an average <strong>of</strong> <strong>the</strong> conservative<br />
estimate and <strong>the</strong> high-end estimate.<br />
There was also HIGH vulnerability with respect to<br />
diversity <strong>of</strong> livelihood options due mainly to <strong>the</strong> relative<br />
isolation <strong>of</strong> <strong>the</strong> fishing communities (especially during<br />
typhoon months), and lack <strong>of</strong> opportunities in <strong>the</strong><br />
trade and service sectors. This was more pronounced<br />
in <strong>the</strong> case <strong>of</strong> <strong>Verde</strong> <strong>Island</strong> and Looc, where farming<br />
opportunities are not as numerous as in Lubang.<br />
65
climate change vulnerability assessment <strong>of</strong> <strong>the</strong> verde island passage, philippines<br />
ii. Tuna fisheries: VULNERABLE<br />
At least 15% <strong>of</strong> fisheries production in all three<br />
provinces consisted <strong>of</strong> tuna (skipjack, yellowfin, and big<br />
eye). For <strong>the</strong> last three years from 2005 to 2007, <strong>the</strong><br />
three provinces collectively caught, on average, 6,000<br />
MT a year valued at P400 million pesos,. Data from<br />
BAS indicated that Batangas province earns about<br />
P180 million per year, consistent with <strong>the</strong> findings <strong>of</strong><br />
Soliman (unpublished manuscript) that toge<strong>the</strong>r, Mabini<br />
and Tingloy fisheries have a value <strong>of</strong> P172 million<br />
(including demersals).<br />
Since both municipal and commercial sectors exploit<br />
<strong>the</strong> tuna fisheries, <strong>the</strong> disaggregation <strong>of</strong> volume<br />
and value was done by determining <strong>the</strong> percentage<br />
contribution <strong>of</strong> <strong>the</strong> two sectors to total production. In<br />
<strong>Verde</strong> <strong>Island</strong> <strong>Passage</strong>, <strong>the</strong> ratio <strong>of</strong> tuna catch is 1:4 with<br />
<strong>the</strong> municipal sector contributing 25% <strong>of</strong> production.<br />
In terms <strong>of</strong> value, <strong>the</strong> municipal sector earns about P32<br />
million compared to P95 million for <strong>the</strong> commercial<br />
sector.<br />
Municipal tuna fisheries were found to be more<br />
vulnerable to climate change than commercial fisheries<br />
(Table 6). Income from municipal fishers contributed<br />
to less than half <strong>of</strong> <strong>the</strong> poverty threshold especially<br />
in Mindoro—even assuming that municipal fishing<br />
exploited tuna, small pelagics and demersal fisheries.<br />
Shifting <strong>of</strong> tuna aggregations to deeper waters will<br />
not bode well for <strong>the</strong> municipal sector and incomes<br />
are bound to decline even fur<strong>the</strong>r as operational costs<br />
increase. The commercial sector will be better able to<br />
accommodate <strong>the</strong>se changes in tuna behavior. Being a<br />
migratory species, tuna may not be directly influenced<br />
by habitat conditions; however, impacts on <strong>the</strong> food<br />
chain due to changing biophysical conditions, and<br />
generally, on food availability for tuna poses a larger<br />
potential issue.<br />
Tuna is an important food fish and substantial numbers<br />
<strong>of</strong> people depend on tuna for livelihood; thus, it was<br />
found to be highly vulnerable in terms <strong>of</strong> its contribution<br />
to <strong>the</strong> economic sector. There was a lack <strong>of</strong> data to<br />
suggest that tuna fishing approximates a social activity<br />
or that tuna fishers are not engaged in o<strong>the</strong>r forms <strong>of</strong><br />
livelihood but we assumed that vulnerability was low<br />
due to general engagement <strong>of</strong> fishers in o<strong>the</strong>r economic<br />
activities such as trade, services, and o<strong>the</strong>r seasonal<br />
employment (especially in Batangas province).<br />
The SEVI for tuna was on <strong>the</strong> low side; however, when<br />
<strong>the</strong> climate change impacts were considered, <strong>the</strong> CCVI<br />
showed that tuna are mildly vulnerable due to potential<br />
changes in tuna behavior.<br />
iii. Small pelagics: VULNERABLE<br />
Due to its contribution to fisheries production in <strong>the</strong><br />
<strong>Verde</strong> <strong>Island</strong> <strong>Passage</strong> and food security, <strong>the</strong> small<br />
pelagics fishery is highly vulnerable to climate change<br />
impacts. Incomes <strong>of</strong> municipal fishers may be taken as<br />
similar to that <strong>of</strong> tuna fisheries; thus, municipal fishers<br />
are vulnerable due to lower incomes.<br />
Small pelagic fish are known to react to changes in<br />
temperature and this may well be happening in <strong>Verde</strong><br />
<strong>Island</strong> <strong>Passage</strong> where temperatures have increased,<br />
on average, by about 4ºC. As in tuna fisheries, we<br />
assume that this fishery does not constitute a social<br />
activity and that o<strong>the</strong>r forms <strong>of</strong> livelihood are gaining<br />
importance in <strong>the</strong> aggregation <strong>of</strong> household income. In<br />
Bauan, Batangas, for example, focus group discussion<br />
participants reported that currently only 50% <strong>of</strong> <strong>the</strong><br />
community are fishers as opposed to 80-90% fifty<br />
years ago. This indicates <strong>the</strong> broadening <strong>of</strong> income<br />
sources in <strong>the</strong> province, which may not yet be true for<br />
<strong>the</strong> Mindoro provinces. As with tuna, <strong>the</strong> SEVI <strong>of</strong> small<br />
pelagics indicates a low socio-economic vulnerability;<br />
however, when coupled with climate change impacts,<br />
<strong>the</strong> CCVI shows a higher index.<br />
iv. Demersals: VULNERABLE<br />
Production trends in <strong>the</strong> demersal fishery mirror <strong>the</strong><br />
pattern <strong>of</strong> exploitation. Demersal fisheries tend to be<br />
overexploited first and this is <strong>the</strong> case for <strong>the</strong> <strong>Verde</strong><br />
<strong>Island</strong> <strong>Passage</strong> fisheries. Production levels are below<br />
10,000 MT per year and <strong>the</strong> threat posed by climate<br />
change is high because <strong>of</strong> <strong>the</strong> high dependence<br />
<strong>of</strong> demersal species on coral reef and s<strong>of</strong>t bottom<br />
communities.<br />
As in <strong>the</strong> case <strong>of</strong> small pelagics, municipal fishers are<br />
more vulnerable than commercial fishers due to already<br />
low incomes but also due to <strong>the</strong>ir inability to adapt by<br />
changing gear or by mechanization. The assumptions<br />
pertaining to social activity and diversity <strong>of</strong> options are<br />
<strong>the</strong> same as for small pelagics and tuna.<br />
v. Seaweeds: VULNERABLE<br />
Seaweeds resulted in a Medium to HIGH SEVI due<br />
to its economic importance, its role as an alternative<br />
livelihood provider for women, and its dependence<br />
on water quality conditions. When climate change<br />
impacts are overlain on <strong>the</strong> socio economic vulnerability<br />
for seaweeds, <strong>the</strong> CCVI shows an increase due to<br />
<strong>the</strong> dependency <strong>of</strong> seaweed culture on water quality<br />
conditions and observations that an increase in sea<br />
surface temperature may have negative impacts on<br />
bottom farming <strong>of</strong> seaweeds.<br />
vi. Fishponds: LOW VULNERABILITY<br />
Fishponds are more vulnerable to coastal inundation<br />
and decrease in water especially during dry seasons;<br />
66
chapter 2 • human well-being and climate change: results and discussion<br />
thus, <strong>the</strong> CCVI was low. Its SEVI is also on <strong>the</strong> low side<br />
due to <strong>the</strong> relatively low income vulnerability associated<br />
with aquaculture and <strong>the</strong> availability <strong>of</strong> livelihood options<br />
for owners and employees <strong>of</strong> fishpond establishments.<br />
Assessment <strong>of</strong> adaptive capacity<br />
Integrated Coastal Management, or Coastal Resource<br />
Management, and conservation efforts have been<br />
started in <strong>the</strong> <strong>Verde</strong> <strong>Island</strong> <strong>Passage</strong>. An MPA Network<br />
covering nine LGUs has been formed in partnership<br />
with LGU, PGENRO, WWF and o<strong>the</strong>r sectors/groups.<br />
CI, WWF-<strong>Philippines</strong>, and <strong>the</strong> provincial government<br />
<strong>of</strong> Batangas signed a tri-partite memorandum<br />
<strong>of</strong> agreement that formalized <strong>the</strong> mechanics <strong>of</strong><br />
cooperation among <strong>the</strong> organizations.<br />
Collaborative efforts among <strong>the</strong> three signatories<br />
were enhanced through existing mechanisms (e.g.,<br />
Strategic Environmental Management Plan and<br />
Batangas Integrated Environmental Council). <strong>Verde</strong><br />
<strong>Island</strong> <strong>Passage</strong> marine conservation program is<br />
integrated in <strong>the</strong> SEMP. The eight municipalities and<br />
one city included in <strong>the</strong> MPA network are Bauan, Lobo,<br />
Calatagan, Balayan, Tingloy, Nasugbu, San Juan,<br />
Mabini and Batangas City. However, <strong>the</strong> stakeholders<br />
in Calatagan do not have an integrated coastal<br />
management policy for <strong>the</strong>ir municipality.<br />
The MPA Network formation in <strong>the</strong> <strong>Verde</strong> <strong>Island</strong><br />
<strong>Passage</strong> has exerted peer pressure on o<strong>the</strong>r<br />
municipalities to conserve <strong>the</strong>ir marine resources. An<br />
enforcement strategy has been institutionalized at <strong>the</strong><br />
provincial and nine coastal areas in <strong>the</strong> formation <strong>of</strong><br />
<strong>the</strong> Bantay Dagat Baywatch Network. This network<br />
is composed <strong>of</strong> eight municipalities and one city.<br />
There are 280 members and about 75% are active.<br />
Bantay Dagat network meets on a monthly basis.<br />
Encroachment <strong>of</strong> commercial fishers in municipal<br />
waters reduced since <strong>the</strong> MPA and Bantay Dagat<br />
network was formed. In 2008, 11 cases filed in court<br />
that reached a resolution.<br />
All 25 MFARMCs are organized and <strong>the</strong>re are 4<br />
IFARMCs located in Balayan Bay, Batangas Bay, Taal<br />
Lake, and Tayabas Bay.<br />
Climate change impacts on <strong>the</strong> tourism<br />
sector in <strong>the</strong> <strong>Verde</strong> <strong>Island</strong> <strong>Passage</strong> and <strong>the</strong><br />
sector's responses<br />
Natural coastal and marine resources for tourism<br />
activities that could potentially be effected include<br />
foreshore areas dedicated to tourism, coral reefs used<br />
for scuba diving and snorkeling, as well as hotels and<br />
lodging facilities. The framework for <strong>the</strong> vulnerability<br />
assessment is summarized in Figure 45, showing how<br />
biophysical impacts are related to socio-economic<br />
impacts in <strong>the</strong> tourism sector. As measures <strong>of</strong> exposure,<br />
hazards that pertain to <strong>the</strong> biophysical climate change<br />
indicators are storm frequency and/or intensity, increase<br />
in sea surface temperature causing coral bleaching,<br />
or accelerated sea level rise. Measures <strong>of</strong> sensitivity,<br />
meanwhile, are related to <strong>the</strong> type and status <strong>of</strong> reefs<br />
and numbers <strong>of</strong> tourists as reef-dependent activities<br />
attract <strong>the</strong> most tourists.<br />
SEA LEVEL<br />
RISE<br />
INCREASE IN<br />
SEA<br />
TEMPERATURE<br />
INTENSITY<br />
FREQUENCY<br />
OCEAN<br />
CONDITIONS<br />
STORMS<br />
EDUCATION<br />
LOCATION<br />
REEF<br />
MANAGERIAL<br />
measure <strong>of</strong> components<br />
components <strong>of</strong> dimensions<br />
dimensions <strong>of</strong> vulnerabiity<br />
EXPOSURE<br />
DIVERSIFICATION<br />
OF ACTIVITIES<br />
MANAGEMENT<br />
VISITORS NUMBERS<br />
(CARRYING<br />
CAPACITY)<br />
ADAPTIVE<br />
CAPACITY<br />
SENSITIVITY<br />
VULNERABILITY<br />
TECHNOLOGICAL<br />
ARTIFICIAL<br />
REEF<br />
DEGREE OF<br />
PROTECTION OF<br />
THE REEF<br />
PERCENT OF<br />
HEALTHY REEF<br />
Fig. 45. Framework that was used to guide <strong>the</strong> vulnerability<br />
assessment.<br />
For <strong>the</strong> assessment <strong>of</strong> <strong>the</strong> indicators that measure <strong>the</strong><br />
different vulnerability components, a scoring system<br />
can be developed in collaboration with stakeholders,<br />
building on existing knowledge and data<br />
With data from <strong>the</strong> created pr<strong>of</strong>ile, <strong>the</strong> vulnerability<br />
assessment with inter-agency workshop participants<br />
concluded that <strong>the</strong> tourism industry is threatened by<br />
climate change as it can potentially destroy touristattracting<br />
natural resources. Coastal municipalities<br />
<strong>of</strong> Batangas, Lubang, and Puerto Galera will lose<br />
revenues and employment opportunities in such an<br />
event. Reef-dependent scuba diving and snorkeling are<br />
<strong>the</strong> activities that will be most greatly affected by <strong>the</strong><br />
first two scenarios. In <strong>the</strong>se cases, some recreational<br />
areas <strong>of</strong> <strong>the</strong> <strong>Verde</strong> <strong>Island</strong> <strong>Passage</strong> will be more<br />
vulnerable than o<strong>the</strong>rs, i.e., scuba diving and snorkeling<br />
locations will be more negatively affected. In particular,<br />
<strong>the</strong> local economies <strong>of</strong> Mabini, Tingloy, Bauan, and<br />
Puerto Galera may suffer as climate change impacts<br />
increase.<br />
On <strong>the</strong> o<strong>the</strong>r hand, <strong>the</strong> third scenario is projected to<br />
affect all tourism activities as tourists will obviously<br />
REEF<br />
INSTITUTIONAL<br />
SUPPORT<br />
SPECIES<br />
PRESENT<br />
TOURISTS<br />
PROTECTION<br />
(MARINE RESERVE)<br />
RESEARCH &<br />
MONITORING<br />
PROJECTS<br />
DIVERSITY<br />
EXTENSION<br />
CONSERVATION<br />
PROJECTS<br />
REEF<br />
PREFERENCES<br />
TYPE OF<br />
TOURIST<br />
DENSITY OF<br />
TOURISTS<br />
67
climate change vulnerability assessment <strong>of</strong> <strong>the</strong> verde island passage, philippines<br />
adjust <strong>the</strong>ir schedules and destination choices in<br />
places that have less potential <strong>of</strong> being hit by storms<br />
and extreme wea<strong>the</strong>r events. Should <strong>the</strong> third scenario<br />
occur, local income and employment will be negatively<br />
affected in all tourism sites. Following is a summary<br />
<strong>of</strong> potential responses indicated by <strong>the</strong> workshop<br />
participants.<br />
Scenario A: increase in sea surface temperature (SST)<br />
Increase in sea surface temperature causes coral<br />
bleaching, making <strong>the</strong> activity less attractive to divers<br />
and snorkelers<br />
No effect on <strong>the</strong> o<strong>the</strong>r tourism activities<br />
Scenario B: accelerated sea level rise (ASLR)<br />
Causes poor turbidity, reduced photosyn<strong>the</strong>sis and<br />
chlorophyll production/coral drowning<br />
Less interest/appreciation for snorkelers<br />
Divers will have to go deeper underwater to see <strong>the</strong><br />
corals; will have to exert more effort and additional cost;<br />
will involve higher risk for divers<br />
Positive impact: beneficial to some corals; will be<br />
undisturbed<br />
No effect on <strong>the</strong> o<strong>the</strong>r tourism activities<br />
Scenario C: increase in frequency and intensity <strong>of</strong><br />
typhoons (STORMINESS)<br />
Tourism facilities are damaged; additional construction<br />
costs for renovation and repair<br />
Increase in unemployment and underemployment<br />
Decreased livelihood opportunities<br />
Less revenue collection<br />
Destruction <strong>of</strong> <strong>the</strong> natural and man-made resources<br />
No tourism activities in <strong>the</strong> presence <strong>of</strong> typhoons<br />
Overall vulnerability assessment<br />
Based on <strong>the</strong> above scenarios and <strong>the</strong> potential<br />
impacts on <strong>the</strong> tourism sector, <strong>the</strong> participants ranked<br />
<strong>the</strong> impacts and assigned scores to determine <strong>the</strong><br />
overall vulnerability due to climate change. For each<br />
climate projection with high likelihood <strong>of</strong> occurrence,<br />
vulnerability was assessed in terms <strong>of</strong> exposure and<br />
sensitivity (1=Low, 2=Medium, 3=High). Table 53<br />
provides a summary <strong>of</strong> <strong>the</strong> scores.<br />
Table 53. Vulnerability assessment in <strong>the</strong> tourism sector, <strong>Verde</strong> <strong>Island</strong><br />
<strong>Passage</strong>, 2009.<br />
Reef-dependent tourism activities are clearly <strong>the</strong><br />
most vulnerable, in contrast with those that are not<br />
dependent <strong>of</strong> reef condition.<br />
Assessment <strong>of</strong> adaptive capacity<br />
Methodology for <strong>the</strong> tourism sector was extended to <strong>the</strong><br />
assessment <strong>of</strong> adaptive capacity. Participants ranked<br />
<strong>the</strong> capacities <strong>of</strong> <strong>the</strong> municipal and provincial levels <strong>of</strong><br />
government, both <strong>of</strong> which have distinct mandates to<br />
manage <strong>the</strong> tourism sector <strong>of</strong> <strong>Verde</strong> <strong>Island</strong> <strong>Passage</strong>.<br />
Indicators were determined based on <strong>the</strong> participants’<br />
knowledge <strong>of</strong> management requirements to fulfill <strong>the</strong>ir<br />
mandates.<br />
The Information, Education and Communication<br />
(IEC ) indicator refers to production and distribution<br />
<strong>of</strong> information materials as well as workshops and<br />
general assemblies for information dissemination<br />
purposes. Policies refer to local ordinances, MOUs and<br />
environmental management plans formulated at <strong>the</strong><br />
local level. Management bodies indicate <strong>the</strong> number<br />
<strong>of</strong> councils and organizations formed in addressing<br />
environmental issues related to <strong>the</strong> tourism sector. LGU<br />
and NGO partnerships reflect <strong>the</strong> number <strong>of</strong> active<br />
government agencies, private foundations and NGOs<br />
in environment-related programs, while stakeholder<br />
partnerships include people’s organizations and<br />
local interest groups formed for <strong>the</strong> same purpose.<br />
Community involvement refers to environmental projects<br />
affecting tourism that involve community participation,<br />
e.g., giant clam seeding, MPA establishment, mangrove<br />
reforestation, abalone culture and coastal clean-ups.<br />
Finally <strong>the</strong> last indicator is not specifically a<br />
management indicator; however it refers to <strong>the</strong><br />
perceived resiliency and adaptive capacity <strong>of</strong> natural<br />
resources and ecosystems to climate change, based<br />
on <strong>the</strong>ir reported status and health. Using <strong>the</strong> rating<br />
scheme <strong>of</strong> 1=Low (High), 2=Medium, 3=High (Low)<br />
vulnerability (capacity), Table 54 contains <strong>the</strong> perceived<br />
adaptive capacity <strong>of</strong> VIP in responding to climate<br />
change impacts in <strong>the</strong> tourism sector.<br />
Table 54. Adaptive capacity assessment in <strong>the</strong> tourism sector <strong>of</strong> <strong>the</strong> <strong>Verde</strong><br />
<strong>Island</strong> <strong>Passage</strong>, 2009.<br />
Management Status Score<br />
indicator presence absence inadequate municipal provincial<br />
Activity/climate Sea surface Accelerated sea<br />
change impact temperature level rise Storminess<br />
Wind Surfing<br />
Diving<br />
Snorkeling<br />
Swimming<br />
Boat Trips<br />
Kayaking<br />
Jetski<br />
Wakeboarding<br />
Skim boarding<br />
Banana boat<br />
1<br />
3<br />
3<br />
1<br />
1<br />
1<br />
1<br />
1<br />
1<br />
1<br />
1<br />
3<br />
3<br />
2<br />
1<br />
1<br />
1<br />
1<br />
1<br />
1<br />
3<br />
3<br />
3<br />
3<br />
3<br />
3<br />
3<br />
3<br />
3<br />
3<br />
IEC<br />
Policies<br />
Management body<br />
LGU-NGO<br />
partnerships<br />
Stakeholder<br />
partnerships/POs<br />
Community<br />
involvement<br />
Natural resources<br />
x<br />
x<br />
x<br />
x<br />
x<br />
x<br />
x<br />
2<br />
2<br />
2<br />
1<br />
2<br />
3<br />
2<br />
2<br />
2<br />
2<br />
1<br />
2<br />
2<br />
2<br />
68
chapter 2 • human well-being and climate change: results and discussion<br />
Climate change impacts on <strong>the</strong> foreshore<br />
areas in <strong>Verde</strong> <strong>Island</strong> <strong>Passage</strong> and <strong>the</strong><br />
sector's responses<br />
Similar to <strong>the</strong> effects <strong>of</strong> climate change on <strong>the</strong> tourism<br />
sector, three climate change scenarios were discussed<br />
as potentially affecting foreshore areas, namely:<br />
increase in sea surface temperature, accelerated<br />
sea level rise, and increased frequency and intensity<br />
<strong>of</strong> typhoons (storminess). Participants believed that<br />
increase in sea surface temperature would not have any<br />
impact on man-made structures located in foreshore<br />
areas. Potentially heavy damages may arise when<br />
accelerated sea level rise and storminess occur. Many<br />
<strong>of</strong> <strong>the</strong>se structures, particularly settlements and tourism<br />
facilities, are made <strong>of</strong> light materials that can easily<br />
be washed out or destroyed during strong storms.<br />
Accelerated sea level rise and storminess may cause<br />
severe damage to natural resources as well, particularly<br />
sandy beaches. These climate change scenarios could<br />
intensify coastal erosion, which is already happening<br />
due to <strong>the</strong> unabated infrastructure development in<br />
foreshore areas. Some municipalities have put up<br />
sea walls to prevent fur<strong>the</strong>r damage to <strong>the</strong>ir coastline<br />
infrastructure facilities. Although <strong>the</strong>se structures may<br />
prevent damages in <strong>the</strong> short-run, participants agreed<br />
that <strong>the</strong>y could exacerbate coastal erosion, fur<strong>the</strong>r<br />
damaging foreshore areas in <strong>the</strong> long-run. Table 55<br />
summarizes <strong>the</strong> workshop discussions on potential<br />
impacts <strong>of</strong> climate change on foreshore areas <strong>of</strong> <strong>the</strong><br />
<strong>Verde</strong> <strong>Island</strong> <strong>Passage</strong>.<br />
Overall vulnerability assessment<br />
Based on <strong>the</strong> above scenarios and <strong>the</strong> potential<br />
impacts on foreshore areas, <strong>the</strong> participants ranked<br />
<strong>the</strong> impacts and assigned scores to determine <strong>the</strong><br />
overall vulnerability due to climate change. For each<br />
climate projection with high likelihood <strong>of</strong> occurrence,<br />
vulnerability was assessed in terms <strong>of</strong> exposure and<br />
sensitivity (1=Low, 2=Medium, 3=High). Table 56<br />
provides a summary <strong>of</strong> <strong>the</strong> scores.<br />
In terms <strong>of</strong> adaptive capacity, participants ranked <strong>the</strong><br />
capacities <strong>of</strong> <strong>the</strong> municipal, provincial and national<br />
levels <strong>of</strong> government in managing foreshore areas <strong>of</strong><br />
<strong>Verde</strong> <strong>Island</strong> <strong>Passage</strong> as highly vulnerable. Indicators<br />
were determined based on <strong>the</strong> participants’ knowledge<br />
<strong>of</strong> management requirements to fulfill <strong>the</strong>ir mandates.<br />
It was noted that municipal and provincial LGUs were<br />
not authorized to manage <strong>the</strong>ir foreshore areas, as this<br />
responsibility still rests with <strong>the</strong> national government.<br />
Granting <strong>of</strong> Foreshore Lease Agreements is still within<br />
<strong>the</strong> mandate <strong>of</strong> <strong>the</strong> Department <strong>of</strong> Environment and<br />
Natural Resources. Meanwhile, <strong>the</strong> Bureau <strong>of</strong> Fisheries<br />
and Aquatic Reforms, which in turn is under <strong>the</strong><br />
Department <strong>of</strong> Agriculture, is <strong>the</strong> agency authorized<br />
to approve and issue Fishpond Lease Agreements,<br />
Table 55. Climate change impacts on foreshore areas in <strong>the</strong> <strong>Verde</strong> <strong>Island</strong><br />
<strong>Passage</strong>.<br />
Climate change Impacts on Impacts on<br />
projection natural resources man-made structures<br />
Increase in<br />
sea surface<br />
temperature<br />
Accelerated sea<br />
level rise (ASLR)<br />
Increased storm<br />
frequency and<br />
intensity<br />
Sea surface temperature<br />
Accelerated sea level rise<br />
Storminess<br />
warming can cause coral<br />
bleaching and drowning<br />
coastal erosion<br />
coastal erosion<br />
• none<br />
• infrastructure damage;<br />
• infrastructure and natural<br />
resources are highly exposed;<br />
• materials and design <strong>of</strong> buildings<br />
and houses are not adapted to<br />
sea level rise;<br />
• sea walls: barriers to sea level<br />
rise;<br />
• foreshore area highly sensitive<br />
to ASLR, because <strong>of</strong> historical<br />
trends <strong>of</strong> foreshore development<br />
• infrastructure damage<br />
• infrastructure and natural<br />
resources are highly exposed<br />
• materials and design <strong>of</strong> buildings<br />
and houses are not adapted to<br />
storm surges<br />
• sea walls: exacerbate coastal<br />
erosion<br />
• foreshore area highly sensitive<br />
to storm surges, because <strong>of</strong><br />
historical trends <strong>of</strong> foreshore<br />
development<br />
• deterioration <strong>of</strong> sea walls: debris<br />
get washed out, causing pollution<br />
• transports seasonal waste from<br />
one coastal area to ano<strong>the</strong>r;<br />
causes solid waste pollution on<br />
foreshore areas<br />
Table 56. Vulnerability assessment in foreshore areas <strong>of</strong> <strong>the</strong> <strong>Verde</strong> <strong>Island</strong><br />
<strong>Passage</strong>, 2009.<br />
Climate<br />
Coastal asset<br />
change impact exposed Exposure Sensitivity<br />
none<br />
infrastructure<br />
mangroves<br />
beaches/coves<br />
delta<br />
hot springs<br />
infrastructure<br />
mangroves<br />
beaches/coves<br />
delta<br />
hot springs<br />
which may be located within foreshore areas <strong>of</strong> coastal<br />
municipalities.<br />
Clearly, <strong>the</strong>re is a lot <strong>of</strong> confusion and discord that<br />
can be created at <strong>the</strong> local level. As one participant<br />
<strong>of</strong> <strong>the</strong> workshop noted in plenary, management <strong>of</strong><br />
both municipal lands and municipal waters has been<br />
devolved to LGUs, but foreshore area management is<br />
still within <strong>the</strong> mandate <strong>of</strong> national government. In effect,<br />
municipal and provincial LGUs consider <strong>the</strong>mselves as<br />
having a very low adaptive capacity to climate change,<br />
simply because <strong>the</strong>y do not have <strong>the</strong> mandate to carry<br />
0<br />
3<br />
1<br />
3<br />
3<br />
3<br />
3<br />
2<br />
3<br />
3<br />
2<br />
0<br />
3<br />
1<br />
3<br />
3<br />
2<br />
3<br />
1<br />
3<br />
3<br />
3<br />
69
climate change vulnerability assessment <strong>of</strong> <strong>the</strong> verde island passage, philippines<br />
out adaptation and mitigation plans in foreshore areas.<br />
Using <strong>the</strong> rating scheme <strong>of</strong> 1=Low (High), 2=Medium,<br />
3=High (Low) vulnerability (capacity), Table 57 contains<br />
<strong>the</strong> perceived adaptive capacity <strong>of</strong> <strong>Verde</strong> <strong>Island</strong><br />
<strong>Passage</strong> in responding to climate change impacts in<br />
foreshore areas.<br />
Table 57. Adaptive capacity assessment in foreshore areas <strong>of</strong> <strong>the</strong> <strong>Verde</strong><br />
<strong>Island</strong> <strong>Passage</strong>, 2009.<br />
Capacity Municipal Provincial National<br />
requirements level level level<br />
IEC<br />
Policy formulation and implementation<br />
Management bodies<br />
LGU-NGO partnerships<br />
Community involvement<br />
Disaster preparedness<br />
Climate change impacts on <strong>the</strong> people’s<br />
health and safety in <strong>Verde</strong> <strong>Island</strong> <strong>Passage</strong><br />
and <strong>the</strong> sector’s responses<br />
Water- and vector-borne diseases, destruction <strong>of</strong><br />
infrastructure in human settlements, loss <strong>of</strong> incomes,<br />
and even loss <strong>of</strong> lives, because <strong>of</strong> extreme wea<strong>the</strong>r<br />
events (sea surface temperature and storminess),<br />
flooding, and accelerated sea level rise, command large<br />
scale institutional response. Vulnerability assessment to<br />
aid adaptation is indeed expedient now.<br />
3<br />
3<br />
3<br />
3<br />
3<br />
3<br />
3<br />
3<br />
3<br />
3<br />
3<br />
3<br />
3<br />
2<br />
3<br />
3<br />
3<br />
3<br />
USAID’s Guidebook is a very useful reference in<br />
setting <strong>the</strong> scope <strong>of</strong> <strong>the</strong> assessment. The matrix below<br />
provides a summary <strong>of</strong> <strong>the</strong> threats affecting mariculture<br />
and affected freshwater resources as a source <strong>of</strong><br />
income and food, human settlements, health, and<br />
conflict situations.<br />
Following <strong>the</strong> guidebook, absent or incomplete<br />
baselines for <strong>the</strong> vulnerability assessment were<br />
first addressed in <strong>the</strong> project through appropriately<br />
prioritized agency data sources such as physical<br />
framework and development plans, socio-economic<br />
pr<strong>of</strong>iles, health reports, disaster records and<br />
infrastructure plans. These were accessed but re-read<br />
with a climate-sensitive perspective. Reconstructive<br />
data, based on experiences and observations, was<br />
separately done through interviews with technical staff<br />
with coastal residents. Multi-agency workshops for<br />
systematic consolidation and validation followed (Table<br />
58).<br />
Vulnerability assessment <strong>of</strong> health and safety<br />
The climate change impacts from more frequent strong<br />
typhoons and <strong>the</strong> consequent intensified flooding, will<br />
potentially have large effects on livelihood and quality<br />
<strong>of</strong> life in settlements. (Note: vulnerability assessment <strong>of</strong><br />
effects on livelihood is covered in <strong>the</strong> earlier sections.)<br />
Sea level rise is not yet seen by many people as a result<br />
<strong>of</strong> global warming/climate change. Unfortunately, effects<br />
Table 58. Climate change threats to coastal communities.<br />
Sector Climate change impacts Climate change threats<br />
Mariculture<br />
Freshwater<br />
resources<br />
Human settlements<br />
Human health<br />
Conflict<br />
sea surface temperature increases;<br />
environmental changes e.g., salinity, precipitation levels,<br />
seasonality;<br />
changes in wea<strong>the</strong>r patterns and extreme wea<strong>the</strong>r events<br />
encroachment <strong>of</strong> saltwater into <strong>the</strong> water table, estuaries<br />
and coastal rivers;<br />
waves and storm surges reaching fur<strong>the</strong>r inland;<br />
decreased precipitation<br />
increasing coastal inundation;<br />
sea level rise raising water levels during storm surge;<br />
erosion, and extreme wea<strong>the</strong>r events<br />
changing wea<strong>the</strong>r patterns;<br />
extremely hot periods<br />
coastal land loss due to sea level rise<br />
• unpredictable changes in culture productivity;<br />
• increase stress and vulnerability to pathogens and parasites in cultured organisms;<br />
• overall decline in ocean productivity reduces supplies <strong>of</strong> wild fish used for fish meal for<br />
mariculture;<br />
• reduce productivity and disrupted operations (loss <strong>of</strong> infrastructure and stock) due to extreme<br />
wea<strong>the</strong>r events;<br />
• loss <strong>of</strong> income and investments<br />
• saltwater intrusion <strong>of</strong> freshwater sources;<br />
• increased saltwater intrusion, exacerbating water supply problems;<br />
• contamination <strong>of</strong> water supply sources during flooding and coastal inundation;<br />
• lack <strong>of</strong> potable water during extreme wea<strong>the</strong>r events<br />
• more inland relocation;<br />
• houses, buildings and infrastructure damage from increasing coastal storm intensity and flood<br />
exposure;<br />
• reduced clearance under bridges;<br />
• overtopping <strong>of</strong> coastal defense structures;<br />
• degradation <strong>of</strong> natural coastal defense structures<br />
• injuries, illness, and loss <strong>of</strong> lives due to extreme wea<strong>the</strong>r events;<br />
• malnutrition, water and food shortages during extreme events;<br />
• heat stress from extremely hot periods;<br />
• increased spread <strong>of</strong> vector-borne disease (dengue fever and malaria), waterborne diseases<br />
(diarrhea) and toxic algae (ciguatera)<br />
• coastal land and resource scarcity or loss, and human migration;<br />
• resource and water use conflicts due to scarcity;<br />
• population migration to urban areas as ocean productivity and food availability declines and<br />
fishers are displaced;<br />
• disruption <strong>of</strong> peace and order situation<br />
Source: Adapted from <strong>the</strong> USAID Guidebook for Development Planners: Adapting to Coastal Climate Change.<br />
70
chapter 2 • human well-being and climate change: results and discussion<br />
on health and food safety are <strong>the</strong> least recognized.<br />
Hence, with <strong>the</strong> focus on human health and safety<br />
in <strong>the</strong> coastal environment, vulnerability indicators<br />
recommended include <strong>the</strong> following:<br />
• flood-prone area;<br />
• climate change effects on health and diseases that<br />
are water-, vector-, rodent- and food-borne as well<br />
as extreme temperature-related; and,<br />
• climate change-ready physical infrastructure for<br />
disaster and risk management and ecosystembased<br />
water supply system (distribution), drainage<br />
and sanitation.<br />
i. Flood-prone area: VULNERABLE<br />
A Flood-prone Index with scores from 1=Low,<br />
2=Medium, 3=High vulnerability is a suggested tool.<br />
As a case study, flood prone areas in all municipalities<br />
on <strong>the</strong> Batangas side <strong>of</strong> <strong>the</strong> <strong>Verde</strong> <strong>Island</strong> <strong>Passage</strong> that<br />
host hundreds <strong>of</strong> thousands <strong>of</strong> people are categorized<br />
into <strong>the</strong> following:<br />
• Category 1: Almost flooded as a result <strong>of</strong> heavy<br />
rains aggravated by high tide or rise in water level or<br />
nearby seas, lakes, rivers, etc.<br />
• Category 2: Flooded only after several days <strong>of</strong><br />
heavy and continuous rains with subsequent rise in<br />
water level or lakes, seas, dikes, rivers and canals<br />
• Category 3: Flooded only after several days <strong>of</strong><br />
exceptionally heavy or continuous rains.<br />
• Category 4: Never experienced flood but present<br />
environmental condition in <strong>the</strong> area warrant LGU’s<br />
concern on flood, flash flood, land slides and mud<br />
slides.<br />
• Category 5: Residential areas, national and<br />
provincial road networks prone to landslide and<br />
mudslides.<br />
or town center, as basis <strong>of</strong> Flood-prone Index A with<br />
scores from 1=Low, 2=Medium, 3=High vulnerability.<br />
Flood-prone Index A was customized to rank<br />
municipalities where <strong>the</strong>y are most vulnerable to<br />
flooding under Category 1 and 2 only (rains with<br />
subsequent rise in sea water level or near seas, dikes<br />
o<strong>the</strong>r waterways in coastal areas). The following<br />
among <strong>the</strong> province-wide Batangas side <strong>of</strong> <strong>the</strong> <strong>Verde</strong><br />
<strong>Passage</strong> had <strong>the</strong> greatest number <strong>of</strong> communities and<br />
population exposed to floods aggravated by water level<br />
rise: Nasugbu (37 out <strong>of</strong> 42 barangays) and Calatagan<br />
(20 out <strong>of</strong> 25 barangays) with a vulnerability rating <strong>of</strong><br />
3 (high), followed by Lian (10 <strong>of</strong> 19), Bauan (16 out <strong>of</strong><br />
40) and Lemery (18 out <strong>of</strong> 46 barangays) with a rating<br />
<strong>of</strong> 2 (medium).<br />
Focusing on only <strong>the</strong> coastal areas in <strong>the</strong>se<br />
municipalities to emphasize marine adaptation to<br />
climate change, an adjusted Flood-prone Index B (only<br />
for <strong>the</strong> scaled down area) gives Calatagan and Tingloy<br />
(for its size) a score <strong>of</strong> 3 (Table 60). They are highly<br />
vulnerable to flooding where it is most likely to happen<br />
and where <strong>the</strong>y have <strong>the</strong> greatest number <strong>of</strong> coastal<br />
barangays, although Calatagan, Nasugbu, Lemery and<br />
San Juan have <strong>the</strong> largest exposed population.<br />
Testing <strong>the</strong> use <strong>of</strong> <strong>the</strong> Flood-prone Index in <strong>the</strong> rest <strong>of</strong><br />
<strong>Verde</strong> <strong>Island</strong> <strong>Passage</strong> provinces would be beneficial to<br />
expand <strong>the</strong> vulnerability assessment.<br />
This scale indicates vulnerability ranges from highest<br />
(Category 1) to lowest (Category 4 and 5). Table<br />
59 summarizes <strong>the</strong> vulnerable population across all<br />
barangays, whe<strong>the</strong>r located in <strong>the</strong> interior sections<br />
Table 59. Vulnerable population in selected flood-prone municipalities, Batangas-wide.<br />
Category 1 Category 2 Category 3 Category 4 Category 5 Total<br />
Municipality barangays pop. barangays pop. barangays pop. barangays pop. barangays pop. population<br />
Lemery<br />
Lian<br />
Balayan<br />
Calatagan<br />
Nasugbu<br />
Bauan<br />
Lobo<br />
Tingloy<br />
Mabini<br />
San Juan<br />
Total<br />
12<br />
5<br />
13<br />
5<br />
11<br />
3<br />
none<br />
2<br />
none<br />
none<br />
51<br />
16,559<br />
2,651<br />
18,501<br />
10,206<br />
28,876<br />
5,032<br />
none<br />
5,400<br />
none<br />
none<br />
87,225<br />
6<br />
5<br />
3<br />
15<br />
26<br />
13<br />
5<br />
2<br />
2<br />
8<br />
85<br />
7,041<br />
1,925<br />
23,032<br />
25,819<br />
53,013<br />
21,530<br />
5,351<br />
400<br />
2,608<br />
15,557<br />
156,276<br />
4<br />
1<br />
8<br />
none<br />
26<br />
none<br />
3<br />
2<br />
none<br />
8<br />
26<br />
5,134<br />
288<br />
21,463<br />
none<br />
53,013<br />
none<br />
5,284<br />
1,200<br />
none<br />
14,707<br />
48,076<br />
none<br />
1<br />
4<br />
1<br />
2<br />
1<br />
11<br />
none<br />
2<br />
18<br />
40<br />
none<br />
288<br />
6,218<br />
1,581<br />
3,168<br />
491<br />
9,279<br />
none<br />
3,374<br />
27,719<br />
52,118<br />
4<br />
1<br />
none<br />
none<br />
none<br />
none<br />
5<br />
1<br />
none<br />
none<br />
11<br />
4,202<br />
296<br />
none<br />
none<br />
none<br />
none<br />
7,332<br />
1000<br />
none<br />
none<br />
12,830<br />
32,936<br />
5,448<br />
69,214<br />
37,606<br />
85,057<br />
27,053<br />
27,246<br />
8,000<br />
5,982<br />
57,983<br />
35,525<br />
Note: number <strong>of</strong> flood-prone barangays across all categories is not cumulative.<br />
Source: Provincial Disaster Coordinating Office, Batangas, 2009.<br />
71
climate change vulnerability assessment <strong>of</strong> <strong>the</strong> verde island passage, philippines<br />
Table 60. Flood-prone index, coastal municipalities in Batangas.<br />
Total Number <strong>of</strong> Population Flood- Barangay Population Floodnumber<br />
<strong>of</strong> barangays vulnerable to prone along along prone<br />
Municipality barangays Cat. 1, 2 Percentage flooding index-A VIP Percentage VIP index-B<br />
Balayan<br />
Bauan<br />
Calatagan<br />
Lemery<br />
Lian<br />
Lobo<br />
Mabini<br />
Nasugbu<br />
San Juan<br />
Tingloy<br />
Total population<br />
along <strong>the</strong> VIP<br />
48<br />
40<br />
25<br />
46<br />
19<br />
26<br />
34<br />
42<br />
42<br />
15<br />
579<br />
16<br />
16<br />
20<br />
18<br />
10<br />
5<br />
2<br />
37<br />
8<br />
4<br />
33<br />
40<br />
80<br />
39<br />
52<br />
19<br />
6<br />
88<br />
19<br />
26<br />
41,533<br />
26,562<br />
36,025<br />
23,600<br />
4,576<br />
5,351<br />
2,608<br />
81,889<br />
15,557<br />
5,800<br />
1<br />
2<br />
3<br />
2<br />
2-3<br />
1<br />
1<br />
3<br />
1<br />
1<br />
11<br />
10<br />
16<br />
13<br />
6<br />
10<br />
13<br />
7<br />
15<br />
15<br />
152<br />
22.91<br />
25.00<br />
64.00<br />
28.26<br />
31.58<br />
38.46<br />
38.24<br />
16.67<br />
35.71<br />
100.00<br />
26.25<br />
20,873<br />
24,348<br />
34,433<br />
27,149<br />
19,114<br />
18,589<br />
20,616<br />
29,488<br />
26,537<br />
18,548<br />
358,518<br />
1<br />
1<br />
2-3<br />
1<br />
1<br />
2<br />
2<br />
1<br />
2<br />
3<br />
ii. Climate change-related diseases and effects on<br />
health: VA for integration in <strong>the</strong> institutional framework<br />
With exposure to flooding because <strong>of</strong> storminess and<br />
accelerated sea level rise or because <strong>of</strong> increased<br />
sea surface temperature, <strong>the</strong> presence or absence,<br />
magnitude and trending <strong>of</strong> <strong>the</strong> following direct effects<br />
on health are aspects that require inclusion in <strong>the</strong><br />
climate change adaptation framework, policies, and<br />
plans for <strong>the</strong> sector:<br />
• diseases that are temperature-related, water and<br />
food-borne, vector- and rodent-borne;<br />
• effects <strong>of</strong> food and water shortages;<br />
• extreme temperature-related health effects; and,<br />
• mental, nutritional, infectious health effects.<br />
Following <strong>the</strong> example <strong>of</strong> <strong>the</strong> Flood-prone Index, <strong>the</strong><br />
impacts on health and safety can also be used with<br />
scores <strong>of</strong> 1=Low, 2=Medium, 3=High vulnerability to<br />
mainstream adaptation. Below are health implications<br />
<strong>of</strong> climate change that <strong>the</strong> vulnerability assessment can<br />
cover. (Regular health services and facilities do not<br />
suffice since those are commonly confined to maternal<br />
and child health care, control <strong>of</strong> diarrheal diseases,<br />
micronutrient supplementation, family planning, TB<br />
control program and cardiovascular disease.)<br />
• Even if not yet experienced, sea level rise can lead<br />
to salt water intrusion in and pollution <strong>of</strong> <strong>the</strong> water<br />
supply. Pollution is aggravated by dumping <strong>of</strong><br />
industrial and domestic waste and oil spills.<br />
• Marine productivity decreases as sea surface<br />
temperature increases and thus results in unsafe<br />
and reduced food. Harmful algal blooms (ciguatera)<br />
occur. Algal blooms, though <strong>of</strong> non- toxic variety,<br />
have been observed for <strong>the</strong> first time in Balayan<br />
Bay in 2002. This is being aggravated by inorganic<br />
fertilizer run <strong>of</strong>f and domestic waste dumping.<br />
• There is increased spread <strong>of</strong> vector-borne disease<br />
(dengue fever and malaria) and waterborne<br />
diseases (diarrhea).<br />
• Natural disasters cause injuries, illness, loss <strong>of</strong> life.<br />
• Heat stress is experienced from extremely hot<br />
periods.<br />
• Health and food service delivery is disrupted due<br />
to damage to infrastructures, roads and bridges.<br />
Malnutrition and food shortages during extreme<br />
events are experienced.<br />
• There is increased emotional and psychological<br />
stress due to calamities and loss <strong>of</strong> livelihood.<br />
As an added dimension, <strong>the</strong> assessment can be carried<br />
out according to geographic scope, population and<br />
temporal scale when dealing with infection and reduced<br />
access to basic services. Systematic documentation<br />
and monitoring <strong>of</strong> health and safety aspects, even if<br />
qualitatively, will guide responses in adaptation. These<br />
are <strong>the</strong> next steps to be pursued to complete <strong>the</strong> full<br />
vulnerability assessment.<br />
iii. Climate change-ready physical infrastructure for<br />
disaster and risk management and ecosystem-based<br />
water supply system (distribution), drainage and<br />
sanitation<br />
Safety issues generated by storminess and accelerated<br />
sea level rise as well as by increased sea surface<br />
temperature apply not only to <strong>the</strong> physical infrastructure<br />
for foreshore development but for coastal communities<br />
in general. Vulnerability to <strong>the</strong> destruction <strong>of</strong> physical<br />
infrastructure cited in Table 32 indicates direct effects<br />
on quality <strong>of</strong> life and can result in injuries, illness, loss <strong>of</strong><br />
incomes and lives.<br />
• Destruction <strong>of</strong> infrastructures, transport and utilities<br />
destabilizes <strong>the</strong> safe delivery <strong>of</strong> basic services such<br />
as food, water and health.<br />
• Disaster and risk management plans are<br />
inadequate.<br />
• There are no management plans for river-to-sea<br />
linkages for flows <strong>of</strong> water, nutrients, soils and<br />
species.<br />
• The natural coastal defense structures such as<br />
mangroves that can serve as buffer against storm<br />
72
chapter 2 • human well-being and climate change: results and discussion<br />
surges have been converted into fishponds and<br />
o<strong>the</strong>r uses.<br />
• Housing development is increasing in coastal areas<br />
(example is Nasugbu).<br />
• The domestic water supply needs are being<br />
provided by existing water districts, municipal water<br />
system and barangay waterworks associations, with<br />
groundwater as <strong>the</strong> main source <strong>of</strong> potable water,<br />
however, extraction is not regulated.<br />
These combined factors can explain weak water supply<br />
system, sanitation and drainage beyond physical<br />
infrastructure. Human settlements in coastal areas<br />
are commonly inhabited by fisherfolk in precarious<br />
economic existence, live in unplanned and temporary<br />
settlements, have limited access to clean water<br />
and sufficient nutrition, lack education, sanitation<br />
and adequate health-care provision, and lack social<br />
status. Also, <strong>the</strong> informal nature or remoteness <strong>of</strong> <strong>the</strong>ir<br />
settlements means that relief efforts are less likely to<br />
reach <strong>the</strong>m. These situations are aggravated by <strong>the</strong> lack<br />
<strong>of</strong> public knowledge <strong>of</strong> <strong>the</strong> impacts <strong>of</strong> climate change<br />
and possible adaptation measures.<br />
Overall vulnerability assessment<br />
Based on <strong>the</strong> potential impacts <strong>of</strong> climate change,<br />
experts’ advice based on <strong>the</strong> review <strong>of</strong> agency reports<br />
and inter-agency workshops, scores were assigned<br />
that reflect <strong>the</strong> overall vulnerability in health and safety.<br />
For each climate projection with high likelihood <strong>of</strong><br />
occurrence, vulnerability was assessed in terms <strong>of</strong><br />
exposure and sensitivity (1=Low, 2=Medium, 3=High).<br />
Table 61 provides a summary <strong>of</strong> <strong>the</strong> scores.<br />
Assessment <strong>of</strong> adaptive capacity<br />
Adaptive mechanisms in health and safety are present<br />
in relation to health services which are devolved to<br />
<strong>the</strong> LGU, as well as coastal resource management<br />
(discussion included in <strong>the</strong> fisheries sector), disaster<br />
response and solid waste management. These are<br />
positive investments that can steer programs in<br />
adaptation and even mitigation (Table 62).<br />
Table 62. Assessment <strong>of</strong> <strong>the</strong> climate change adaptive capacity for health<br />
and safety for <strong>the</strong> <strong>Verde</strong> <strong>Island</strong> <strong>Passage</strong>, 2009.<br />
Capacity Municipal Provincial National<br />
requirements level level level<br />
IEC<br />
Policy formulation and implementation<br />
Management bodies<br />
LGU-NGO partnerships<br />
Community involvement<br />
To link concerns about climate change adaptation to<br />
health and safety impacts in <strong>the</strong> <strong>Verde</strong> <strong>Island</strong> <strong>Passage</strong><br />
is a big challenge. As such adaptation is still being<br />
incorporated into governance: <strong>the</strong> goals, framework,<br />
strategy, and action plans are still being addressed by<br />
<strong>the</strong> government. The basic units <strong>of</strong> management are<br />
operational, but <strong>the</strong> demands <strong>of</strong> responding to climate<br />
change needs scaling up in strategies and operations.<br />
A Provincial Disaster Coordinating Office (PACD) or<br />
a City Disaster Management Coordinating Council is<br />
expectedly a big challenge in all areas. Their disaster<br />
risk and management plans are still currently being<br />
formulated but <strong>the</strong> following programs that are<br />
functional include <strong>the</strong> organization <strong>of</strong> Barangay Disaster<br />
Coordinating Councils, formulation <strong>of</strong> contingency<br />
plans for different events at <strong>the</strong> municipality level,<br />
implementation and periodic updating on communities<br />
and populations in vulnerable areas and also on<br />
evacuation centers.<br />
3<br />
2<br />
2<br />
3<br />
3<br />
3<br />
2<br />
2<br />
3<br />
3<br />
3<br />
3<br />
2<br />
2<br />
3<br />
Table 61. Health and safety vulnerability assessment <strong>of</strong> <strong>the</strong> <strong>Verde</strong> <strong>Island</strong> <strong>Passage</strong>, 2009.<br />
Vulnerability<br />
Vulnerability<br />
Indicators <strong>of</strong> VIP vulnerability within 10 years within 50 years<br />
Flood-prone index (by area category)<br />
Category 1: Almost flooded as a result <strong>of</strong> heavy rains aggravated by high tide or rise in water level or nearby<br />
seas, lakes, rivers, etc.<br />
Category 2: Flooded only after several days <strong>of</strong> heavy and continuous rains with subsequent rise in water level<br />
or lakes, seas, dikes, rivers and canals.<br />
Category 3: Flooded only after several days <strong>of</strong> exceptionally heavy or continuous rains.<br />
Category 4: Never experienced flood but present environmental condition in <strong>the</strong> area warrants LGU’s concern<br />
on flood, flash flood, land slides and mudslides.<br />
Category 5: Residential areas, national and provincial road networks prone to landslide and mudslides.<br />
high<br />
high<br />
moderate to high<br />
moderate to high<br />
moderate to high<br />
high<br />
high<br />
high<br />
high<br />
high<br />
Health and disease Index (direct effect on health)<br />
• diseases that are temperature-related, water and food-borne, vector- and rodent-borne<br />
• food and water shortages<br />
• extreme temperature-related health effects<br />
• mental, nutritional, o<strong>the</strong>r infectious health effects<br />
moderate to high<br />
low to moderate<br />
low<br />
low<br />
high<br />
moderate to high<br />
moderate to high<br />
low to moderate<br />
CC-ready and ecosystem-based physical infrastructure (direct effect on health)<br />
• DRM physical infrastructure<br />
• water supply system<br />
• drainage system<br />
• sanitation system<br />
moderate to high<br />
low to moderate<br />
moderate to high<br />
moderate to high<br />
high<br />
high<br />
high<br />
high<br />
73
climate change vulnerability assessment <strong>of</strong> <strong>the</strong> verde island passage, philippines<br />
Solid waste management as mandated by R.A.<br />
9003 has set up plans at all levels <strong>of</strong> <strong>the</strong> LGU<br />
through Solid Wastes Management Board with<br />
multi-sectoral representatives as members. There<br />
are also health service and social welfare agencies/<br />
institutions/ assistance centers that work at all levels<br />
<strong>of</strong> governance, with programs and services such as<br />
formal and non-formal education, skills training, spiritual<br />
enrichment, social services, livelihood assistance,<br />
and cooperative development. The Fishery and<br />
Aquatic Resource Management Council (FARMC),<br />
Community Environment and Natural Resources Office,<br />
Protected Areas Management Board and Community-<br />
Based Forestry Management Board are key units<br />
mandated to manage and protect <strong>the</strong> environment.<br />
Meanwhile, community and household capacities and<br />
means in adapting to health emergencies need to be<br />
streng<strong>the</strong>ned and enhanced. Disasters in recent events<br />
have tacitly demonstrated <strong>the</strong> impact <strong>of</strong> climate change<br />
and how adaptation is urgently warranted.<br />
74
Conclusions and recommendations<br />
chapter 2 • human well-being and climate change: conclusions and recommendations<br />
Performing a vulnerability assessment and suggesting<br />
adaptation and mitigation strategies is not a one-time<br />
activity. All previous studies and guidebooks point to<br />
<strong>the</strong> need to treat this as an iterative process, involving<br />
as many stakeholders as possible. Baselines as<br />
starting point in vulnerability assessment have been<br />
crafted opportunistically in <strong>the</strong> research. Whe<strong>the</strong>r<br />
through accessed agency data sets or generated from<br />
participative methods, benchmarks that are expected<br />
from governance units revealed huge gaps that could<br />
provide concerned agencies with a sound basis for a<br />
comprehensive vulnerability assessment and planning<br />
adaptation measures.<br />
In <strong>the</strong> course <strong>of</strong> pr<strong>of</strong>iling foreshore areas, for health<br />
and disaster as well as risk mitigation, it was noted that<br />
many <strong>of</strong> <strong>the</strong> issues are institutional in nature and can<br />
be resolved even without having to factor in climate<br />
change. As consensus, participants in <strong>the</strong> project<br />
recommended <strong>the</strong> following cross-cutting measures<br />
that may be implemented immediately at <strong>the</strong> LGU level<br />
to facilitate vulnerability assessments:<br />
• Draft municipal pr<strong>of</strong>iles that are climate change<br />
smart and efficiently used, systematize baseline and<br />
M&E inclusive <strong>of</strong> CC.<br />
• Establish a database system for use in synergy by<br />
mandated agencies.<br />
• Review existing environmental policies and<br />
ordinances related to ecosystem-based adaptation<br />
goals, framework and strategies, have policy<br />
reforms and mechanisms for <strong>the</strong>se (across<br />
household, community, institutional level).<br />
Follow-up activities are best pursued immediately,<br />
to document and assess <strong>the</strong> process and lessons<br />
learned along <strong>the</strong> way. More importantly, <strong>the</strong> identified<br />
adaptation and mitigation options should be given<br />
priority in implementation by <strong>the</strong> stakeholders and<br />
partners if conclusions <strong>of</strong> <strong>the</strong> vulnerability assessment<br />
exercise indicate <strong>the</strong> area is highly vulnerable to climate<br />
change.<br />
Scores <strong>of</strong> recommendations are presented to<br />
management units to address climate change impacts<br />
across sectors. Institutional problems and development<br />
issues are recognized as serious constraints that<br />
efforts in adaptation and mitigation have to overcome,<br />
as well as challenges such as competing directions in<br />
development; corruption; lack <strong>of</strong> political will; priorities<br />
in <strong>the</strong> use <strong>of</strong> public funds; destructive, unregulated use<br />
<strong>of</strong> natural resources (mining, over fishing, etc.); and<br />
conflicting laws or <strong>the</strong>ir non- or weak enforcement.<br />
Fisheries<br />
The exercise confirmed that climate change affects<br />
different types <strong>of</strong> fisheries as source <strong>of</strong> livelihood and<br />
domestic food in various ways but mostly negatively<br />
due to decline in production and productivity as well<br />
as shifting operational regimes. Virtually all types <strong>of</strong><br />
capture fisheries in <strong>Verde</strong> <strong>Island</strong> <strong>Passage</strong> are vulnerable<br />
to climate change due to its direct impacts resulting<br />
from increase in sea surface temperature (small<br />
pelagics and seaweed culture) and indirect impacts<br />
on coastal habitats that provide nursery grounds for<br />
important fish and invertebrates.<br />
Aquarium fishing is one <strong>of</strong> <strong>the</strong> more vulnerable sectors<br />
in <strong>the</strong> fishery because <strong>the</strong> reef fish are highly dependent<br />
on reef health. An aggravating factor is <strong>the</strong> general<br />
prohibition imposed by <strong>the</strong> LGUs on this activity due to<br />
its historical association with cyanide. Tuna fishing and<br />
fishing <strong>of</strong> small pelagics are vulnerable, particularly in<br />
<strong>the</strong> municipal sector which may not adapt immediately<br />
to changing operational regimes. Mechanization and<br />
changing gears is an option for adaptation but this may<br />
not be very prudent in <strong>the</strong> light <strong>of</strong> overfishing, and may<br />
negate efforts to rehabilitate coastal habitats. Maximum<br />
Sustainable Yield (MSY) or its best approximation<br />
should be estimated to enable informed decision<br />
making.<br />
• Prepare most vulnerable fishing activities by training<br />
in alternative livelihood.<br />
• Implement coastal habitat protection as short term<br />
but sustained adaptation methods.<br />
• Gear adaptation or mechanization as pelagic fish<br />
shall move far<strong>the</strong>r <strong>of</strong>fshore provided that level <strong>of</strong><br />
fishing effort does not exceed sustainable limits and<br />
that carrying capacity is first determined.<br />
• Educate seaweed farmers on appropriate methods<br />
least impacted on by increase in sea surface<br />
temperature.<br />
• Generate area based/site based data and improve<br />
catch statistics collection.<br />
• Maintain logbooks or data collection at landing sites<br />
(specifically on areas fished) may contribute to <strong>the</strong><br />
overall understanding <strong>of</strong> climate change impacts<br />
on fisheries, in particular, and to overall fisheries<br />
utilization, in general.<br />
• Confirm, through focused research, impacts <strong>of</strong><br />
increasing sea surface temperature and accelerated<br />
sea level rise on commercially important species.<br />
• Diversify livelihoods <strong>of</strong> coastal communities.<br />
75
climate change vulnerability assessment <strong>of</strong> <strong>the</strong> verde island passage, philippines<br />
Tourism sector<br />
Policy and implementation mechanisms were identified,<br />
all <strong>of</strong> which could address climate change impacts but<br />
will bring in o<strong>the</strong>r benefits in pursuit <strong>of</strong> environmental<br />
management, such as <strong>the</strong> following:<br />
• Strictly implement existing laws at both <strong>the</strong> national<br />
and municipal levels.<br />
• Develop sustainable financing mechanisms, such as<br />
implementing user fees in o<strong>the</strong>r areas and covering<br />
recreational activities o<strong>the</strong>r than scuba diving.<br />
• Streng<strong>the</strong>n existing organizations and management<br />
bodies.<br />
• Increase technical expertise on survey and<br />
monitoring <strong>of</strong> underwater resources at <strong>the</strong> local<br />
level.<br />
Recommendations that directly deal with climate<br />
change impacts were also provided by inter-agency<br />
workshop participants:<br />
• Include CC adaptation strategies in all AIPs.<br />
• Convene all major stakeholders <strong>of</strong> <strong>the</strong> tourism<br />
industry to formulate an adaptation plan in dealing<br />
with CC, to include resort owners, boat operators,<br />
and tourism-related associations.<br />
• Provide incentives for community/PO to get <strong>the</strong>ir<br />
involvement and commitment.<br />
• Develop reader-friendly information materials and<br />
multimedia IEC materials on climate change.<br />
Foreshore development<br />
Many <strong>of</strong> <strong>the</strong> management recommendations for<br />
foreshore area management deal with institutional<br />
changes within <strong>the</strong> current government set-up<br />
as well as completion <strong>of</strong> baseline and monitoring<br />
records. National government agencies are being<br />
asked to issue policies that will mandate LGUs to<br />
manage <strong>the</strong>ir respective foreshore areas. LGUs are<br />
recommending that foreshore area management be<br />
devolved to <strong>the</strong>m, so that <strong>the</strong>y can appropriately issue<br />
a moratorium on Foreshore Lease Agreements (FLA).<br />
Should management remain within <strong>the</strong> DENR, LGUs<br />
recommend stricter monitoring, shortening <strong>of</strong> FLA<br />
periods, and revocation <strong>of</strong> agreements for those that do<br />
not comply with <strong>the</strong> FLA conditions.<br />
Following is a list <strong>of</strong> management recommendations<br />
being made for national government agencies.<br />
Recommendations specific to addressing climate<br />
change include <strong>the</strong> following:<br />
• Implement adaptive building design to address<br />
accelerated sea level rise and storm surges.<br />
• Allocate budget for addressing climate change<br />
impacts.<br />
• Institutionalize Task Force on Climate Change at all<br />
levels <strong>of</strong> government.<br />
Within <strong>the</strong> mandate <strong>of</strong> LGUs, a number <strong>of</strong><br />
recommendations emerged that may address climate<br />
change impacts but can result in o<strong>the</strong>r benefits as well:<br />
• All LGUs should create and designate MENRO.<br />
• Implement mangrove reforestation.<br />
• Translate policies, plans, etc. for action by barangay<br />
chairpersons.<br />
• Strictly enforce <strong>the</strong> building code.<br />
• Streng<strong>the</strong>n LGU-NGO partnerships.<br />
• Include upland stakeholders in CRM planning and<br />
activities.<br />
Specific to management <strong>of</strong> foreshore areas are as<br />
follows:<br />
• Devolve FLA approval to LGUs, so <strong>the</strong> latter can<br />
issue moratorium on FLAs.<br />
• DILG to mandate LGUs to manage foreshore areas.<br />
• DENR should monitor FLAs.<br />
• Revoke agreements between leases and<br />
government for non-compliance <strong>of</strong> terms.<br />
• Shorten FLA term for foreshore areas that are titled.<br />
• Encourage owners to undertake mangrove<br />
reforestation.<br />
• Revoke titles <strong>of</strong> abandoned foreshore areas.<br />
• Amend existing policies, resolutions, etc. to specify<br />
rules on foreshore areas.<br />
In order to address foreshore area management<br />
more effectively, participants recommend undertaking<br />
research in <strong>the</strong> following areas:<br />
• Complete physical inventory and socio-economic<br />
pr<strong>of</strong>ile <strong>of</strong> foreshore areas.<br />
• More research on coastal erosion.<br />
• Complete inventory <strong>of</strong> environment-related policies.<br />
Health and food safety<br />
People’s health an be compromised by abrupt changes<br />
in atmospheric temperature, accelerated sea level<br />
rise and saltwater intrusion into groundwater sources.<br />
Immediate negative impacts can occur to livelihood<br />
and income, food security, health, education, human<br />
settlement and housing.<br />
• Have health and safety in <strong>the</strong> climate change<br />
adaptation framework and strategy <strong>of</strong> <strong>the</strong> lead<br />
mandated agency (DOH, LGU).<br />
76
• Build up from local to national level a public policy<br />
to address demographic pressures on socioeconomic<br />
and natural resources.<br />
• LGUs to function as coordinative mechanism<br />
for climate change adaptation concerns: health<br />
and food security with coastal and marine-based<br />
resources; health and safety with water, settlement<br />
expansion, infrastructure.<br />
• Plan for <strong>the</strong> current food and health security<br />
systems and infrastructure in anticipation <strong>of</strong> food<br />
scarcity and diseases brought about by climate<br />
changes.<br />
• Increase human safety, have disaster risk reduction,<br />
have flood hazard mapping, disease control.<br />
• Have a disease surveillance mechanism.<br />
• Put in place plans and programs to provide for safe<br />
water especially in times <strong>of</strong> calamities.<br />
• Use surface water instead <strong>of</strong> groundwater for both<br />
domestic and agricultural use.<br />
• Regulate ground water extraction.<br />
• Protect watersheds.<br />
• Strictly enforce building code.<br />
• Relocate coastal communities.<br />
• Craft policy to declare <strong>the</strong> 100 meter zone from <strong>the</strong><br />
highest tide as a no-development zone and <strong>of</strong>f limits<br />
to human settlements.<br />
• Manage domestic and industrial waste properly<br />
to pre-empt its aggravate role in climate change<br />
impacts.<br />
• Set up measures to manage domestic wastes and<br />
agricultural run <strong>of</strong>f have to be put in place to reduce<br />
<strong>the</strong> possibility <strong>of</strong> toxic algal blooms.<br />
As an opportunity in iterative learning, <strong>the</strong> vulnerability<br />
assessment presented in this report certainly has a lot<br />
<strong>of</strong> room for improvement and refinement. Fur<strong>the</strong>rmore,<br />
<strong>the</strong>re are quite substantial data requirements that are<br />
needed before a full assessment can be undertaken.<br />
Never<strong>the</strong>less, most if not all <strong>of</strong> <strong>the</strong> data requirements<br />
are possibly available at government and local <strong>of</strong>fices,<br />
or can eventually be generated when data ga<strong>the</strong>ring<br />
is improved. Quick surveys can be conducted by<br />
stakeholders to secure some <strong>of</strong> <strong>the</strong> data requirements<br />
that are not available easily. Once it has been applied<br />
in <strong>the</strong> <strong>Verde</strong> <strong>Island</strong> <strong>Passage</strong>, <strong>the</strong> stakeholders should<br />
take note <strong>of</strong> which parts <strong>of</strong> <strong>the</strong> framework are useful<br />
and which ones can be improved. Only <strong>the</strong>n can it be<br />
subjected to replication in o<strong>the</strong>r conservation corridors<br />
in <strong>the</strong> country.<br />
chapter 2 • human well-being and climate change: conclusions and recommendations<br />
77
climate change vulnerability assessment <strong>of</strong> <strong>the</strong> verde island passage, philippines<br />
References<br />
A. Special Studies<br />
Arias, J. 2009. Economic Vulnerability and Possible Adaptations to<br />
Coastal Erosion in San Fernando City, La Union, <strong>Philippines</strong>. EEPSEA,<br />
Singapore.<br />
Bigano, Andrea, Hamilton, Jacqueline M. and Tol, Richard S. J., 2006. The<br />
Impact <strong>of</strong> Climate Change on Domestic and International Tourism: A<br />
Simulation Study, (June 1, 2006). FEEM Working Paper No. 86.2006;<br />
CMCC Research Paper No. 04.<br />
Conservation International (CI). (n.d.) The <strong>Verde</strong> <strong>Island</strong> <strong>Passage</strong> Marine<br />
Biodiversity Conservation Corridor.<br />
___________. (n.d.) Sulu-Sulawesi Seascape, Ensuring Living Seas for<br />
Generations. CI, Department <strong>of</strong> Environment and Natural Resources<br />
(DENR), and Haribon Foundation. (2007). Priority Sites for Conservation<br />
in <strong>the</strong> <strong>Philippines</strong>: Key Biodiversity Areas.<br />
De la Paz, Ma. Corazon G. and Colson, Lisa. (October 2008). Population,<br />
Health, and Environment Issues in <strong>the</strong> <strong>Philippines</strong>: A Pr<strong>of</strong>ile <strong>of</strong> <strong>the</strong><br />
ARMM. Washington, D.C.: Population Reference Bureau. (PRB)<br />
Ehmer, Philipp and Eric Heymann, April 2008. Climate Change and<br />
Tourism: Where Will <strong>the</strong> Journey Lead Deutsche Bank Research,<br />
Frankfurt, Germany.<br />
Gonzales, Minerva. July-August 2009 Report prepared for <strong>the</strong> CI <strong>Verde</strong><br />
<strong>Island</strong> <strong>Passage</strong> Vulnerability Assessment.<br />
Foundation <strong>of</strong> <strong>the</strong> Faculty <strong>of</strong> Science <strong>of</strong> <strong>the</strong> University <strong>of</strong> Lisbon, 2009.<br />
Climate Change and Tourism in Portugal: Potential Impacts and<br />
Adaptation Measures (CLITOP). Portuguese Science and Technology<br />
Foundation, Lisbon, Portugal.<br />
Hamilton, J. And R. Tol, 2007 (). The Impact <strong>of</strong> Climate Change on<br />
Tourism and Recreation. Centre for Marine and Climate Research,<br />
Hamburg University, Hamburg Germany. http://www.anilaodiving.com/<br />
divingservices.htm<br />
Lusterio-Berja, Clarinda and Colson, Lisa. (October 2008). Population,<br />
Health, and Environment Issues in <strong>the</strong> <strong>Philippines</strong>: A Pr<strong>of</strong>ile <strong>of</strong> <strong>the</strong><br />
Calabarzon (Region 4-A). Washington, D.C.: PRB.<br />
Moreno, Alvaro and Susanne Becken, 2009. “A climate change vulnerability<br />
assessment methodology for coastal tourism”, Journal <strong>of</strong> Sustainable<br />
Tourism, 17:4,473 — 488.<br />
Peeters, P. (undated) The Impact <strong>of</strong> Tourism on Climate Change. Centre for<br />
Sustainable Tourism and Transport, NHV University for Applied Sciences,<br />
Breda, Ne<strong>the</strong>rlands.<br />
Munday, Philip L. 1,2 , Ge<strong>of</strong>frey P Jones 1,2 , Morgan S Pratchett 1 and<br />
Ashley J Williams 3<br />
Climate change and <strong>the</strong> future for coral reef fishes. 1 ARC Centre <strong>of</strong><br />
Excellence for Coral Reef Studies, James Cook University, Townsville,<br />
Qld 4811, Australia; 2 School <strong>of</strong> Marine and Tropical Biology, James<br />
Cook University, Townsville, Qld 4811, Australia; 3 Fishing and Fisheries<br />
Research Centre, School <strong>of</strong> Earth and Environmental Sciences, James<br />
Cook University, Townsville, Qld 4811, Australia . Fish and Fisheries<br />
9(3): 261-285<br />
Perez, R., L. Amadore and R. Feir, August 1999. Climate Change Impacts<br />
and Responses in <strong>the</strong> <strong>Philippines</strong> Coastal Sector. Climate Research, Vol.<br />
12:97-107,1999.<br />
Partnerships in Environmental Management for <strong>the</strong> Seas <strong>of</strong> East Asian<br />
(PEMSEA). (2009). State <strong>of</strong> <strong>the</strong> Coasts <strong>of</strong> Batangas Province.<br />
Population Reference Bureau (PRB). (2006). Making <strong>the</strong> Link in <strong>the</strong><br />
<strong>Philippines</strong>: Population Health and Environment. Washington, D.C.: PRB.<br />
Sales RFM. Vulnerability and adaptation <strong>of</strong> coastal communities to climate<br />
variability and sea- level rise: Their implications for integrated coastal<br />
management in Cavite City, <strong>Philippines</strong>, Ocean and Coastal Management<br />
(2009), doi: 10.1016/j.ocecoamN.2009.04.007<br />
Scantlebury, M. (undated). The Impact <strong>of</strong> Climate Change on Heritage<br />
Tourism in <strong>the</strong> Caribbean: A Case Study from Speightstown, Barbados,<br />
West Indies. International Journal <strong>of</strong> Climate Change: Impacts and<br />
Responses, Volume 1, Issue 2, Florida, USA.<br />
Simmons, D. 2009. The Impact <strong>of</strong> Climate Change on Australian Tourism<br />
Destinations: Developing Adaptation and Response Strategies.<br />
Sustainable Tourism Cooperative Research Center (STCRC),<br />
Government <strong>of</strong> Australia.<br />
Simpson, M.C., Gössling, S., Scott, D., Hall, C.M. and Gladin, E. (2008)<br />
Climate Change Adaptation and Mitigation in <strong>the</strong> Tourism Sector:<br />
Frameworks, Tools and Practices. UNEP, University <strong>of</strong> Oxford, UNWTO,<br />
WMO: Paris, France.<br />
Tompkins et al. 2005—“Surviving Climate Change in Small <strong>Island</strong>s”. In<br />
Simpson, M.C., Gössling, S., Scott, D., Hall, C.M. and Gladin, E. (2008)<br />
Climate Change Adaptation and Mitigation in <strong>the</strong> Tourism Sector:<br />
Frameworks, Tools and Practices. UNEP, University <strong>of</strong> Oxford, UNWTO,<br />
WMO: Paris, France.<br />
United Nations World Tourism Organization (UNWTO), <strong>the</strong> United Nations<br />
Environment Programme (UNEP) and <strong>the</strong> World Meteorological<br />
Organization (WMO), October 2007. Davos Declaration on Climate<br />
Change and Tourism: Responding to Global Challenges. Second<br />
International Conference on Climate Change and Tourism, Davos,<br />
Switzerland.<br />
United States Agency for International Development, 2009. Adapting to<br />
Coastal Climate Change: A Guidebook for Development Planners.<br />
Coastal Resources Center-University <strong>of</strong> Rhode <strong>Island</strong> and International<br />
Resources Group (IRG)-USAID, USA.<br />
B. Accessed Official Government Agency Records<br />
Baatangas City Office <strong>of</strong> <strong>the</strong> Planning and Development Coordinator<br />
(OCPDC). Batangas City Socioeconomic, Physical and Political Pr<strong>of</strong>ile,<br />
CY 2007.<br />
Batangas Provincial Health Office. 2007 and 2008 A1, A2 and A3 records<br />
accessed June 2009.<br />
Batangas Provincial Planning and Development Office (PPDO). 2006 and<br />
2007 Provincial Socio-Economic Pr<strong>of</strong>iles/Physical Framework Plans and<br />
o<strong>the</strong>r records accessed June 2009.<br />
Bauan Municipal Planning and Development Office (MPDO). (2003).<br />
Bauan Comprehensive Land Use Plan and Zoning Ordinance.<br />
Municipalities <strong>of</strong> Lubang and Looc, National Economic Development<br />
Authority Region IV, and Development Planning and Environmental<br />
Management, Inc. (n.d.). Lubang <strong>Island</strong> Sustainable Tourism Development<br />
Plan.<br />
Morella, Cecil. (May 2007). <strong>Verde</strong> <strong>Island</strong> <strong>Passage</strong>: Centre <strong>of</strong> Centre <strong>of</strong><br />
Marine Biodiversity.<br />
Marinduque and Romblon. Accessed from NSO Quickstat websites on 27<br />
July-03 August 2009.<br />
Occidental Mindoro PPDO. 2007-2009 records accessed August 2009.<br />
Oriental Mindoro PPDO. Briefing Kit for 2008 and o<strong>the</strong>r records accessed<br />
August 2009.<br />
__________. (2009). <strong>Verde</strong> <strong>Island</strong> <strong>Passage</strong> Marine Biodiversity<br />
Conservation Corridor Management Plan.<br />
National Statistical Coordinating Board (NSCB). (2008a). Philippine<br />
Statistical Yearbook 2008.<br />
____________. (2008b). Philippine Poverty Statistics, 2006. Accessed from<br />
http://www.nscb.gov.ph/poverty/2006_05mar08, on 14 August 2009.<br />
National Statistics Office (NSO). (2008). 2007 Census <strong>of</strong> Population.<br />
Accessed from http://www.census.gov.ph/data/pressrelease/ 2008/<br />
pr0830tx.html, on 20 July 2009.<br />
__________. (2008). 2007 Census <strong>of</strong> Population, Annual Growth<br />
Rates Per Province. Accessed from http://www.census.gov.ph/data/<br />
sectordata/2007/province.pdf, on 03 September 2009.<br />
__________. (2008). Families with access to safe water and sanitary<br />
toilet facilities per region. Accessed from http://www.census.gov.ph/<br />
data/sectordata/ap2007/tx.html and http://www.census.gov.ph/data/<br />
sectordata/2007/ ap0703.htm, on 03 September 2009.<br />
___________. (2008). Quickstat on Batangas, Occidental Mindoro, Oriental<br />
Mindoro<br />
C. Miscellaneous<br />
Lesaba, M.E., 2009. Fishing for Pets. Philippine Daily Inquirer article, April<br />
19, 2009.<br />
78
chapter 3 • recommendations for adapting to climate change impacts<br />
Chapter 3:<br />
Recommendations for adapting to<br />
climate change impacts<br />
Climate change has already altered <strong>the</strong> balance <strong>of</strong> <strong>the</strong><br />
oceans with serious and irreversible consequences<br />
for marine ecosystems and <strong>the</strong> services <strong>the</strong>y provide.<br />
The disruption <strong>of</strong> ecological functions and ecosystem<br />
services has severe impacts on <strong>the</strong> well-being <strong>of</strong> human<br />
communities, especially in coastal areas like <strong>the</strong> <strong>Verde</strong><br />
<strong>Island</strong> <strong>Passage</strong>, where human dependencies on <strong>the</strong><br />
oceans are high. Immediate and substantial actions<br />
need to be taken to increase <strong>the</strong> adaptive capacity <strong>of</strong><br />
coastal marine ecosystems and <strong>the</strong> people that depend<br />
on <strong>the</strong>m. Adapting to climate change is <strong>the</strong> only solution<br />
to ensure ecosystems and human societies can survive<br />
and maintain <strong>the</strong>ir well-being when exposed to climate<br />
change impacts. To decrease vulnerabilities <strong>of</strong> <strong>the</strong><br />
<strong>Verde</strong> <strong>Island</strong> <strong>Passage</strong> to climate change, <strong>the</strong> following<br />
recommendations should be implemented.<br />
79
climate change vulnerability assessment <strong>of</strong> <strong>the</strong> verde island passage, philippines<br />
Implement:<br />
• municipal management strategies that are climate change-smart and efficiently<br />
used, and ecosystem monitoring and evaluation that address climate change.<br />
• sustainable aquaculture practices that minimize <strong>the</strong> impacts to <strong>the</strong> natural<br />
ecosystems (e.g., low density finfish pens and chemical-free shrimp ponds).<br />
• a review <strong>of</strong> existing local, regional, and national policies and ordinances focused<br />
on resource management and reform to include ecosystem-based adaptation, and<br />
enable new frameworks where necessary.<br />
• guidelines and best practices for coastal and foreshore development planning that<br />
take into account <strong>the</strong> potential for increased storm activity, salt water intrusion, and o<strong>the</strong>r climate change impacts.<br />
Regulate:<br />
• artificial reef development, channel dredging, and seaweed farming through zoning<br />
activities.<br />
• <strong>the</strong> establishment <strong>of</strong> better enforcement <strong>of</strong> illegal fishing activities including blast<br />
fishing, cyanide fishing, and shark fin fishing.<br />
• use <strong>of</strong> sustainable fishing gear to minimize bycatch.<br />
Instigate:<br />
• use <strong>of</strong> newly propagated accretion from eroded uplands for mangroves as a buffer<br />
against coastal erosion and large waves.<br />
• <strong>the</strong> improvement and retr<strong>of</strong>it <strong>of</strong> existing infrastructure to make sure <strong>the</strong>y can<br />
sustain climate impacts.<br />
• appropriate engineering <strong>of</strong> ports, quarries, and foreshore development so as to not<br />
impact long-shore sediment movement.<br />
• use <strong>of</strong> best management practices for fishing on coral reefs, seagrass beds, and<br />
mangrove forests, and increased enforcement towards illegal and destructive<br />
practices (e.g., dynamite fishing and push nets).<br />
• enforcement against deforestation and extensive agriculture in <strong>the</strong> watersheds that promote high sediment run<strong>of</strong>f,<br />
causing coral reef degradation and <strong>the</strong> decline <strong>of</strong> coastal and <strong>of</strong>fshore fisheries.<br />
80
chapter 3 • recommendations for adapting to climate change impacts<br />
Establish:<br />
• Marine Protected Areas to reduce current impacts, preserve biodiversity, and<br />
sustain fisheries, increasing <strong>the</strong> resilience and adaptive capacity <strong>of</strong> marine<br />
ecosystems to sustain climate change impacts.<br />
• climate-smart Marine Protected Areas that apply adaptive management<br />
approaches to address current and future climate change impacts.<br />
• outreach programs to create awareness and engage communities on climate<br />
change and its impacts on marine resources.<br />
• enforcement patrol and communication tools among wardens within <strong>the</strong> local<br />
Marine Protected Area network.<br />
Protect:<br />
• areas <strong>of</strong> critical life stages <strong>of</strong> vulnerable fisheries species, e.g., siganids, and<br />
critical biological communities, e.g., upwelling areas.<br />
• natural mangrove, seagrass, and coral habitats that act as natural coastal defense<br />
mechanisms, reducing erosional processes and buffering storms and o<strong>the</strong>r<br />
extreme wea<strong>the</strong>r events.<br />
• a variety <strong>of</strong> habitats including seagrass, seaweed, and mangroves as <strong>the</strong>y support<br />
various life stages <strong>of</strong> multiple fisheries species.<br />
• areas (e.g., Mabini, Puerto Galera), species (e.g., whale sharks), and ecosystems<br />
(e.g., mangroves, coral reefs) that sustain important tourism activities, providing income for local communities.<br />
Diversify:<br />
• livelihoods for coastal miners (e.g., pebble picking) to reduce coastal erosion and<br />
enable revenues to derive from sustainable practices.<br />
• livelihoods, particularly for climate change-vulnerable activities such as aquarium<br />
fishing.<br />
• gear use, adaptation, and mechanization within sustainable limits to facilitate<br />
fishing as fish move far<strong>the</strong>r <strong>of</strong>fshore.<br />
• opportunities for solid waste and chemical disposal that favor <strong>the</strong> spread <strong>of</strong><br />
disease, pollution, and burial <strong>of</strong> important coastal ecosystems (e.g., seagrass<br />
meadows and mangrove seedlings).<br />
81
climate change vulnerability assessment <strong>of</strong> <strong>the</strong> verde island passage, philippines<br />
82
chapter 4 • outreach and communication strategy<br />
Chapter 4:<br />
Outreach and communication<br />
strategy<br />
Miledel C. Quibilan 1 and Giuseppe Di Carlo 2, Lead Integrators<br />
Contributing Authors: Michele Reyes (consultant)<br />
1 Marine Science Institute, College <strong>of</strong> Science, University <strong>of</strong> <strong>the</strong> <strong>Philippines</strong>–Diliman, Quezon City, <strong>Philippines</strong><br />
2 Conservation International–USA<br />
83
climate change vulnerability assessment <strong>of</strong> <strong>the</strong> verde island passage, philippines<br />
Executive summary<br />
Conservation International (CI)–<strong>Philippines</strong> conducted<br />
a vulnerability assessment for <strong>the</strong> impacts <strong>of</strong> climate<br />
change on marine biodiversity and related human<br />
well-being in <strong>the</strong> <strong>Verde</strong> <strong>Island</strong> <strong>Passage</strong>. The project<br />
investigated possible ecological effects <strong>of</strong> climate<br />
change in <strong>the</strong> region to inform stakeholders and build<br />
local support for such impacts. Initial workshops<br />
were held in Batangas, Occidental Mindoro, and<br />
Oriental Mindoro in February and March <strong>of</strong> 2009.<br />
These workshops served as venues for stakeholders<br />
to present <strong>the</strong>ir views about <strong>the</strong> effects <strong>of</strong> climate<br />
change on <strong>the</strong>ir environment and livelihoods, and to<br />
make recommendations for adaptation and mitigation.<br />
This communication strategy is a product <strong>of</strong> those<br />
workshops, and contains <strong>the</strong> actions and activities<br />
proposed by <strong>the</strong> stakeholders to specifically address<br />
<strong>the</strong> identified impacts. The results were validated at <strong>the</strong><br />
culminating workshop in July 2009 where priorities and<br />
strategies were also identified.<br />
being <strong>the</strong> first-priority target audience for awareness/<br />
engagement, action/implementation and funding<br />
activities.<br />
This document integrates <strong>the</strong> results <strong>of</strong> <strong>the</strong> three<br />
stakeholders' workshops and <strong>the</strong> validation workshop.<br />
The strategies were directly developed by stakeholders<br />
and identify climate change adaptation measures<br />
that can be easily integrated into municipal/provincial<br />
plans. These measures could also be implemented at<br />
<strong>the</strong> local/municipal scale using local funds. Securing<br />
o<strong>the</strong>r sources <strong>of</strong> funding—beyond <strong>the</strong> local level—was<br />
identified as <strong>the</strong> next step in adaptation fundraising.<br />
The development <strong>of</strong> a communications strategy is an<br />
important component <strong>of</strong> a climate change vulnerability<br />
assessment. The goal <strong>of</strong> this strategy is to assess<br />
how <strong>the</strong> outcomes <strong>of</strong> <strong>the</strong> vulnerability assessment<br />
will be adopted and mainstreamed to <strong>the</strong> appropriate<br />
audiences.<br />
This document includes recommendations for<br />
communicating basic information about climate<br />
change, and results <strong>of</strong> <strong>the</strong> vulnerability assessment, to<br />
communities in <strong>the</strong> <strong>Verde</strong> <strong>Island</strong> <strong>Passage</strong>. The strategy<br />
is based on output from stakeholders, drawn from a<br />
series <strong>of</strong> workshops held in Mindoro and Batangas in<br />
February and March <strong>of</strong> this year and validated at <strong>the</strong><br />
Vulnerability Assessment (VA) workshop in July.<br />
At <strong>the</strong> preliminary workshops, strategy objectives<br />
identified by participants revolved around three<br />
central <strong>the</strong>mes: awareness and engagement, action/<br />
implementation, and funding. The target audiences<br />
included were elected <strong>of</strong>ficials, civil society groups,<br />
students and law enforcers, among o<strong>the</strong>rs. The<br />
products used to address <strong>the</strong>se needs and reach<br />
<strong>the</strong> necessary audiences fell into four categories:<br />
multimedia, education/training programs, exposure/<br />
field trips, and legislation. The time frames <strong>of</strong> <strong>the</strong>se<br />
strategies generally did not exceed <strong>the</strong> political terms <strong>of</strong><br />
elected <strong>of</strong>ficials (1-3 years).<br />
During <strong>the</strong> VA workshop, stakeholders validated <strong>the</strong><br />
results <strong>of</strong> <strong>the</strong> initial workshops and proceeded to<br />
strategize and prioritize actions to be taken. For all<br />
three main objectives, a top-down approach was <strong>the</strong><br />
choice <strong>of</strong> <strong>the</strong> majority, with elected/appointed <strong>of</strong>ficials<br />
84
Introduction<br />
This paper consolidates and summarizes <strong>the</strong> results<br />
<strong>of</strong> stakeholder consultation workshops, which were<br />
part <strong>of</strong> Conservation International–<strong>Philippines</strong>’ project:<br />
“Vulnerability Assessment <strong>of</strong> Marine Biodiversity and<br />
related human well-being in <strong>the</strong> <strong>Verde</strong> <strong>Island</strong> <strong>Passage</strong><br />
(VIP) to climate change”. The first three workshops,<br />
held in February and early March <strong>of</strong> 2009, were aimed<br />
at formulating an outreach and communication strategy<br />
for <strong>the</strong> VIP region. Validation <strong>of</strong> output was <strong>the</strong>n done<br />
during <strong>the</strong> Vulnerability Assessment workshop, held<br />
in Batangas in July. Results <strong>of</strong> <strong>the</strong> prioritization and<br />
strategy-formulation sessions are also presented in this<br />
document.<br />
chapter 4 • outreach and communication strategy: introduction<br />
Vulnerability assessment workshop<br />
The validation <strong>of</strong> <strong>the</strong> draft communications strategy<br />
was done during Workshop 3 <strong>of</strong> <strong>the</strong> Vulnerability<br />
Assessment workshop. Participants were divided by<br />
province and <strong>the</strong>ir task was threefold:<br />
• Validate <strong>the</strong> draft strategy produced during three<br />
preliminary workshops.<br />
• Prioritize audiences and actions.<br />
• Formulate strategies to target <strong>the</strong> identified priority<br />
audiences and activities.<br />
About <strong>the</strong> workshops<br />
Preliminary workshops (February and March<br />
2009)<br />
Two-day consultation workshops were conducted by<br />
CI–<strong>Philippines</strong> in three locations: Oriental Mindoro on<br />
2-4 February (72 participants from 7 municipalities and<br />
1 city), Occidental Mindoro on 25-26 February (29<br />
participants from 4 municipalities), and Batangas on<br />
3-4 March (37 participants from 8 municipalities and 1<br />
city).<br />
During <strong>the</strong>se workshops, a perception survey was done<br />
and participating stakeholders revealed what <strong>the</strong>y knew<br />
about climate change.<br />
A 4-P design (Earle et al. 2006) was <strong>the</strong>n used for <strong>the</strong><br />
workshop. Participants were divided into groups based<br />
on <strong>the</strong>ir positions or functions. Each group was <strong>the</strong>n<br />
asked to:<br />
• Identify key problems <strong>of</strong> local governments<br />
regarding understanding climate change and<br />
its impacts on marine biodiversity and related<br />
human-well being and formulate objectives for a<br />
communications strategy based on <strong>the</strong> area’s needs<br />
and <strong>the</strong> problems identified.<br />
• dentify key audiences for <strong>the</strong> communications<br />
strategy. Specific actions that could be taken by<br />
each target audience were also identified as well<br />
as <strong>the</strong> possible incentives each could get for its<br />
involvement in such an endeavor.<br />
• Enumerate specific products to deliver <strong>the</strong><br />
messages related to <strong>the</strong> problem statement to<br />
reach target audiences.<br />
• Formulate practical plans <strong>of</strong> action to fulfill <strong>the</strong><br />
objectives identified at <strong>the</strong> beginning <strong>of</strong> <strong>the</strong><br />
workshop.<br />
85
climate change vulnerability assessment <strong>of</strong> <strong>the</strong> verde island passage, philippines<br />
Results<br />
Preliminary workshops<br />
Stakeholders drew up objectives for <strong>the</strong><br />
communications strategy, with most <strong>of</strong> <strong>the</strong> suggestions<br />
revolving around three central <strong>the</strong>mes: awareness/<br />
engagement, action/implementation, and funding.<br />
Their target audiences included, elected <strong>of</strong>ficials, civil<br />
society groups, students, law enforcers and o<strong>the</strong>rs. The<br />
products that <strong>the</strong>y chose to communicate with were<br />
various forms <strong>of</strong> media, education/training programs,<br />
exposure/field trips, and legislation. Political terms <strong>of</strong><br />
incumbent <strong>of</strong>ficials defined <strong>the</strong> timelines for most <strong>of</strong><br />
<strong>the</strong> proposed activities (1-3 years) and <strong>the</strong> suggested<br />
strategies did not move above <strong>the</strong> provincial level—in<br />
fact, most were proposed for implementation at <strong>the</strong><br />
municipal level.<br />
Table 63. Breakdown <strong>of</strong> participants <strong>of</strong> <strong>the</strong> preliminary workshops.<br />
Designation<br />
PENRO/PG-ENRO/MENRO<br />
MAO<br />
PPDO/MPDC<br />
SP / SB<br />
Mayors<br />
Fisheries/Aquatech<br />
Agritech<br />
Tourism<br />
O<strong>the</strong>r government <strong>of</strong>ficials<br />
NGOs<br />
FARMCs<br />
Percent <strong>of</strong> total<br />
13.27<br />
11.22<br />
19.39<br />
16.33<br />
2.04<br />
9.18<br />
2.04<br />
4.08<br />
8.16<br />
8.16<br />
6.12<br />
The full results <strong>of</strong> each preliminary workshop were outlined in earlier documents.<br />
The draft strategy drawn from <strong>the</strong> results, demonstrated<br />
<strong>the</strong> existence <strong>of</strong> a basic understanding <strong>of</strong> climate<br />
change, based mostly on its effects ra<strong>the</strong>r than<br />
understating <strong>the</strong> concepts. Many people stated that<br />
climate change was <strong>the</strong> result <strong>of</strong> human activities such<br />
as burning and pollution. However, o<strong>the</strong>rs identified it<br />
with changing/extreme wea<strong>the</strong>r patterns, sea level rise,<br />
scarcity <strong>of</strong> food and loss <strong>of</strong> freshwater. The fact that<br />
most stakeholders defined climate change in terms <strong>of</strong><br />
how it affected <strong>the</strong>m and <strong>the</strong>ir immediate environment,<br />
is important to determine a successful communications<br />
strategy.<br />
Draft plans drawn up by <strong>the</strong> stakeholders also<br />
demonstrated an awareness <strong>of</strong> identifying gaps or<br />
"needs". They identified <strong>the</strong> need to disseminate<br />
information on climate change and <strong>the</strong> need for funding<br />
for climate change projects as <strong>the</strong>ir most serious<br />
issues.<br />
Stakeholders’ realistic attitude towards <strong>the</strong> adoption<br />
<strong>of</strong> a communications strategy was reflected in <strong>the</strong><br />
timelines <strong>the</strong>y drew up for implementation, which<br />
generally stayed within <strong>the</strong> three year term <strong>of</strong> incumbent<br />
local <strong>of</strong>ficials. It is important to note that <strong>the</strong> participants<br />
in <strong>the</strong> stakeholders’ workshops were largely employees<br />
<strong>of</strong> <strong>the</strong> local government (Table 63). This group made<br />
up over 85% <strong>of</strong> <strong>the</strong> attendees <strong>of</strong> <strong>the</strong> preliminary<br />
workshops, so it should come as no surprise that<br />
timeline planning <strong>of</strong>ten depends on political election<br />
schedules.<br />
86
chapter 4 • outreach and communication strategy: results<br />
Vulnerability assessment workshop<br />
Natural and social scientists who attended <strong>the</strong><br />
Vulnerability Assessment (VA) workshop provided data<br />
and analyses <strong>of</strong> <strong>the</strong> vulnerability <strong>of</strong> <strong>the</strong> <strong>Verde</strong> <strong>Island</strong> to<br />
climate change. The main goals <strong>of</strong> <strong>the</strong> communications<br />
strategy are to use <strong>the</strong> results <strong>of</strong> <strong>the</strong> Vulnerability<br />
Assessment to:<br />
• mainstream priorities; and,<br />
• deliver climate change messages to key audiences<br />
For <strong>the</strong> validation and prioritization part <strong>of</strong> <strong>the</strong> workshop,<br />
results were as follows:<br />
Workshop 3—Part 1 and 2: Validation and Prioritization<br />
*items in italics were added by <strong>the</strong> stakeholders during <strong>the</strong> validation process<br />
Objective 1: awareness and engagement<br />
Priority<br />
Public/Target Or. Occ. Mar. and Or. Occ. Mar. and<br />
audience Min. Min. Bat. Rom. Product Min. Min. Bat. Rom. Implementers<br />
Elected <strong>of</strong>ficials and<br />
local government units<br />
1<br />
1<br />
1<br />
1<br />
• capacity building<br />
(seminars/dialogues)<br />
• production/distribution/<br />
display <strong>of</strong> IEC materials<br />
2<br />
1<br />
1<br />
2<br />
1<br />
2<br />
1<br />
2<br />
• Mayors<br />
• SB<br />
• Bishop, religious sector<br />
• DENR<br />
• DILG<br />
• Department <strong>of</strong> Education<br />
• MHO<br />
• MFARMC<br />
• MAO/MENRO<br />
• MPDO<br />
• Provincial - Municipal Information<br />
Office<br />
Civil Society Groups<br />
2<br />
4<br />
5<br />
5<br />
• information/education<br />
campaign<br />
• training and capacity<br />
building<br />
• multi-sectoral meetings<br />
on CC<br />
1<br />
3<br />
2<br />
1<br />
2<br />
1<br />
2<br />
2<br />
1<br />
• NGOs<br />
• Academia<br />
• Local media<br />
Farmers and fishermen<br />
General public<br />
4<br />
5<br />
2<br />
5<br />
2<br />
4<br />
2<br />
4<br />
• information/education<br />
campaign and advocacy<br />
• capacity building<br />
(forums and seminars)<br />
• regular FARMC<br />
meetings<br />
• pastoral letter or sermon<br />
• community outreach<br />
• meetings and<br />
fellowships<br />
• multimedia<br />
presentations<br />
1<br />
3<br />
2<br />
1<br />
3<br />
4<br />
2<br />
1<br />
2<br />
3<br />
2<br />
4<br />
1<br />
1<br />
2<br />
x<br />
1<br />
2<br />
• LGU<br />
• DA<br />
• NGOs<br />
• Religious groups<br />
Schools<br />
- principals and teachers<br />
- students<br />
3<br />
3<br />
3<br />
3<br />
• meetings and seminars<br />
• multimedia<br />
presentations<br />
• games<br />
• field trips<br />
• integration <strong>of</strong> CC in <strong>the</strong><br />
school curriculum<br />
1<br />
2<br />
5<br />
4<br />
3<br />
1<br />
3<br />
5<br />
4<br />
2<br />
1<br />
3<br />
5<br />
4<br />
2<br />
• NGOs<br />
• Department <strong>of</strong> Education<br />
• LGUs<br />
• DENR<br />
87
climate change vulnerability assessment <strong>of</strong> <strong>the</strong> verde island passage, philippines<br />
Objective 2: action and implementation<br />
Priority<br />
Public/Target Or. Occ. Mar. and Or. Occ. Mar. and Implementers and<br />
audience Min. Min. Bat. Rom. Product Min. Min. Bat. Rom. co-implementers<br />
General Public<br />
5<br />
1<br />
4<br />
4<br />
• law enforcement<br />
•<br />
1<br />
1<br />
1<br />
• LGUs<br />
• Bantay Dagat<br />
Schools<br />
4<br />
2<br />
5<br />
5<br />
• mangrove rehabilitation<br />
projects<br />
•<br />
1<br />
1<br />
1<br />
• LGUs<br />
• Rural Health Units<br />
Business sector<br />
2<br />
3<br />
1<br />
7<br />
• regulations concerning<br />
private sectors<br />
• responsibilities to <strong>the</strong><br />
community<br />
• come up with incentive<br />
schemes for companies<br />
with positive cc-related<br />
operations<br />
• waste management<br />
programs<br />
• provide environmental<br />
friendly products for<br />
sale<br />
1<br />
3<br />
2<br />
1<br />
3<br />
2<br />
4<br />
• LGUs<br />
General Public<br />
3<br />
6<br />
• conduct capacity<br />
building activities<br />
• barangay level planning<br />
activities<br />
• provide environmental<br />
friendly products for<br />
sale<br />
1<br />
2<br />
1<br />
2<br />
3<br />
2<br />
1<br />
• LGU<br />
• Business Sector<br />
• Chamber <strong>of</strong> Commerce<br />
• NGOs (ex. CI and Mindoro<br />
Biodiversity Foundation)<br />
• DENR<br />
• National Solid Waste<br />
Management<br />
Community<br />
3<br />
3<br />
• organize coastal<br />
barangay climate<br />
change programs<br />
• partnership with ngos,<br />
private sectors<br />
• coastal clean up<br />
1<br />
2<br />
3<br />
1<br />
2<br />
3<br />
2<br />
1<br />
3<br />
• LGU<br />
Elected Officials<br />
1<br />
3<br />
1<br />
• approval/implementation<br />
<strong>of</strong> plans (i.e., disaster<br />
management plan)<br />
• awarding <strong>of</strong> incentives<br />
to performing barangays<br />
• enforcement <strong>of</strong> laws<br />
• organization <strong>of</strong> a task<br />
force on cc<br />
• issuance <strong>of</strong> executive<br />
orders, ordinances, etc<br />
• monitoring and<br />
evaluation <strong>of</strong> plans<br />
implemented<br />
• environmental scanning<br />
• integration <strong>of</strong> climate<br />
change into <strong>the</strong> tourism<br />
program<br />
• vulnerability assessment<br />
3<br />
6<br />
5<br />
2<br />
1<br />
4<br />
5<br />
9<br />
6<br />
1<br />
4<br />
8<br />
2<br />
7<br />
3<br />
5<br />
9<br />
7<br />
2<br />
1<br />
8<br />
3<br />
6<br />
4<br />
5<br />
9<br />
7<br />
1<br />
6<br />
8<br />
3<br />
4<br />
2<br />
• MAO<br />
• MENRO<br />
• MG<br />
• LGU<br />
• DILG<br />
• LGUPGOM<br />
• MPDO/ PPDO-RSED<br />
• MG-Task Force<br />
• Mindoro Biodiversity Foundation<br />
• CI–<strong>Philippines</strong><br />
• Provincial governments<br />
Local Government Units<br />
2<br />
2<br />
• incentive schemes for<br />
positive practices in cc<br />
adaptation<br />
• amend laws to<br />
accommodate climate<br />
change adaptation and<br />
mitigation<br />
• declare climate<br />
awareness day<br />
• enactment <strong>of</strong><br />
ordinances/ resolutions<br />
regarding climate<br />
change<br />
• enforcement <strong>of</strong><br />
ordinances and<br />
approved easement<br />
areas<br />
• zoning/rezoning<br />
6<br />
1<br />
5<br />
3<br />
4<br />
2<br />
6<br />
4<br />
5<br />
1<br />
2<br />
3<br />
• Sanggunian<br />
• National agencies<br />
• DENR<br />
• NGOs<br />
• Municipal engineeri<br />
• Congressman<br />
• LCE<br />
• MENRO<br />
• PNP<br />
• Coast Guard/<br />
• Bantay Dagat<br />
88
chapter 4 • outreach and communication strategy: results<br />
Objective 2: action and implementation (continued)<br />
Priority<br />
Public/Target Or. Occ. Mar. and Or. Occ. Mar. and Implementers and<br />
audience Min. Min. Bat. Rom. Product Min. Min. Bat. Rom. co-implementers<br />
Military<br />
6<br />
7<br />
8<br />
• law enforcement<br />
1<br />
• LGUs<br />
- NGOs and people’s<br />
organizations<br />
- National line agencies<br />
2<br />
8 6 • assist in <strong>the</strong><br />
1<br />
dissemination <strong>of</strong><br />
information on climate<br />
change<br />
3<br />
• provide supplies and<br />
materials<br />
2<br />
• technical assistance<br />
2<br />
3<br />
1<br />
2<br />
3<br />
1<br />
• LGUs<br />
Objective 3: funding<br />
Priority<br />
Public/Target Or. Occ. Mar. and Or. Occ. Mar. and<br />
audience Min. Min. Bat. Rom. Product Min. Min. Bat. Rom. Implementers<br />
LGUs<br />
n/a<br />
n/a<br />
n/a<br />
n/a<br />
• Ordinances to provide<br />
government funding for<br />
climate change projects<br />
1<br />
1<br />
1<br />
1<br />
• Policy makers<br />
n/a<br />
n/a<br />
n/a<br />
n/a<br />
• Partnerships with<br />
NGOs and <strong>the</strong> private<br />
sector<br />
2<br />
3<br />
3<br />
2<br />
• Community<br />
n/a<br />
n/a<br />
n/a<br />
n/a<br />
• provide supplies and<br />
materials<br />
• provide funding<br />
4<br />
2<br />
5<br />
2<br />
3<br />
4<br />
• National Line Agencies<br />
n/a<br />
n/a<br />
n/a<br />
n/a<br />
• provide help with<br />
funding<br />
5<br />
4<br />
5<br />
• NGOs<br />
89
climate change vulnerability assessment <strong>of</strong> <strong>the</strong> verde island passage, philippines<br />
Workshop 3—Part 3: Strategy Formulation<br />
Oriental Mindoro<br />
Awareness and engagement<br />
Priority public: Elected and appointed <strong>of</strong>ficials<br />
Priority product: Production and distribution <strong>of</strong> IEC materials<br />
Strategy:<br />
Preparation and distribution <strong>of</strong> IEC materials (flyers, comics, media blitz) by <strong>the</strong> local<br />
government unit from August to December<br />
Action and implementation<br />
Priority Public: Elected <strong>of</strong>ficials<br />
Priority Product: Organization <strong>of</strong> a task force on climate change<br />
Strategy:<br />
Creation <strong>of</strong> provincial/municipal task force thru an EO 774 by <strong>the</strong> LCE August<br />
Funding<br />
Priority public: Local government units<br />
Priority product: Ordinances to provide government funding for climate change projects<br />
Strategy:<br />
Formulation and adoption <strong>of</strong> investment plan by <strong>the</strong> Task Force by August to December<br />
Occidental Mindoro<br />
Awareness and engagement<br />
Priority public: Elected <strong>of</strong>ficials and Local government units<br />
Priority products: Capacity building and IEC<br />
Strategy:<br />
Local government unit climate change task force to ga<strong>the</strong>r info materials from expert<br />
organizations/agencies. Reproduce materials appropriate to <strong>the</strong> area <strong>of</strong> jurisdiction and<br />
invite resource persons<br />
Action and implementation<br />
Priority public: General public<br />
Priority product: Law enforcement<br />
Strategy:<br />
Request experts to deliver lectures<br />
Funding<br />
Priority public: Local government units<br />
Priority product: Ordinances to provide government funding for projects<br />
Strategy:<br />
Formulation and adoption <strong>of</strong> investment plan by <strong>the</strong> task force by August to December<br />
Batangas<br />
Awareness and engagement<br />
Priority public: Elected <strong>of</strong>ficials and local government units<br />
Priority products: Capacity building<br />
Strategy:<br />
1. Conduct one-on-one separate briefing for <strong>the</strong> Mayor and <strong>the</strong> members <strong>of</strong> <strong>the</strong> SB<br />
2. Organized joint meeting with executive and legislative branch<br />
3. Preparation <strong>of</strong> IEC materials, e.g., flyers, primer and electronic presentations<br />
Action and Implementation<br />
Priority public: Business sector<br />
Priority product: Regulations concerning private sector’s responsibilities to <strong>the</strong> community<br />
Strategy:<br />
Make sure that <strong>the</strong> corporate social responsibility <strong>of</strong> all <strong>the</strong> business sectors be part <strong>of</strong><br />
<strong>the</strong> process in coming up with <strong>the</strong> climate change awareness program, through:<br />
a. capacity building<br />
b. distribution <strong>of</strong> IEC materials<br />
c. provision <strong>of</strong> incentives<br />
Funding<br />
Priority public: Local government units<br />
Priority product: Ordinances to provide government funding for climate change projects<br />
Strategy:<br />
1. formulation and passing <strong>of</strong> ordinances concerning collection <strong>of</strong> fees<br />
2. lobbying for a percentage out <strong>of</strong> <strong>the</strong> collection from fines and penalties to be<br />
allotted or allocated to climate change programs and projects<br />
3. build transparent relationship with business sector and a percentage from <strong>the</strong> CSR<br />
fund be allotted to climate change programs and projects<br />
90
chapter 4 • outreach and communication strategy: results<br />
Marinduque and Romblon<br />
Awareness and Engagement<br />
Priority public: Elected <strong>of</strong>ficials and Local government units<br />
Priority products: Capacity building<br />
Strategy:<br />
1. coordination through <strong>the</strong> SB<br />
2. include in <strong>the</strong> municipal SB agenda<br />
3. conduct <strong>the</strong> actual capacity building<br />
Action and Implementation<br />
Priority public: Elected <strong>of</strong>ficials<br />
Priority product: Organization <strong>of</strong> a task force on climate change<br />
Strategy:<br />
1. identification <strong>of</strong> climate change members<br />
2. organizational meeting<br />
3. creation <strong>of</strong> climate change task force through ordinance<br />
Funding<br />
Priority public: Local government units<br />
Priority product: Ordinances to provide government funding for climate change projects<br />
Strategy:<br />
1. coordination with <strong>the</strong> SB<br />
2. draft an ordinance<br />
3. deliberation<br />
4. public hearing<br />
As seen above, over 85% <strong>of</strong> <strong>the</strong> people involved in<br />
<strong>the</strong> formulation <strong>of</strong> <strong>the</strong> draft strategy, work for <strong>the</strong> local<br />
government units. This group also made up <strong>the</strong> bulk <strong>of</strong><br />
<strong>the</strong> participants <strong>of</strong> <strong>the</strong> VA workshop. Therefore, this may<br />
explain why <strong>the</strong> elected <strong>of</strong>ficials were identified as <strong>the</strong><br />
priority target audience for all three objectives <strong>of</strong> <strong>the</strong><br />
climate change communications strategy.<br />
The prioritization <strong>of</strong> local <strong>of</strong>ficials for <strong>the</strong><br />
communications strategy suggests that <strong>the</strong> majority<br />
<strong>of</strong> <strong>the</strong> stakeholders believe <strong>the</strong>se people have <strong>the</strong><br />
greatest capacity to impact (directly or indirectly)<br />
climate change perceptions in local communities. The<br />
results <strong>of</strong> <strong>the</strong> validation also suggest that <strong>the</strong> main<br />
focus <strong>of</strong> <strong>the</strong> strategy should be at <strong>the</strong> level <strong>of</strong> <strong>the</strong><br />
municipal governments since <strong>the</strong> national government<br />
is generally not active in implementation, even though<br />
all management falls under national laws and policies.<br />
This reflects <strong>the</strong> fact that <strong>the</strong> Local Government<br />
Code <strong>of</strong> 1991 transferred many environment-related<br />
responsibilities <strong>of</strong> <strong>the</strong> national government to <strong>the</strong> local<br />
government units.<br />
with NGOs and <strong>the</strong> business sector closely followed<br />
in importance. It appears that environmental projects<br />
are not prioritized for funding by local government units<br />
because <strong>the</strong>ir benefits are difficult to quantify. Local<br />
<strong>of</strong>ficials are also concerned that projects <strong>the</strong>y fund will<br />
affect <strong>the</strong> number <strong>of</strong> votes that <strong>the</strong>y receive at <strong>the</strong> next<br />
election. This makes <strong>the</strong>m biased towards projects that<br />
have immediate, readily visible local benefits, such as<br />
health programs and infrastructure.<br />
The strategies identified, addressed capacity building,<br />
behavior change and taking action. The product <strong>of</strong><br />
greatest importance, was <strong>the</strong> municipal ordinance,<br />
which would <strong>the</strong>n make climate change activities a legal<br />
mandate. There is also a clear top-down trend in <strong>the</strong><br />
priorities and strategies identified in <strong>the</strong> workshops,<br />
with government <strong>of</strong>ficials as priority targets and <strong>the</strong><br />
general public taking second priority.<br />
Second priority was given to fishermen and farmers<br />
for awareness building, likely due to <strong>the</strong> fact that <strong>the</strong>y<br />
are <strong>the</strong> people most directly impacted by <strong>the</strong> effects <strong>of</strong><br />
climate change. The business sector was considered an<br />
important target for <strong>the</strong> action/implementation objective.<br />
This reflects a common belief that government initiatives<br />
are not sufficient enough to complete environmental<br />
projects. This same attitude is apparent in <strong>the</strong> results<br />
for <strong>the</strong> third objective, which is to find funding for<br />
climate change projects. Although funding from within<br />
<strong>the</strong> local government units was prioritized, partnerships<br />
91
climate change vulnerability assessment <strong>of</strong> <strong>the</strong> verde island passage, philippines<br />
Recommendations<br />
Certain questions regarding prioritization were<br />
answered in <strong>the</strong> workshop, but fur<strong>the</strong>r thought on <strong>the</strong><br />
following points is recommended:<br />
1. The need to be more specific.<br />
The natural and social scientists present at <strong>the</strong><br />
Vulnerability Assessment (VA) workshop provided<br />
information about climate change effects in <strong>the</strong> area,<br />
however <strong>the</strong>re is a need for site-specific information.<br />
Not all parts <strong>of</strong> <strong>the</strong> VIP will be affected in <strong>the</strong> same<br />
way and so <strong>the</strong> information to be disseminated can be<br />
tailored for each area as needed with greater specificity.<br />
2. Should <strong>the</strong> message to be delivered be positive<br />
or negative<br />
One thing to be considered will be whe<strong>the</strong>r to use<br />
positive messages or "scare" tactics in <strong>the</strong> strategy.<br />
The results <strong>of</strong> <strong>the</strong> workshop established quite clearly<br />
that what matters most to stakeholders in this region<br />
is how climate change will specifically affect <strong>the</strong>m at<br />
<strong>the</strong> present time. Next, we need to determine how<br />
stakeholders perceive climate change, and how<br />
<strong>the</strong>se perceptions may need to be changed to impact<br />
attitudes and behavior. Then a decision will have to<br />
be made between encouraging, coaxing, scaring<br />
or perhaps even enforcing <strong>the</strong> issue (i.e., imposing<br />
penalties) to effect those changes.<br />
3. Do we use/improve material that already exists<br />
or develop new materials<br />
Discussions during and between <strong>the</strong> workshops<br />
suggest that most <strong>of</strong> <strong>the</strong> stakeholders believe adapting<br />
existing materials (i.e., translating existing materials on<br />
climate change into <strong>the</strong>ir local dialects) is preferable<br />
to creating new material. This is mostly because <strong>of</strong><br />
funding constraints. It is also interesting to note that,<br />
although coming up with new laws and ordinances is<br />
prioritized in <strong>the</strong> strategy, some people actually believe<br />
it will be easier to find a way to integrate activities into<br />
existing plans and priority projects (i.e., solid waste<br />
management, disaster preparedness) than to come up<br />
with and implement new laws. The second part <strong>of</strong> <strong>the</strong><br />
VA workshop has already initialized steps to integrate<br />
climate change into local government unit plans, and so<br />
<strong>the</strong> challenge will be to carry on from <strong>the</strong>re.<br />
be taken with caution. O<strong>the</strong>r stakeholders (nongovernmental)<br />
may have a different point <strong>of</strong> view <strong>of</strong> <strong>the</strong><br />
problem and it is possible that a centralized approach<br />
by <strong>the</strong> local government will be one sided and bring up<br />
conflicts <strong>of</strong> interest. Climate change has effects that<br />
go beyond <strong>the</strong> municipal or even provincial level and it<br />
may be necessary to have outside help to understand<br />
how local activities can fit into <strong>the</strong> 'bigger picture'. This<br />
is already being attempted in <strong>the</strong> VIP, with municipal<br />
and provincial plans being integrated into <strong>the</strong> <strong>Verde</strong><br />
<strong>Passage</strong> framework plan.<br />
5. The need for evaluation and follow up<br />
It is inevitable that some aspects <strong>of</strong> <strong>the</strong> strategy will<br />
work better than o<strong>the</strong>rs or that some actions will work<br />
in certain areas and not elsewhere. Just as ecosystems<br />
can vary between locations and <strong>the</strong> effects <strong>of</strong> climate<br />
change are felt differently, <strong>the</strong> communications strategy<br />
may need to be flexible with regards to both content<br />
and implementation. Available funding may play some<br />
part in determining which areas, and people receive<br />
resources to conduct follow up measures. Regardless<br />
<strong>of</strong> approach and jurisdiction, <strong>the</strong>re is a need for some<br />
provisions to ensure follow up <strong>of</strong> <strong>the</strong> communications<br />
process to guarantee that <strong>the</strong> proper messages reach<br />
<strong>the</strong> appropriate audiences. In addition, certain criteria<br />
will be drawn up to quantify changes in behavior or to<br />
determine <strong>the</strong> overall effectiveness <strong>of</strong> <strong>the</strong> strategy. The<br />
strategy should <strong>the</strong>n be modified and adapted where it<br />
is not perceived to be effective.<br />
4. Who will be responsible for implementing<br />
actions<br />
Again, as <strong>the</strong> majority <strong>of</strong> <strong>the</strong> people consulted work<br />
for <strong>the</strong> local government units, it is not strange<br />
that <strong>the</strong>y recommend a top-down approach for <strong>the</strong><br />
communications strategy. Some recommended <strong>the</strong><br />
creation <strong>of</strong> a task force to concentrate on <strong>the</strong> problem.<br />
This kind <strong>of</strong> centralized approach should, however,<br />
92
References<br />
chapter 4 • outreach and communication strategy: references<br />
Earle S, Margit A, MacDowell M, and D Lerda (Eds.), 2006. Designing a<br />
communications strategy: <strong>the</strong> 4-P workshop. Global communications for<br />
Conservation International. 112 pp.<br />
93
Conservation International (CI)<br />
Mission<br />
Building upon a strong foundation <strong>of</strong> science,<br />
partnership and field demonstration, CI<br />
empowers societies to responsibly and<br />
sustainably care for nature, our global<br />
biodiversity, for <strong>the</strong> well-being <strong>of</strong> humanity.<br />
Vision<br />
We imagine a healthy prosperous world in<br />
which societies are forever committed to caring<br />
for and valuing nature, our global biodiversity,<br />
for <strong>the</strong> long-term benefit <strong>of</strong> people and all life<br />
on Earth.