of the Verde Island Passage, Philippines - weADAPT
of the Verde Island Passage, Philippines - weADAPT
of the Verde Island Passage, Philippines - weADAPT

Create successful ePaper yourself
Turn your PDF publications into a flip-book with our unique Google optimized e-Paper software.
chapter 1 • vulnerability assessment <strong>of</strong> marine ecosystems and fisheries to climate change: exposure<br />
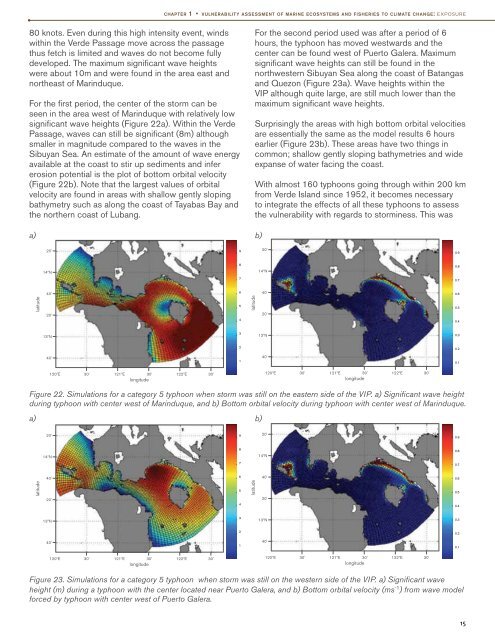
80 knots. Even during this high intensity event, winds<br />
within <strong>the</strong> <strong>Verde</strong> <strong>Passage</strong> move across <strong>the</strong> passage<br />
thus fetch is limited and waves do not become fully<br />
developed. The maximum significant wave heights<br />
were about 10m and were found in <strong>the</strong> area east and<br />
nor<strong>the</strong>ast <strong>of</strong> Marinduque.<br />
For <strong>the</strong> first period, <strong>the</strong> center <strong>of</strong> <strong>the</strong> storm can be<br />
seen in <strong>the</strong> area west <strong>of</strong> Marinduque with relatively low<br />
significant wave heights (Figure 22a). Within <strong>the</strong> <strong>Verde</strong><br />
<strong>Passage</strong>, waves can still be significant (8m) although<br />
smaller in magnitude compared to <strong>the</strong> waves in <strong>the</strong><br />
Sibuyan Sea. An estimate <strong>of</strong> <strong>the</strong> amount <strong>of</strong> wave energy<br />
available at <strong>the</strong> coast to stir up sediments and infer<br />
erosion potential is <strong>the</strong> plot <strong>of</strong> bottom orbital velocity<br />
(Figure 22b). Note that <strong>the</strong> largest values <strong>of</strong> orbital<br />
velocity are found in areas with shallow gently sloping<br />
bathymetry such as along <strong>the</strong> coast <strong>of</strong> Tayabas Bay and<br />
<strong>the</strong> nor<strong>the</strong>rn coast <strong>of</strong> Lubang.<br />
For <strong>the</strong> second period used was after a period <strong>of</strong> 6<br />
hours, <strong>the</strong> typhoon has moved westwards and <strong>the</strong><br />
center can be found west <strong>of</strong> Puerto Galera. Maximum<br />
significant wave heights can still be found in <strong>the</strong><br />
northwestern Sibuyan Sea along <strong>the</strong> coast <strong>of</strong> Batangas<br />
and Quezon (Figure 23a). Wave heights within <strong>the</strong><br />
VIP although quite large, are still much lower than <strong>the</strong><br />
maximum significant wave heights.<br />
Surprisingly <strong>the</strong> areas with high bottom orbital velocities<br />
are essentially <strong>the</strong> same as <strong>the</strong> model results 6 hours<br />
earlier (Figure 23b). These areas have two things in<br />
common; shallow gently sloping bathymetries and wide<br />
expanse <strong>of</strong> water facing <strong>the</strong> coast.<br />
With almost 160 typhoons going through within 200 km<br />
from <strong>Verde</strong> <strong>Island</strong> since 1952, it becomes necessary<br />
to integrate <strong>the</strong> effects <strong>of</strong> all <strong>the</strong>se typhoons to assess<br />
<strong>the</strong> vulnerability with regards to storminess. This was<br />
a) b)<br />
20'<br />
9<br />
20'<br />
0.9<br />
14ºN<br />
8<br />
14ºN<br />
0.8<br />
7<br />
0.7<br />
40'<br />
6<br />
40'<br />
0.6<br />
latitude<br />
20'<br />
5<br />
4<br />
latitude<br />
20'<br />
0.5<br />
0.4<br />
13ºN<br />
3<br />
13ºN<br />
0.3<br />
2<br />
0.2<br />
40'<br />
1<br />
40'<br />
0.1<br />
120ºE 30' 121ºE 30' 122ºE 30'<br />
longitude<br />
120ºE 30' 121ºE 30' 122ºE 30'<br />
longitude<br />
Figure 22. Simulations for a category 5 typhoon when storm was still on <strong>the</strong> eastern side <strong>of</strong> <strong>the</strong> VIP. a) Significant wave height<br />
during typhoon with center west <strong>of</strong> Marinduque, and b) Bottom orbital velocity during typhoon with center west <strong>of</strong> Marinduque.<br />
a) b)<br />
20'<br />
9<br />
20'<br />
0.9<br />
14ºN<br />
8<br />
14ºN<br />
0.8<br />
7<br />
0.7<br />
40'<br />
6<br />
40'<br />
0.6<br />
latitude<br />
20'<br />
5<br />
4<br />
latitude<br />
20'<br />
0.5<br />
0.4<br />
13ºN<br />
3<br />
13ºN<br />
0.3<br />
2<br />
0.2<br />
40'<br />
1<br />
40'<br />
0.1<br />
120ºE 30' 121ºE 30' 122ºE 30'<br />
longitude<br />
120ºE 30' 121ºE 30' 122ºE 30'<br />
longitude<br />
Figure 23. Simulations for a category 5 typhoon when storm was still on <strong>the</strong> western side <strong>of</strong> <strong>the</strong> VIP. a) Significant wave<br />
height (m) during a typhoon with <strong>the</strong> center located near Puerto Galera, and b) Bottom orbital velocity (ms -1 ) from wave model<br />
forced by typhoon with center west <strong>of</strong> Puerto Galera.<br />
15