of the Verde Island Passage, Philippines - weADAPT
of the Verde Island Passage, Philippines - weADAPT
of the Verde Island Passage, Philippines - weADAPT

You also want an ePaper? Increase the reach of your titles
YUMPU automatically turns print PDFs into web optimized ePapers that Google loves.
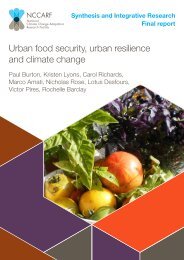
climate change vulnerability assessment <strong>of</strong> <strong>the</strong> verde island passage, philippines<br />
Hazards<br />
Among <strong>the</strong> components <strong>of</strong> climate change that<br />
may affect marine biodiversity include temperature,<br />
storminess, precipitation, sea-level rise, air-sea CO 2<br />
concentration, changes in ocean circulation patterns,<br />
health <strong>of</strong> functionally linked neighboring ecosystems, as<br />
well as, human responses to climate change (Gilman<br />
et al. 2008). Knowledge <strong>of</strong> <strong>the</strong> extent or severities<br />
<strong>of</strong> vulnerability <strong>of</strong> coastal areas to <strong>the</strong>se threats are<br />
needed in <strong>the</strong> formulation <strong>of</strong> mitigation and adaptation<br />
measures.<br />
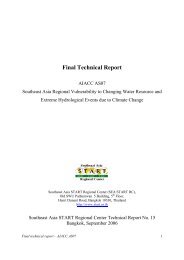
Increase in ocean temperature<br />
Philippine-wide sea surface temperature (SST) has<br />
experienced an average increase <strong>of</strong> about 0.025°C/<br />
year. However, <strong>the</strong> increase has not been spatially<br />
homogenous with areas in <strong>the</strong> nor<strong>the</strong>rn tip <strong>of</strong> Luzon and<br />
eastern Visayas increasing <strong>the</strong> fastest while <strong>the</strong> lowest<br />
increase is found in western Mindanao (Figure 5).<br />
latitude<br />
21ºN<br />
18ºN<br />
15ºN<br />
12ºN<br />
9ºN<br />
6ºN<br />
0.035<br />
0.03<br />
0.025<br />
0.02<br />
0.015<br />
14ºN<br />
13ºN<br />
12ºN<br />
120ºE 121ºE 122ºE 123ºE<br />
1985-2005 Trends (˚C/decade)<br />
0<br />
0.05 0.1 0.15 0.2 0.25 0.3 0.35 0.4<br />
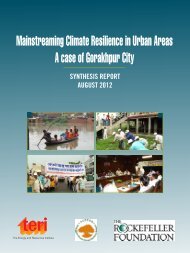
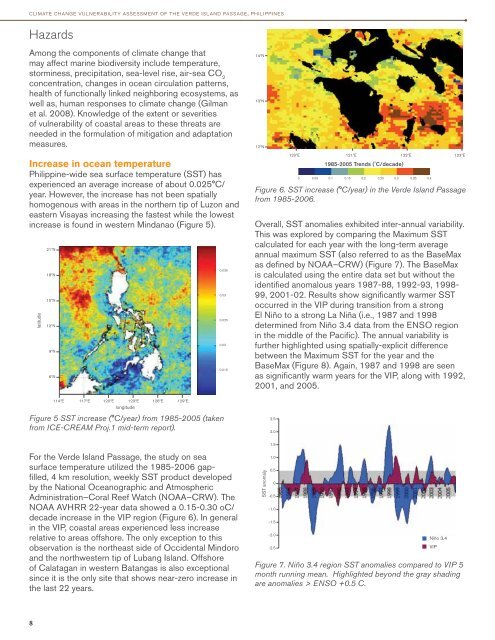
Figure 6. SST increase (°C/year) in <strong>the</strong> <strong>Verde</strong> <strong>Island</strong> <strong>Passage</strong><br />
from 1985-2006.<br />
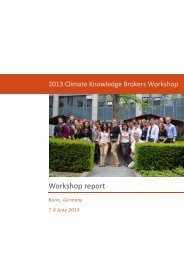
Overall, SST anomalies exhibited inter-annual variability.<br />
This was explored by comparing <strong>the</strong> Maximum SST<br />
calculated for each year with <strong>the</strong> long-term average<br />
annual maximum SST (also referred to as <strong>the</strong> BaseMax<br />
as defined by NOAA–CRW) (Figure 7). The BaseMax<br />
is calculated using <strong>the</strong> entire data set but without <strong>the</strong><br />
identified anomalous years 1987-88, 1992-93, 1998-<br />
99, 2001-02. Results show significantly warmer SST<br />
occurred in <strong>the</strong> VIP during transition from a strong<br />
El Niño to a strong La Niña (i.e., 1987 and 1998<br />
determined from Niño 3.4 data from <strong>the</strong> ENSO region<br />
in <strong>the</strong> middle <strong>of</strong> <strong>the</strong> Pacific). The annual variability is<br />
fur<strong>the</strong>r highlighted using spatially-explicit difference<br />
between <strong>the</strong> Maximum SST for <strong>the</strong> year and <strong>the</strong><br />
BaseMax (Figure 8). Again, 1987 and 1998 are seen<br />
as significantly warm years for <strong>the</strong> VIP, along with 1992,<br />
2001, and 2005.<br />
114ºE 117ºE 120ºE 123ºE 126ºE 129ºE<br />
longitude<br />
Figure 5 SST increase (°C/year) from 1985-2005 (taken<br />
from ICE-CREAM Proj.1 mid-term report).<br />
2.5<br />
2.0<br />
For <strong>the</strong> <strong>Verde</strong> <strong>Island</strong> <strong>Passage</strong>, <strong>the</strong> study on sea<br />
surface temperature utilized <strong>the</strong> 1985-2006 gapfilled,<br />
4 km resolution, weekly SST product developed<br />
by <strong>the</strong> National Oceanographic and Atmospheric<br />
Administration–Coral Reef Watch (NOAA–CRW). The<br />
NOAA AVHRR 22-year data showed a 0.15-0.30 oC/<br />
decade increase in <strong>the</strong> VIP region (Figure 6). In general<br />
in <strong>the</strong> VIP, coastal areas experienced less increase<br />
relative to areas <strong>of</strong>fshore. The only exception to this<br />
observation is <strong>the</strong> nor<strong>the</strong>ast side <strong>of</strong> Occidental Mindoro<br />
and <strong>the</strong> northwestern tip <strong>of</strong> Lubang <strong>Island</strong>. Offshore<br />
<strong>of</strong> Calatagan in western Batangas is also exceptional<br />
since it is <strong>the</strong> only site that shows near-zero increase in<br />
<strong>the</strong> last 22 years.<br />
SST anomaly<br />
1.5<br />
1.0<br />
0.5<br />
0<br />
-0.5<br />
-1.0<br />
-1.5<br />
-2.0<br />
-2.5<br />
Niño 3.4<br />
VIP<br />
Figure 7. Niño 3.4 region SST anomalies compared to VIP 5<br />
month running mean. Highlighted beyond <strong>the</strong> gray shading<br />
are anomalies > ENSO +0.5 C.<br />
8