of the Verde Island Passage, Philippines - weADAPT
of the Verde Island Passage, Philippines - weADAPT
of the Verde Island Passage, Philippines - weADAPT

Create successful ePaper yourself
Turn your PDF publications into a flip-book with our unique Google optimized e-Paper software.
chapter 1 • vulnerability assessment <strong>of</strong> marine ecosystems and fisheries to climate change: sensitivity<br />
curve was used since it is <strong>the</strong> only published account<br />
available for <strong>the</strong> <strong>Philippines</strong>. However, <strong>the</strong> estimates<br />
computed from <strong>the</strong>se are considered conservative<br />
because <strong>the</strong> Veron and Fenner’s curve is based<br />
on beta/between-reef diversity while <strong>the</strong> current<br />
application is seeks to estimate changes in alpha/<br />
within-reef diversity. The latter is typically much higher<br />
locally.<br />
Coral diversity loss due to sea surface temperature<br />
increase was estimated by obtaining <strong>the</strong> percentage <strong>of</strong><br />
coral genera that will be lost by removing <strong>the</strong> <strong>the</strong>rmally<br />
sensitive coral genera listed in Pratchett et al. (2008)<br />
(Table 8). Lower range estimates were obtained by<br />
removing <strong>the</strong> top 10 most vulnerable genera from <strong>the</strong><br />
total genera present per municipality. Whereas, higher<br />
range estimates were calculated by removing all <strong>the</strong><br />
vulnerable coral genera based on <strong>the</strong> list to <strong>the</strong> total<br />
genera present in each municipality. This decision is<br />
arbitrary since, again, no dose-response curve for coral<br />
communities and bleaching is available and thus we<br />
based <strong>the</strong> cut-<strong>of</strong>f on observations <strong>of</strong> vulnerable taxa<br />
made in western Batangas during <strong>the</strong> 1998 bleaching<br />
event, apparently <strong>the</strong> worst one for <strong>the</strong> VIP (Arceo et<br />
al. 2001). The estimates based on projected cover<br />
loss and <strong>the</strong> species-area curve served as <strong>the</strong> lower<br />
range estimates <strong>of</strong> diversity loss, whereas <strong>the</strong> direct<br />
vulnerabilities served as <strong>the</strong> higher range estimates.<br />
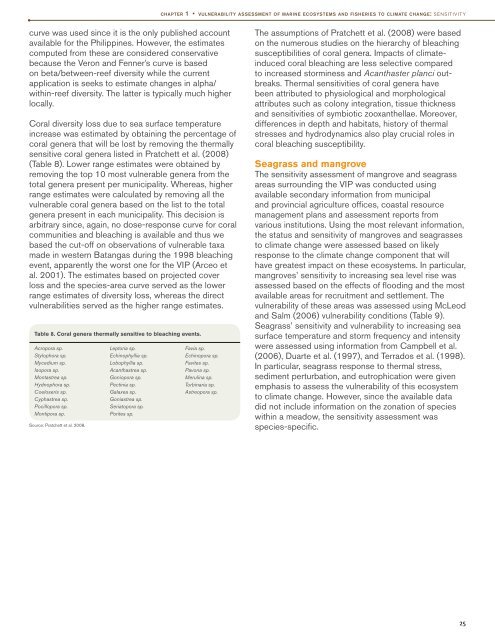
Table 8. Coral genera <strong>the</strong>rmally sensitive to bleaching events.<br />
Acropora sp.<br />
Stylophora sp.<br />
Mycedium sp.<br />
Isopora sp.<br />
Montastrea sp.<br />
Hydnophora sp.<br />
Coeloseris sp.<br />
Cyphastrea sp.<br />
Pocillopora sp.<br />
Montipora sp.<br />
Source: Pratchett et al. 2008.<br />
Leptoria sp.<br />
Echinophyllia sp.<br />
Lobophyllia sp.<br />
Acanthastrea sp.<br />
Goniopora sp.<br />
Pectinia sp.<br />
Galaxea sp.<br />
Goniastrea sp.<br />
Seriatopora sp.<br />
Porites sp.<br />
Favia sp.<br />
Echinopora sp.<br />
Favites sp.<br />
Pavona sp.<br />
Merulina sp.<br />
Turbinaria sp.<br />
Astreopora sp.<br />
The assumptions <strong>of</strong> Pratchett et al. (2008) were based<br />
on <strong>the</strong> numerous studies on <strong>the</strong> hierarchy <strong>of</strong> bleaching<br />
susceptibilities <strong>of</strong> coral genera. Impacts <strong>of</strong> climateinduced<br />
coral bleaching are less selective compared<br />
to increased storminess and Acanthaster planci outbreaks.<br />
Thermal sensitivities <strong>of</strong> coral genera have<br />
been attributed to physiological and morphological<br />
attributes such as colony integration, tissue thickness<br />
and sensitivities <strong>of</strong> symbiotic zooxan<strong>the</strong>llae. Moreover,<br />
differences in depth and habitats, history <strong>of</strong> <strong>the</strong>rmal<br />
stresses and hydrodynamics also play crucial roles in<br />
coral bleaching susceptibility.<br />
Seagrass and mangrove<br />
The sensitivity assessment <strong>of</strong> mangrove and seagrass<br />
areas surrounding <strong>the</strong> VIP was conducted using<br />
available secondary information from municipal<br />
and provincial agriculture <strong>of</strong>fices, coastal resource<br />
management plans and assessment reports from<br />
various institutions. Using <strong>the</strong> most relevant information,<br />
<strong>the</strong> status and sensitivity <strong>of</strong> mangroves and seagrasses<br />
to climate change were assessed based on likely<br />
response to <strong>the</strong> climate change component that will<br />
have greatest impact on <strong>the</strong>se ecosystems. In particular,<br />
mangroves’ sensitivity to increasing sea level rise was<br />
assessed based on <strong>the</strong> effects <strong>of</strong> flooding and <strong>the</strong> most<br />
available areas for recruitment and settlement. The<br />
vulnerability <strong>of</strong> <strong>the</strong>se areas was assessed using McLeod<br />
and Salm (2006) vulnerability conditions (Table 9).<br />
Seagrass’ sensitivity and vulnerability to increasing sea<br />
surface temperature and storm frequency and intensity<br />
were assessed using information from Campbell et al.<br />
(2006), Duarte et al. (1997), and Terrados et al. (1998).<br />
In particular, seagrass response to <strong>the</strong>rmal stress,<br />
sediment perturbation, and eutrophication were given<br />
emphasis to assess <strong>the</strong> vulnerability <strong>of</strong> this ecosystem<br />
to climate change. However, since <strong>the</strong> available data<br />
did not include information on <strong>the</strong> zonation <strong>of</strong> species<br />
within a meadow, <strong>the</strong> sensitivity assessment was<br />
species-specific.<br />
25