of the Verde Island Passage, Philippines - weADAPT
of the Verde Island Passage, Philippines - weADAPT
of the Verde Island Passage, Philippines - weADAPT

You also want an ePaper? Increase the reach of your titles
YUMPU automatically turns print PDFs into web optimized ePapers that Google loves.
chapter 1 • vulnerability assessment <strong>of</strong> marine ecosystems and fisheries to climate change: introduction<br />
Changes in rainfall<br />
PAGASA precipitation records from Calapan,<br />
Mindoro and Ambulong, Batangas for <strong>the</strong> period<br />
1961 to 2004 show that annual rainfall fluctuates<br />
from 1000 to 3500 mm (Figure 13). The two records<br />
display similar seasonal fluctuations but opposing<br />
long-term precipitation trends over <strong>the</strong> 43-year<br />
period. Annual rainfall has increased in Calapan, but<br />
Ambulong shows an overall decrease. This highlights<br />
<strong>the</strong> spatial heterogeneity <strong>of</strong> rainfall and <strong>the</strong> need for<br />
more monitoring stations. More specifically, <strong>the</strong>re is<br />
a need for meteorological stations distributed along<br />
representative coastal areas <strong>of</strong> <strong>the</strong> VIP.<br />
Sea level rise<br />
The Global Sea Level Observing System has two sites<br />
in <strong>the</strong> <strong>Philippines</strong> (i.e., Manila and Legaspi). Both <strong>of</strong><br />
<strong>the</strong>se coastal data show a relative sea-level increase<br />
<strong>of</strong> between 20cm and 40cm since <strong>the</strong> 1960s (Figure<br />
14). This observed rise is most likely a compounded<br />
3500<br />
3000<br />
consequence <strong>of</strong> excessive land reclamation, possible<br />
subsidence due to groundwater extraction and residual<br />
rise in sea-level due to warmer oceans.<br />
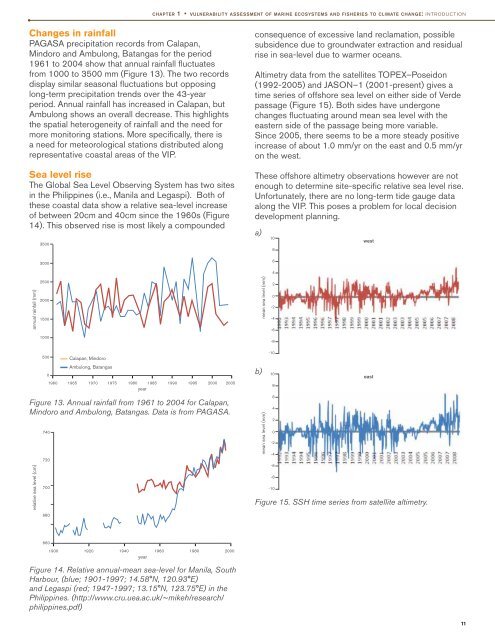
Altimetry data from <strong>the</strong> satellites TOPEX–Poseidon<br />
(1992-2005) and JASON–1 (2001-present) gives a<br />
time series <strong>of</strong> <strong>of</strong>fshore sea level on ei<strong>the</strong>r side <strong>of</strong> <strong>Verde</strong><br />
passage (Figure 15). Both sides have undergone<br />
changes fluctuating around mean sea level with <strong>the</strong><br />
eastern side <strong>of</strong> <strong>the</strong> passage being more variable.<br />
Since 2005, <strong>the</strong>re seems to be a more steady positive<br />
increase <strong>of</strong> about 1.0 mm/yr on <strong>the</strong> east and 0.5 mm/yr<br />
on <strong>the</strong> west.<br />
These <strong>of</strong>fshore altimetry observations however are not<br />
enough to determine site-specific relative sea level rise.<br />
Unfortunately, <strong>the</strong>re are no long-term tide gauge data<br />
along <strong>the</strong> VIP. This poses a problem for local decision<br />
development planning.<br />
a)<br />
10<br />
8<br />
6<br />
west<br />
4<br />
annual rainfall (mm)<br />
2500<br />
2000<br />
1500<br />
1000<br />
mean sea level (mm)<br />
2<br />
0<br />
-2<br />
-4<br />
-6<br />
-8<br />
Figure 13. Annual rainfall from 1961 to 2004 for Calapan,<br />
Mindoro and Ambulong, Batangas. Data is from PAGASA.<br />
relative sea level (cm)<br />
500<br />
0<br />
740<br />
720<br />
700<br />
680<br />
Calapan, Mindoro<br />
Ambulong, Batangas<br />
1960 1965 1970 1975 1980 1985 1990 1995 2000 2005<br />
year<br />
b)<br />
mean sea level (mm)<br />
-10<br />
10<br />
east<br />
8<br />
6<br />
4<br />
2<br />
0<br />
-2<br />
-4<br />
-6<br />
-8<br />
-10<br />
Figure 15. SSH time series from satellite altimetry.<br />
660<br />
1900 1920 1940 1960 1980 2000<br />
year<br />
Figure 14. Relative annual-mean sea-level for Manila, South<br />
Harbour, (blue; 1901-1997; 14.58°N, 120.93°E)<br />
and Legaspi (red; 1947-1997; 13.15°N, 123.75°E) in <strong>the</strong><br />
<strong>Philippines</strong>. (http://www.cru.uea.ac.uk/~mikeh/research/<br />
philippines.pdf)<br />
11