risk management - monitor ii
risk management - monitor ii
risk management - monitor ii

Create successful ePaper yourself
Turn your PDF publications into a flip-book with our unique Google optimized e-Paper software.
40 Monitor II Information needs<br />
Monitor II Information needs 41<br />
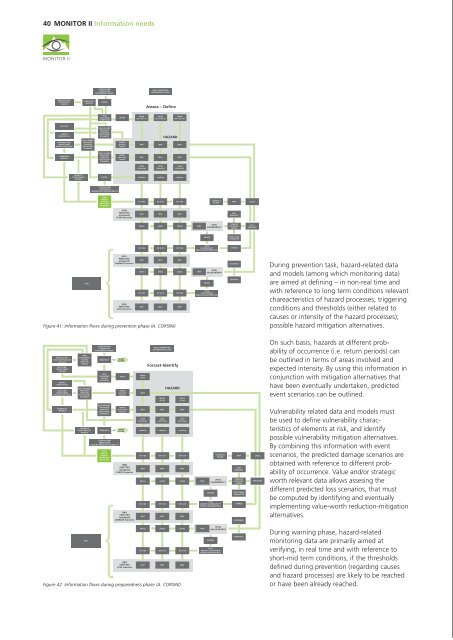
Figure 41: Information flows during prevention phase (A. CORSINI)<br />
ALTER/ALARM<br />
THRESHOLDS<br />
(TRIGGERING CAUSES)<br />
(FH4)<br />
MODELS FOR<br />
TRIGGERING<br />
REAL-TIME FORCAST<br />
CAUSES<br />
REACHED YES<br />
ALERT<br />
ALARM<br />
(CAUSES)<br />
EXPECTEC<br />
TRENDS<br />
REAL-TIME<br />
MONITORING<br />
CAUSES<br />
(FH3)<br />
TRIGGERING<br />
define<br />
CAUSES<br />
SITUATION<br />
SURVEY<br />
(FIELD & R.S.)<br />
(FH1) HAZARD<br />
REAL-TIME<br />
PROCESSES<br />
WHERE<br />
MONITORING<br />
ONGOING<br />
”present”<br />
HAZARD PROCESSES EVOLUTION/<br />
(zones)<br />
DYNAMICS<br />
(FH2) HAZARD<br />
PROCESSES<br />
WHERE<br />
NUMERICAL<br />
EXPECTED<br />
“potentialy”<br />
MODELS<br />
EVOLUTION/<br />
(zones)<br />
DYNAMICS<br />
HEURISTIC<br />
ALERT<br />
EXPERT-BASED<br />
REACHED YES<br />
ALARM<br />
MODELS<br />
ALTER/ALARM<br />
THRESHOLDS<br />
(HAZARD PROCESSES INTENSITY)<br />
(FH6)<br />
URGENT<br />
HAZARD<br />
MITIGATION<br />
MEASURES<br />
(FR6)<br />
EXPECTED<br />
(mitigated)<br />
EVENT Scenarios<br />
(FR1)<br />
EXPECTED<br />
(mitigated)<br />
DAMAGE Scenarios<br />
WHEN<br />
(now)<br />
MAP<br />
MAP<br />
HOW<br />
(Intensity)<br />
combine<br />
BASIC SUPPORTING<br />
GEOGRAPHICAL DATA<br />
Forcast-Identify<br />
HAZARD<br />
WHEN<br />
WHEN<br />
(24 h)<br />
(xx h)<br />
MAP<br />
MAP<br />
HOW<br />
HOW<br />
(Intensity)<br />
(Intensity)<br />
combine<br />
combine<br />
DE O DE DE O DE DE O DE<br />
MAP<br />
MAP<br />
MAP<br />
CROSS<br />
CROSS<br />
CROSS<br />
DE O DE DE O DE DE O DE<br />
MAP<br />
MAP<br />
MAP<br />
(PV4)<br />
COST/WORTH<br />
REDUCTION ALTERNATIVES<br />
ELEMENTS<br />
AT RISK<br />
(PV2)<br />
MAP<br />
VUlNERABILiTY<br />
CHANGE<br />
(FV1)<br />
URGENT VULNERABILITY<br />
REDUCTION MEASURES<br />
MAP<br />
PAST<br />
DAMAGES<br />
DAMAGE<br />
POTENTIAL<br />
CURVES<br />
STRUCTURAL<br />
CHARACTER<br />
CHANGE<br />
ECONOMIC<br />
CROSS<br />
EXPOSURE<br />
During prevention task, hazard-related data<br />
and models (among which <strong>monitor</strong>ing data)<br />
are aimed at defining – in non-real time and<br />
with reference to long term conditions relevant<br />
chareacteristics of hazard processes; triggering<br />
conditions and thresholds (either related to<br />
causes or intensity of the hazard processes);<br />
possible hazard mitigation alternatives.<br />
On such basis, hazards at different probability<br />
of occurrence (i.e. return periods) can<br />
be outlined in terms of areas involved and<br />
expected intensity. By using this information in<br />
conjunction with mitigation alternatives that<br />
have been eventually undertaken, predicted<br />
event scenarios can be outlined.<br />
Vulnerability related data and models must<br />
be used to define vulnerability characteristics<br />
of elements at <strong>risk</strong>, and identify<br />
possible vulnerability mitigation alternatives.<br />
By combining this information with event<br />
scenarios, the predicted damage scenarios are<br />
obtained with reference to different probability<br />
of occurrence. Value and/or strategic<br />
worth relevant data allows assesing the<br />
different predicted loss scenarios, that must<br />
be com puted by identifying and eventually<br />
implementing value-worth reduction-mitigation<br />
alternatives.<br />
Models are used to forecast the future shortmid<br />
term trend of triggering causes and also<br />
the possible evolution of the expected hazard<br />
processes. On such basis, nowcasting of hazard<br />
and forecasting of hazard in the short-mid<br />
term can be obtained.<br />
Information regarding hazard mitigation<br />
measures undertaken on prevention, or the<br />
mitigation measures that can be undertaken<br />
urgently to control the hazard processes, are<br />
used in conjunction with hazard information in<br />
order to depict the predicted event scenario in<br />
the short and mid-term.<br />
All the information and data about vulnerability<br />
that where acquired, processed and<br />
synthesised in prevention phase, become useful<br />
since they allow nowcasting and forecasting<br />
expected damage scenarios, that must be draw<br />
out by accounting for possible implementation<br />
of urgent vulnerability reduction measures.<br />
Subsequently, all the information and data<br />
about value and worth must be used and updated<br />
accordingly to possible urgent cost-worth<br />
reduction measures (e.g. eva cuation measures),<br />
so to outline expected loss scenarios.<br />
During response, a timely update on the<br />
ongoing situation is essential. Response is carried<br />
out while forecasting is still ongoing, so to have<br />
a clear picture of what is actually going on and<br />
of what can happen next in the short term.<br />
Evaluation of the ongoing hazard processes<br />
and of the performance/efficacy of hazard<br />
mitigation measures implemented in prevention<br />
and forecast is essential to assess hazard and<br />
ongoing event scenario. In this phase, the feedback<br />
of data (observations-measurements etc.)<br />
from the field is essential and can be carried out<br />
via different means.<br />
CROSS<br />
CROSS<br />
CROSS<br />
RISK<br />
DE O DE DE O DE DE O DE<br />
(FR2)<br />
EXPECTED<br />
MAP<br />
MAP<br />
MAP<br />
LOSS Scenarios<br />
Figure 42: Information flows during preparedness phase (A. CORSINI)<br />
(PV3)<br />
MAP<br />
VALUE/WORTH<br />
CHANGE<br />
(FV1)<br />
URGENT COST/WORTH<br />
REDUCTION MEASURES<br />
STRATEGIC<br />
During warning phase, hazard-related<br />
<strong>monitor</strong>ing data are primarily aimed at<br />
verifying, in real time and with reference to<br />
short-mid term conditions, if the thresholds<br />
defined during prevention (regarding causes<br />
and hazard processes) are likely to be reached<br />
or have been already reached.<br />
Figure 43: Information flows during response phase (A. CORSINI)<br />
At the same time, the direct observationmeasurement<br />
of the efficacy of vulnearability<br />
and/or cost-worth reduction measures that<br />
have been set up during prevention and<br />
forecast, is fundamental in order to define and<br />
continously update ongoing damage and loss<br />
scenarios.